Comparison PowerPoint Templates, Comparison Tables PPT Templates, Comparison Charts Templates
- Sub Categories
-
- 30 60 90 Day Plan
- About Us Company Details
- Action Plan
- Agenda
- Annual Report
- Audit Reports
- Balance Scorecard
- Brand Equity
- Business Case Study
- Business Communication Skills
- Business Plan Development
- Business Problem Solving
- Business Review
- Capital Budgeting
- Career Planning
- Change Management
- Color Palettes
- Communication Process
- Company Location
- Company Vision
- Compare
- Competitive Analysis
- Corporate Governance
- Cost Reduction Strategies
- Custom Business Slides
- Customer Service
- Dashboard
- Data Management
- Decision Making
- Digital Marketing Strategy
- Digital Transformation
- Disaster Management
- Diversity
- Equity Investment
- Financial Analysis
- Financial Services
- Financials
- Growth Hacking Strategy
- Human Resource Management
- Innovation Management
- Interview Process
- Knowledge Management
- Leadership
- Lean Manufacturing
- Legal Law Order
- Management
- Market Segmentation
- Marketing
- Media and Communication
- Meeting Planner
- Mergers and Acquisitions
- Metaverse
- Newspapers
- Operations and Logistics
- Organizational Structure
- Our Goals
- Performance Management
- Pitch Decks
- Pricing Strategies
- Process Management
- Product Development
- Product Launch Ideas
- Product Portfolio
- Project Management
- Purchasing Process
- Quality Assurance
- Quotes and Testimonials
- Real Estate
- Risk Management
- Sales Performance Plan
- Sales Review
- SEO
- Service Offering
- Six Sigma
- Social Media and Network
- Software Development
- Solution Architecture
- Stock Portfolio
- Strategic Management
- Strategic Planning
- Supply Chain Management
- Swimlanes
- System Architecture
- Team Introduction
- Testing and Validation
- Thanks-FAQ
- Time Management
- Timelines Roadmaps
- Value Chain Analysis
- Value Stream Mapping
- Workplace Ethic
-
 Equal image of a scale in hexagon
Presenting equal image of a scale in hexagon. This is a equal image of a scale in hexagon. This is a two stage process. The stages in this process are equal, proportional, identical.
-
 Equal image of a scale with triangular base
Presenting equal image of a scale with triangular base. This is a equal image of a scale with triangular base. This is a two stage process. The stages in this process are equal, proportional, identical.
-
 Equal image of human holding balance scale
Presenting equal image of human holding balance scale. This is a equal image of human holding balance scale. This is a two stage process. The stages in this process are equal, proportional, identical.
-
 Equal image of scale held by human
Presenting Equal Image Of Scale Held By Human. The PPT also supports the standard (4:3) and widescreen (16:9) aspect ratios. It is compatible with Google Slides. Save this into various images or document formats such as JPEG, PNG or PDF. High-quality graphics ensure that picture quality remains the same even when the size is enlarged.
-
 Equal image shown by dollar house and fulcrum
Presenting equal image shown by dollar house and fulcrum. This is a equal image shown by dollar house and fulcrum. This is a two stage process. The stages in this process are equal, proportional, identical.
-
 Equal image shown by fulcrum balancing two circles
Presenting equal image shown by fulcrum balancing two circles. This is a equal image shown by fulcrum balancing two circles. This is a two stage process. The stages in this process are equal, proportional, identical.
-
 Equal image shown by human scale balancing things in hexagon
Presenting equal image shown by human scale balancing things in hexagon. This is a equal image shown by human scale balancing things in hexagon. This is a two stage process. The stages in this process are equal, proportional, identical.
-
 Equal sign with two circles on a fulcrum
Presenting equal sign with two circles on a fulcrum. This is a equal sign with two circles on a fulcrum. This is a two stage process. The stages in this process are equal, proportional, identical.
-
 Equal signs shown by scale balance and dollar
Presenting equal signs shown by scale balance and dollar. This is a equal signs shown by scale balance and dollar. This is a two stage process. The stages in this process are equal, proportional, identical.
-
 Equal image shown by human scale balancing things
Presenting equal image shown by human scale balancing things. This is a equal image shown by human scale balancing things. This is a two stage process. The stages in this process are equal, proportional, identical.
-
 Delivery plan 30 60 90 days plans
Presenting this Delivery Plan 30 60 90 Days Plans PowerPoint presentation. Add charts and graphs for a clear representation of information. The slide also supports the standard (4:3) and widescreen (16:9) aspect ratios. It is having compatibility with Google Slides. Transform this into various images or document formats such as JPEG, PNG or PDF. High-quality graphics ensure that the picture quality always remains the same.
-
 Delivery plan date requested received and priority
Presenting this Delivery Plan Date Requested Received and Priority PowerPoint presentation. The slide is fully customizable in MS PowerPoint. Modify the font style, font color, and other attributes within seconds. The PPT is also compatible with Google Slides. Convert this into numerous documents or image formats such as PDF or JPEG. High-quality graphics ensure that picture quality is not affected at any cost.
-
 Delivery plan market customers themes and features
Presenting Delivery Plan Market Customers Themes And Features. Include impressive data visualization tools like charts, graphs, and tables, etc. You can edit the slideshow according to your requirements. This slide can be easily saved into various images or document formats like JPEG, PNG or PDF. The slide is also compatible with Google Slides and editable in MS PowerPoint. High-quality graphics ensure that quality does not deteriorate even when size is enlarged.
-
 Delivery plan market scope risks and dependencies
Presenting delivery plan market scope risks and dependencies. This is a delivery plan market scope risks and dependencies. This is a three stage process. The stages in this process are delivery plan, distribution strategy, transporting plan.
-
 Delivery plan task name responsibility and status table and chart
Presenting delivery plan task name responsibility and status table and chart. This is a delivery plan task name responsibility and status table and chart. This is a three stage process. The stages in this process are delivery plan, distribution strategy, transporting plan.
-
 Delivery present future and development plan
Presenting this Delivery Present Future and Development Plan PowerPoint presentation. Add charts and graphs for a clear display of facts. The slide supports the standard (4:3) and widescreen (16:9) sizes for increased clarity. It is also compatible with Google Slides. Save this into various images or document formats like JPEG, PNG or PDF. High-quality graphics will ensure that the quality is not compromised.
-
 Monthly delivery plan with legends
Presenting monthly delivery plan with legends. This is a monthly delivery plan with legends. This is a two stage process. The stages in this process are delivery plan, distribution strategy, transporting plan.
-
 Six columns table with ten points
Presenting six columns table with ten points. This is a six columns table with ten points. This is a six stage process. The stages in this process are delivery plan, distribution strategy, transporting plan.
-
 Three columns with five rows table
Presenting the Three Columns with Five Rows PPT template, an open-ended layout available for download in standard and widescreen sizes. Now exploit its editable nature to input, arrange or delete data without worrying about it pixelating. You can then share and download data on the internet with your colleagues as Google Slides supports it. You can also view and share the PNG, JPEG, and PDF formats of this slide.
-
 Colorful dollar increase and decrease sign icons
Presenting colorful dollar increase and decrease sign icons. This is a colorful dollar increase and decrease sign icons. This is a two stage process. The stages in this process are increase decrease, up down, upward downward.
-
 Dollar increase and decrease sign icon with background
Presenting dollar increase and decrease sign icon with background. This is a dollar increase and decrease sign icon with background. This is a two stage process. The stages in this process are increase decrease, up down, upward downward.
-
 Increase decrease arrow inward and outward icons
Presenting increase decrease arrow inward and outward icons. This is a increase decrease arrow inward and outward icons. This is a two stage process. The stages in this process are increase decrease, up down, upward downward.
-
 Increase decrease percentage up and down icons
Presenting increase decrease percentage up and down icons. This is a increase decrease percentage up and down icons. This is a two stage process. The stages in this process are increase decrease, up down, upward downward.
-
 Increase decrease percentage up and down shadow icons
Presenting increase decrease percentage up and down shadow icons. This is a increase decrease percentage up and down shadow icons. This is a two stage process. The stages in this process are increase decrease, up down, upward downward.
-
 Increase decrease rolling arrow upward and downward
Presenting increase decrease rolling arrow upward and downward. This is a increase decrease rolling arrow upward and downward. This is a two stage process. The stages in this process are increase decrease, up down, upward downward.
-
 Increase decrease zoom in and out icons
Presenting Increase Decrease Zoom In And Out Icons. The slide is completely editable. It can be saved in various document formats such as JPEG, PNG or PDF(Portable Document Format). The slide is compatible with Google Slides which makes it accessible at once. Moreover, both standard screen (4:3) and widescreen (16:9) aspect ratios are supported. High-quality graphics ensure that distortion does not occur.
-
 Increasing and decreasing arrows diagram
Presenting increasing and decreasing arrows diagram. This is a increasing and decreasing arrows diagram. This is a two stage process. The stages in this process are increase decrease, up down, upward downward.
-
 Profit increase decrease productivity level
Presenting this Profit Increase Decrease Productivity Level PPT PowerPoint presentation. Add charts and graphs for a stunning display of information. The slide supports the standard (4:3) and widescreen (16:9) sizes. It is compatible with Google Slides. Transform this into common images or document formats like JPEG, PNG or PDF. High-quality graphics ensure that picture quality is not affected.
-
 Two cubes with arrow pointing increase and decrease
Presenting two cubes with arrow pointing increase and decrease. This is a two cubes with arrow pointing increase and decrease. This is a two stage process. The stages in this process are increase decrease, up down, upward downward.
-
 Zoom in and out icons with background
Presenting Zoom In And Out Icons With Background slide. The slide is completely editable. It can be saved in various document formats such as JPEG, PNG or PDF(Portable Document Format). The slide is compatible with Google Slides which makes it accessible at once. Moreover, both standard screen(4:3) and widescreen(16:9) aspect ratios are supported. High-quality graphics ensure that distortion does not occur.
-
 Gender differentiation percentage
Presenting Gender Differentiation Percentage. This PowerPoint template supports both the widescreen (16:9) and the standard screen aspect ratios(4:3). Add appealing content like charts and graphs to the presentation. The slide is also compatible with Google Slides. This slide can be converted into common image formats like JPEG, PNG or document formats such as PDF. High-quality graphics will prevent the deterioration of slide components.
-
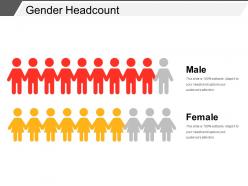 Gender headcount
Presenting gender headcount. This is a gender headcount. This is a two stage process. The stages in this process are headcount, male female comparison, male female ratio.
-
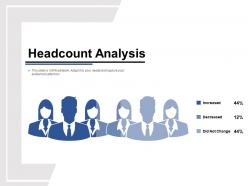 Headcount analysis
Presenting Headcount Analysis slideshow. The slide is compatible with Google Slides. This PowerPoint template supports both the widescreen (16:9) and the standard screen aspect ratios(4:3). Add appealing content like charts and graphs to the presentation. This slide can be converted into common image formats like JPEG, PNG or document formats such as PDF. High-quality graphics will prevent the deterioration of slide components.
-
 Headcount analysis layout
Presenting headcount analysis layout. This is a headcount analysis layout. This is a two stage process. The stages in this process are headcount, male female comparison, male female ratio.
-
 Headcount analysis percentage
Presenting Headcount Analysis Percentage slideshow. This PowerPoint template supports both the widescreen (16:9) and the standard screen aspect ratios(4:3). The slide is compatible with Google Slides. Add appealing content like charts and graphs to the presentation. This slide can be converted into common image formats like JPEG, PNG or document formats such as PDF. High-quality graphics will prevent the deterioration of slide components.
-
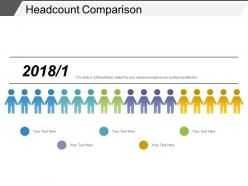 Headcount comparison
Presenting headcount comparison. This is a headcount comparison. This is a five stage process. The stages in this process are headcount, male female comparison, male female ratio.
-
 Headcount comparison layout
Presenting headcount comparison layout. This is a headcount comparison layout. This is a two stage process. The stages in this process are headcount, male female comparison, male female ratio.
-
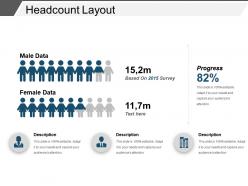 Headcount layout
Presenting headcount layout. This is a headcount layout. This is a two stage process. The stages in this process are headcount, male female comparison, male female ratio.
-
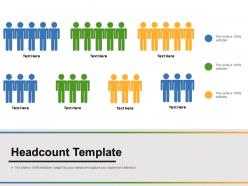 Headcount template
Presenting headcount template. This is a headcount template. This is a three stage process. The stages in this process are headcount, male female comparison, male female ratio.
-
 Headcount with three titles
Presenting headcount with three titles. This is a headcount with three titles. This is a three stage process. The stages in this process are headcount, male female comparison, male female ratio.
-
 Male female percentage comparison chart
Presenting Male Female Percentage Comparison Chart presentation. The slide is fully customizable in PowerPoint and other office suites. Customize the slide as per your requirements. Transform this template into various documents or image formats like PDF or JPEG. Alter the font style, font color, and other components with ease. The slide is also compatible with Google Slides. High-quality graphics ensure that quality is always maintained.
-
 Three points headcount
Presenting three points headcount. This is a three points headcount. This is a two stage process. The stages in this process are headcount, male female comparison, male female ratio.
-
 Yearly gender comparison
Presenting Yearly Gender Comparison presentation. Customize the slide as per your requirements. Transform this template into various document or image formats like PDF or JPEG. The slide is fully customizable in PowerPoint and other office suites. Alter the font style, font color, and other components with ease. The slide is also compatible with Google Slides. High-quality graphics ensure that quality is always maintained.
-
 Customer acquisition cost powerpoint templates
Presenting customer acquisition cost powerpoint templates. This is a customer acquisition cost powerpoint templates. This is a two stage process. The stages in this process are flow, total paid web visitors, customers, conversion, input variables.
-
 Ideal acquisition cost model powerpoint shapes
Presenting ideal acquisition cost model powerpoint shapes. This is a ideal acquisition cost model powerpoint shapes. This is a two stage process. The stages in this process are balancing act, cost to acquire a customer, monetization, viral effects.
-
 Recruitment budget presentation ideas
Presenting recruitment budget presentation ideas. This is a recruitment budget presentation ideas. This is a three stage process. The stages in this process are salary budget, no of employees to be hired, total recruitment expenses.
-
 Brand budgeting good ppt example
Presenting brand budgeting good ppt example. This is a brand budgeting good ppt example. This is a three stage process. The stages in this process are task, brand mark, advertising, seo, social media, core brand presentations .
-
 Comparison based on criteria powerpoint templates microsoft
Presenting comparison based on criteria powerpoint templates microsoft. This is a comparison based on criteria powerpoint templates microsoft. This is a six stage process. The stages in this process are revenue, profit, market share, main activity.
-
 Establish brand positioning ppt background
Presenting establish brand positioning ppt background. This is a establish brand positioning ppt background. This is a three stage process. The stages in this process are key benefits, price, value proposition, company and product.
-
 Market competitiveness ppt background template
Presenting market competitiveness ppt background template. This is a market competitiveness ppt background template. This is a three stage process. The stages in this process are own, key success factors, ratings, competitor, weight.
-
 Comparison powerpoint topics template 1
Presenting comparison powerpoint topics template 1. This is a comparison powerpoint topics template 1. This is a two stage process. The stages in this process are male, female, compare, in percentage, business.
-
 Brand budgeting powerpoint slide influencers
Presenting brand budgeting powerpoint slide influencers. This is a brand budgeting powerpoint slide influencers. This is a two stage process. The stages in this process are name development, brand mark, core brand presentation, advertising, social media.
-
 Comparison based on criteria ppt images gallery
Presenting comparison based on criteria ppt images gallery. This is a comparison based on criteria ppt images gallery. This is a six stage process. The stages in this process are revenue, profit, market share, main activity, product quality.
-
 Comparison ppt presentation examples
Presenting comparison ppt presentation examples. This is a comparison ppt presentation examples. This is a two stage process. The stages in this process are comparison, percentage, business, marketing.
-
 Competitive analysis ppt sample download
Presenting competitive analysis ppt sample download. This is a competitive analysis ppt sample download. This is a four stage process. The stages in this process are own company, competitors, emphasizing weaknesses, emphasizing the strengths, strengths.
-
 Market competitiveness presentation powerpoint example
Presenting market competitiveness presentation powerpoint example. This is a market competitiveness presentation powerpoint example. This is a three stage process. The stages in this process are financial position, advertising, market share, brand image, customer loyalty.
-
 Business transition methods and validation
Presenting business transition methods and validation. This is a business transition methods and validation. This is a four stage process. The stages in this process are business transition, transition process.
-
 Business transition plan 90 days sprints
Presenting business transition plan 90 days sprints. This is a business transition plan 90 days sprints. This is a three stage process. The stages in this process are business transition, transition process.
-
 Business transition roles and responsibilities
Presenting Business Transition Roles And Responsibilities slide. This slide is 100% editable in PowerPoint. You can alter the font type, size, diagram color, background color, etc. This template can be saved in multiple image formats such as JPEG, PNG, and PDF. It is compatible with Google Slides which makes it accessible at once and can be saved in multiple image formats such as JPEG, PNG and document formats such as PDF. The quality does not deteriorate when projected on the full screen.
-
 Business transition task duration and predecessors
Presenting business transition task duration and predecessors. This is a business transition task duration and predecessors. This is a four stage process. The stages in this process are business transition, transition process.
-
Great quality product.
-
Commendable slides with attractive designs. Extremely pleased with the fact that they are easy to modify. Great work!
-
Design layout is very impressive.
-
Top Quality presentations that are easily editable.
-
Enough space for editing and adding your own content.
-
Easily Understandable slides.
-
Understandable and informative presentation.
-
Very unique and reliable designs.
-
Awesome presentation, really professional and easy to edit.
-
Wonderful templates design to use in business meetings.


