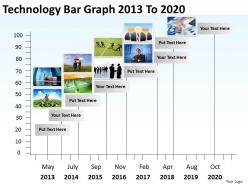
Product roadmap timeline technology bar graph 2013 to 2020 powerpoint templates slides
Download and craft this professional product roadmap timeline technology bar graph 2013 to 2020 PowerPoint slides. This wonderful PPT icon has got a pictorial rendition of the statistical data where the independent variable can be achieved only through the discrete values. A presenter can vividly present the growth of the business and technology through this efficient PPT design. The design can actually work well when it is about sequencing the complex timelines for the presentations. Bar graph tools are basically used for comparing the data elements against some kind of measure of the data. A presenter can in fact measure the changes or the growth while tracking the varied statistics with a combined line and the bar graph for earnings. Creating a roadmap chart is simple process and one brings this design in execution for portraying the business activities or the results produced so far. Thus ensure the best use of this design.Strike gold with our Product Roadmap Timeline Technology Bar Graph 2013 To 2020 Powerpoint Templates Slides. Your ideas will prove to be gems.
You must be logged in to download this presentation.
 Impress your
 audience
Editable
of Time
PowerPoint presentation slides
Use of high-resolution images. Allow instant replacement of the icons or the images. Customize the background, orientation or size of the images or icons. Offered instructions to make changes and modify the slide icons. Useful for the business entrepreneurs, business presenters and the team leaders.
People who downloaded this PowerPoint presentation also viewed the following :
Product roadmap timeline technology bar graph 2013 to 2020 powerpoint templates slides with all 6 slides:
Turn the corner with our Product Roadmap Timeline Technology Bar Graph 2013 To 2020 Powerpoint Templates Slides. They will point you in the right direction.
-
Easily Editable.
-
Innovative and attractive designs.


