Annual report design process powerpoint presentation with slides
Wish to get better with your next annual report design process complete PowerPoint show? No problem! Just download our readymade business annual report PPT model to effectively make mark. With support of this PPT example you can cast spotlight on your company’s previous years operations so as to strengthen relationships with partners and investors. Furthermore, our presentation deck helps to portray a transparent concise view of company’s resources, finances and future plans to build credibility among customers. Additionally, with help of this pictorial show you can make a visual communication underlining your company’s major accomplishments as well as can also effectively indicate the anticipated roadblocks. To keep the audience on edge our visual demonstration comprises of PowerPoint templates like financial highlights, sales highlights, profit after tax pat, net fixed asset turnover, market cap and many more. All in all, a must download for company directors, policy analysts, finance managers and auditors. So, now you have an ideal PPT sample to portray a report on business. Just roll up your sleeves to craft something awesome. Convince folks to act with greater commitment with our annual report ppt With Slides. Improve their degree of dedication.
You must be logged in to download this presentation.
 Impress your
 audience
Editable
of Time
PowerPoint presentation slides
Professionally designed 60 template themes to make it a complete package. Customization option to make presentation designs a perfect fit, Switch easily to JPG or PDF formats. Vibrant colored presentation graphics and tables to give lively finish. Single click required to trigger downloading process. Easily come to tune with all modern software’s. PDF and JPG conversion option making it perfect in every way. The stages in this process are financial statement,10 k report, directors report, green annual report, auditors report, grey literature.
People who downloaded this PowerPoint presentation also viewed the following :
Content of this Powerpoint Presentation
Slide 1: This slide showcases Annual Report Design Process. State Your Company Name and get started.
Slide 2: This is an Agenda slide. State your agendas here.
Slide 3: This is an About Us slide. State your position, facts, team/company specifications or anything business here.
Slide 4: This is an About Our Company slide. State your position, facts, team/company specifications or anything business here.
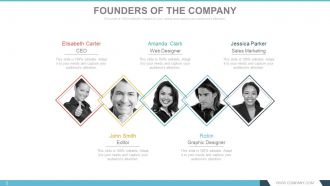
Slide 5: This slide showcases Founders Of The Company to state names, designation and respective image to go with.
Slide 6: This slide presents Our CEO’S Message. State any such message etc. here.
Slide 7: This slide also presents Our CEO’S Message. State any such message etc. here.
Slide 8: This is Our Vision slide. State the Vision of the company here.
Slide 9: This is Our Vision slide. State the Vision of the company here.
Slide 10: This is Our Mission slide. State the Mision of the company here.
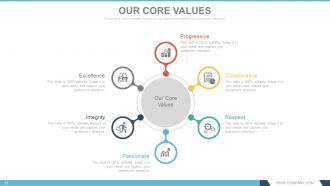
Slide 11: This slide shows Our Core Values. Some examples given are- Progressive, Collaborative, Respect, Passionate, Integrity, Excellence.
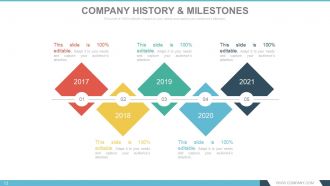
Slide 12: This slide presents Company History & Milestones in roadmap image.
Slide 13: This slide presents Company History & Milestones to be presented with icons and text boxes.
Slide 14: This slide presents Company Timeline to be presented with icons, graphs and text boxes etc.
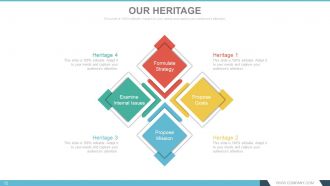
Slide 15: This slide showcases Our Heritage of the company to be shown.
Slide 16: This slide showcases Our Heritage of the company to be shown.
Slide 17: This slide displays the Organization Structure of the company to be presented.
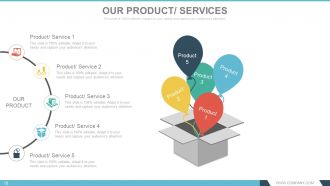
Slide 18: This slide presents Our Products/ Services to state specifications of Product/ Service.
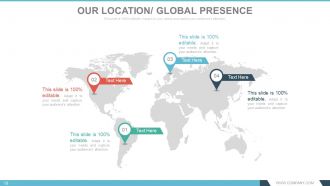
Slide 19: This slide shows Our Location/ Global Presence on world map image.
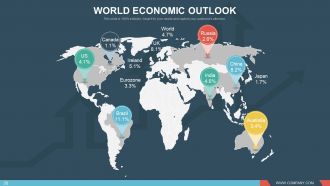
Slide 20: This slide shows World Economic Outlook with a world map image.
Slide 21: This slide presents World Sector Growth in bar graph form.
Slide 22: This slide displays Achievements with imagery and text boxes to go with.
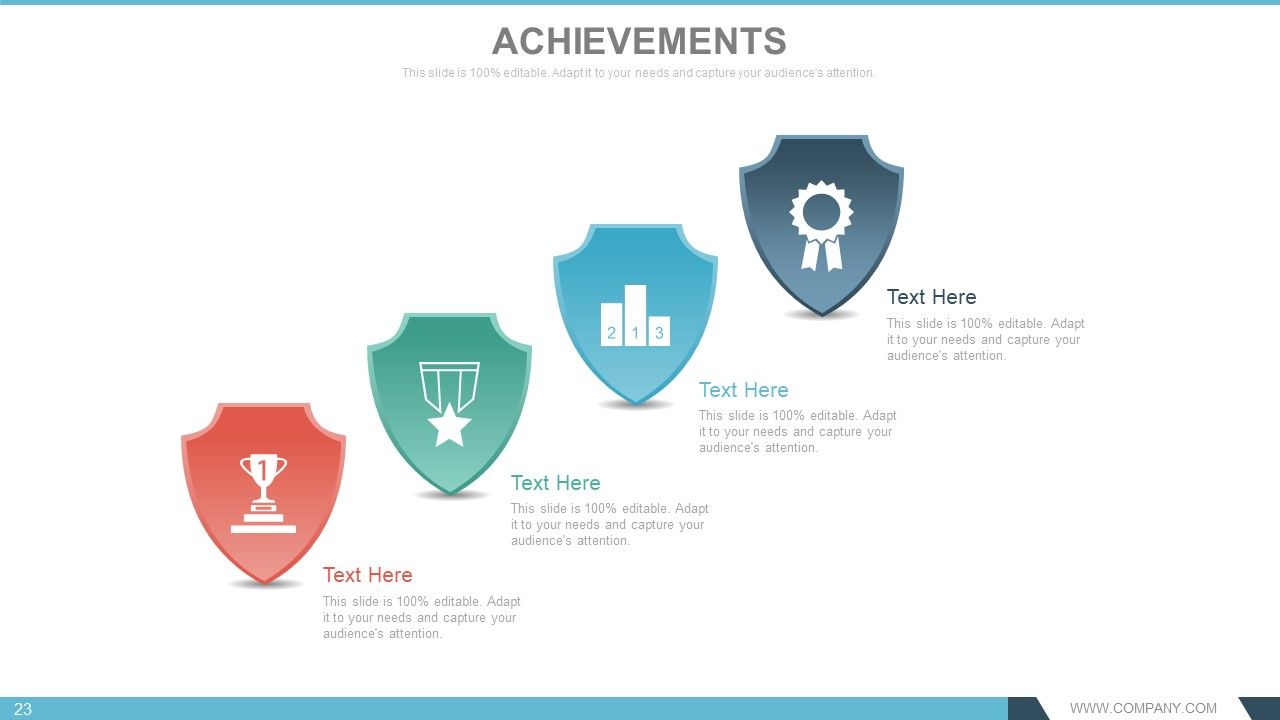
Slide 23: This slide displays Achievements with different imagery and text boxes to go with.
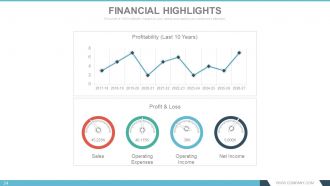
Slide 24: This slide shows Financial Highlights in Line graph form and metric scale for- Profit & Loss, Sales, Operating Expenses, Operating Income, Net Income and Profitability .
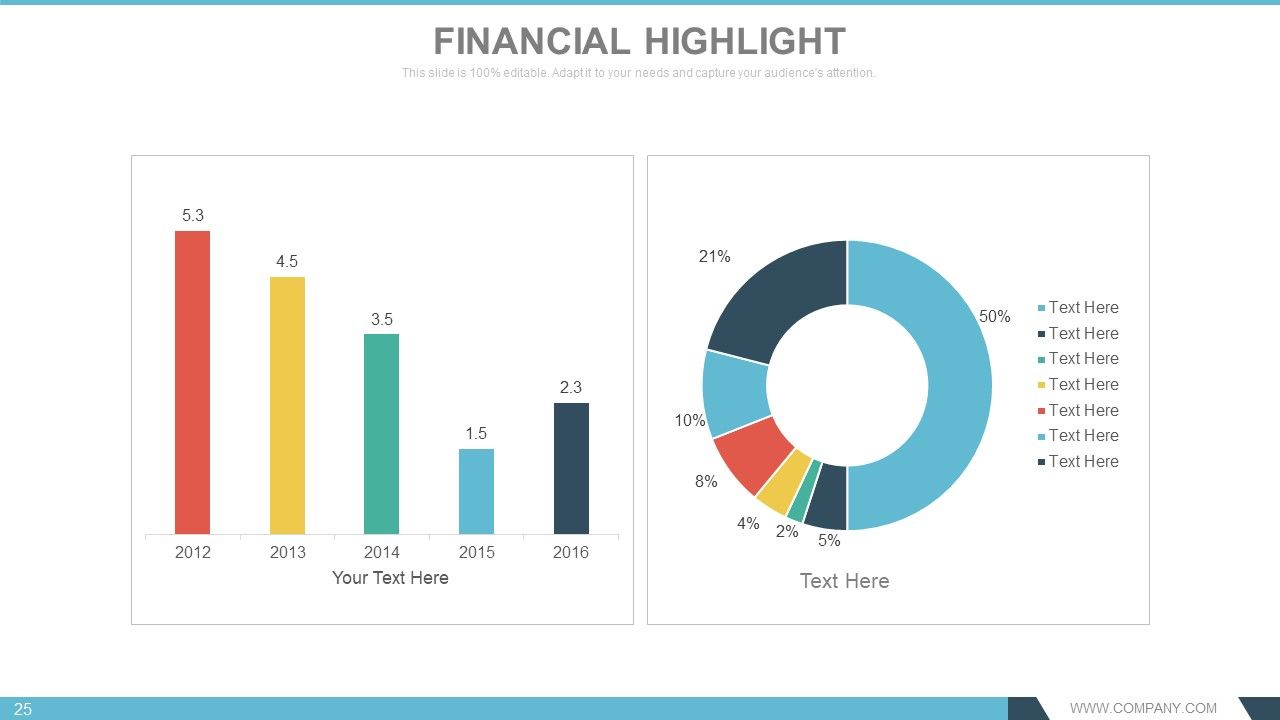
Slide 25: This slide presents Financial Highlights. State financial aspects here.
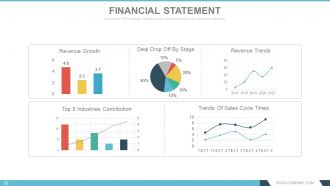
Slide 26: This slide shows a Financial Statement with the following subheadings- Revenue Trends, Revenue Growth, Deal Drop Off By Stage, Trends Of Sales Cycle Times, Top 5 Industries Contribution.
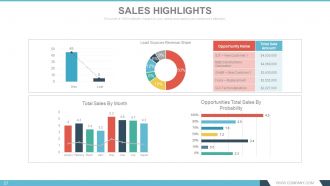
Slide 27: This slide shows Sales Highlights in different graphs form with the following points- Opportunities Total Sales By Probability, Total Sales By Month- Won : Lost Lead Sources Revenue Share.
Slide 28: This slide shows Distribution Growth in a creative graph form.
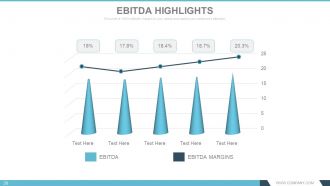
Slide 29: This slide showcases EBITDA Highlights in graph form.
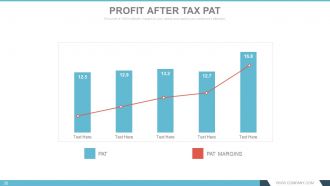
Slide 30: This slide presents Profit After Tax PAT in graph form.
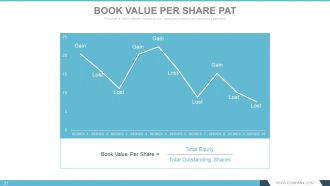
Slide 31: This slide shows Book Value Per Share PAT in line graph form in terms of- Lost and Gain.
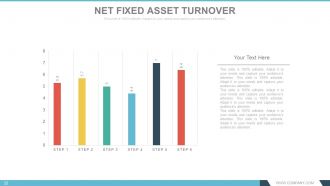
Slide 32: This slide shows Net Fixed Asset Turnover in graph form.
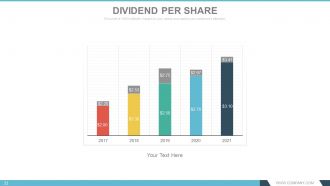
Slide 33: This slide shows Dividend Per Share in bar graph form.
Slide 34: This slide shows Market Cap in graph form.
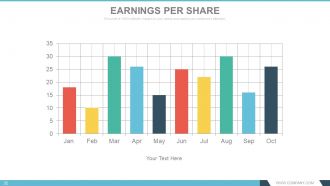
Slide 35: This slide showcases Earnings Per Share in graph form.
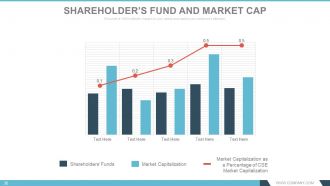
Slide 36: This slide presents Shareholder’s Fund And Market Cap in line graph and bar graph form displaying the following content- Market Capitalization as a Percentage of CSE Market Capitalization, Market Capitalization, Shareholders’ Funds.
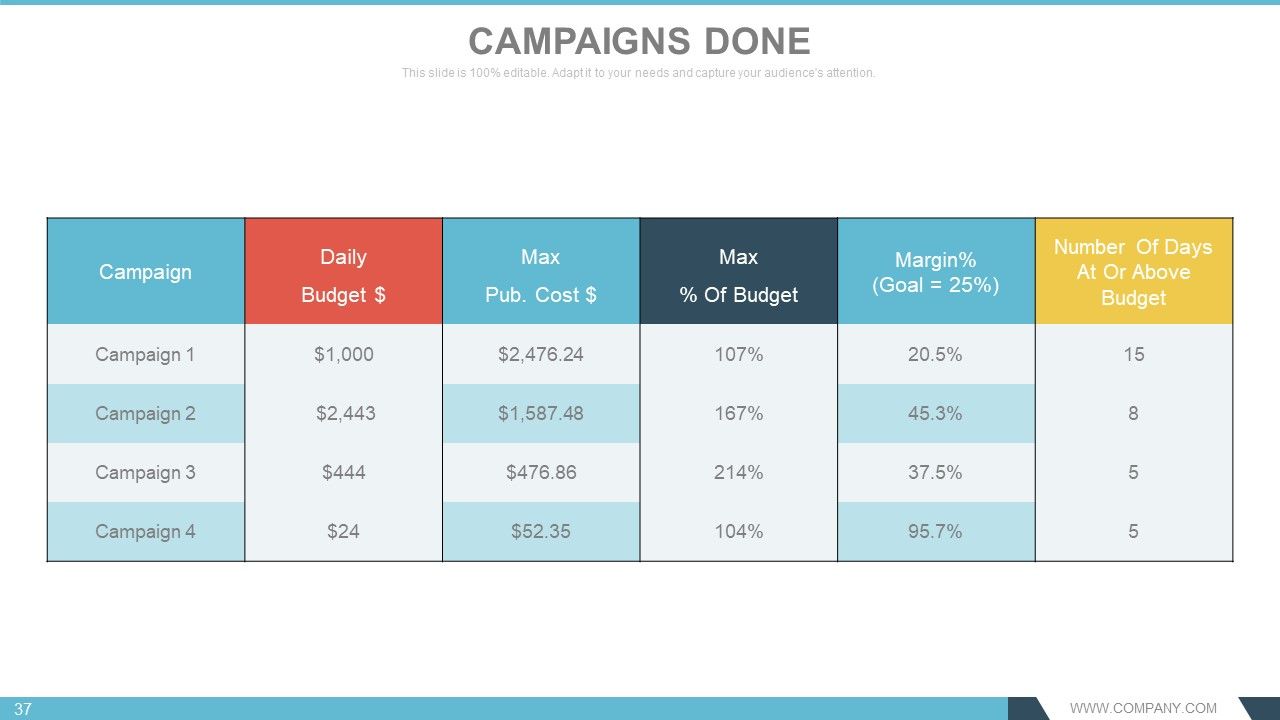
Slide 37: This slide showcases a Campaigns Done table.
Slide 38: This slide shows Campaign Report in tabular form.
Slide 39: This slide showcases Development In Past 10 Years in tabular form.
Slide 40: This slide also showcases Development In Past 10 Years in tabular form.
Slide 41: This slide shows Inflation Rate in graph form.
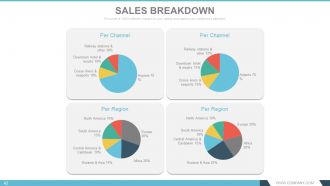
Slide 42: This slide presents Sales Breakdown divided into Per Channel and Per Region.
Slide 43: This slide presents Income Statement table.
Slide 44: This slide shows Working Capital Overview in scatter graph form with- Temporary Current Assets, Permanent Current Assets as marking points.
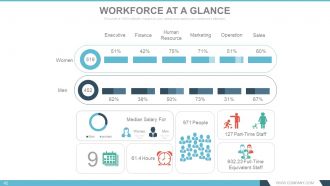
Slide 45: This slide presents Workforce At A Glance containing the following points- Executive, Finance, Human Resource, Marketing, Sales, Operation, Women, Part-Time Staff, Full-Time Equivalent Staff, People, Hours, Median Salary For, Women, Men.
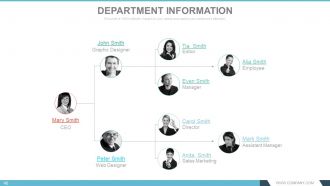
Slide 46: This slide presents Department Information as hierarchy image with names to display.
Slide 47: This slide presents Future Plans to be shown on a roadmap.
Slide 48: This slide showcases Our Team specifications with name, designation and image boxes.
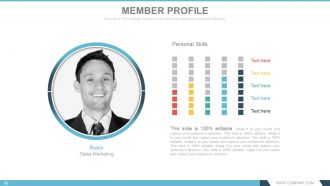
Slide 49: This slide presents a Member Profile with name, skills etc.
Slide 50: This slide is titled Additional Slides to proceed forward. You can change the slide content as per need.
Slide 51: This is an Our Goal slide. State goals etc. here.
Slide 52: This is a Financial Score table slide. State financial aspects here.
Slide 53: This is a Quotes slide to convey company messages, beliefs etc. You can change the slide content as per need.
Slide 54: This is a Dashboard slide to show kpis, metrics etc.
Slide 55: This is a Location slide of world map image to show global presence, growth etc.
Slide 56: This is a Timeline slide to present growth, journey, milestones etc.
Slide 57: This is a Bulb Or Idea slide to show innovative aspects, ideas, information etc.
Slide 58: This slide shows a Magnifying glass image with text boxes. State information etc. here.
Slide 59: This slide displays a Funnel image. State information, funneling aspects etc. here.
Slide 60: This is a Thank You slide with Address# street number, city, state, Contact Numbers, Email Address.
Annual report design process powerpoint presentation with slides with all 60 slides:
Establish your claim to being innovative with our Annual Report Design Process Complete Powerpoint Deck With Slides. Highlight your individual ingenuity.
-
Visually stunning presentation, love the content.
-
Great designs, really helpful.


