PowerPoint Maps Templates, Presentation Slides and World PPT Graphics
-
 Location united states china marketing strategy business
Presenting this set of slides with name - Location United States China Marketing Strategy Business. This is a two stage process. The stages in this process are Location, United States, China, Marketing, Strategy, Business.
-
 United nations icon showing hexagon and world map
Presenting this set of slides with name - United Nations Icon Showing Hexagon And World Map. This is a four stage process. The stages in this process are United Nations, UN, Country.
-
 Location china knowledge strategy action drive united states
Presenting this set of slides with name - Location China Knowledge Strategy Action Drive United States. This is a four stage process. The stages in this process are Location, China, Knowledge, Strategy, Action Drive, United States.
-
 Location africa north america asia information geography
Presenting this set of slides with name - Location Africa North America Asia Information Geography. This is a three stage process. The stages in this process are Location, Africa, North America, Asia, Information, Geography.
-
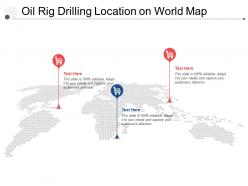 Oil rig drilling location on world map
Presenting this set of slides with name - Oil Rig Drilling Location On World Map. This is a three stage process. The stages in this process are Drilling, Train, Coach.
-
 Africa map ppt show format ideas
Presenting this set of slides with name - Africa Map Ppt Show Format Ideas. This is a three stage process. The stages in this process are Business, Management, Strategy, Analysis, Marketing.
-
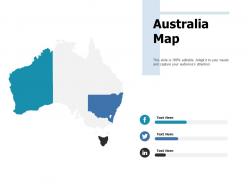 Australia map geographical ppt portfolio slide portrait
Presenting this set of slides with name - Australia Map Geographical Ppt Portfolio Slide Portrait. This is a three stage process. The stages in this process are Location, Information, Geography, Management, Strategy.
-
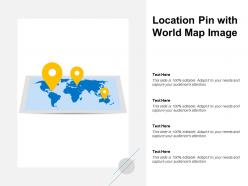 Location pin with world map image
Presenting this set of slides with name - Location Pin With World Map Image. This is a four stage process. The stages in this process are Map Pin, Target Location, Target Map.
-
 Binary code over world map
Presenting this set of slides with name - Binary Code Over World Map. This is a four stage process. The stages in this process are Binary Code, Script, Code.
-
 Papa johns international inc store count in china 2014-18
This is a professionally designed visual chart for Papa Johns International Inc Store Count In China 2014 to 18. This is part of our Data and Statistics products selection, and you will need a Paid account to download the actual report with accurate data and sources. Downloaded report will contain the editable graph with accurate data, an excel table with the actual data, the exact source of the data and the release date. This slide provides store count of Papa Johns International, Inc in China for the years 2014 to 18. Download it immediately and use it for your business.
-
 Asahi group holdings ltd statistic 1 overseas business segment southeast asia china
This is a professionally designed visual chart for Asahi Group Holdings Ltd Statistic 1 Overseas Business Segment Southeast Asia China. This is part of our Data and Statistics products selection, and you will need a Paid account to download the actual report with accurate data and sources. Downloaded report will contain the editable graph with accurate data, an excel table with the actual data, the exact source of the data and the release date. This slide shows the graph of Asahi Super Dry Brand Sales Volume for Overseas Business Segment Southeast Asia, China of Asahi Group Holdings, Ltd for the year 2014 to 18. Download it immediately and use it for your business.
-
 Sales by region north america europe ppt powerpoint presentation outline visual aids
Presenting this set of slides with name Sales By Region North America Europe Ppt Powerpoint Presentation Outline Visual Aids. This is a nine stage process. The stages in this process are Business, Management, Planning, Strategy, Marketing. This is a completely editable PowerPoint presentation and is available for immediate download. Download now and impress your audience.
-
 Bmw group bmw and mini outlets in china 2018
This is a professionally designed visual chart for BMW Group BMW And Mini Outlets In China 2018. This is part of our Data and Statistics products selection, and you will need a Paid account to download the actual report with accurate data and sources. Downloaded report will contain the editable graph with accurate data, an excel table with the actual data, the exact source of the data and the release date. This slide depicts the BMW and MINI outlets in China of the company BMW Group for the year 2018. Download it immediately and use it for your business.
-
 Heineken nv total revenue europe region 2014-2018
This is a professionally designed visual chart for Heineken Nv Total Revenue Europe Region 2014 to 2018. This is part of our Data and Statistics products selection, and you will need a Paid account to download the actual report with accurate data and sources. Downloaded report will contain the editable graph with accurate data, an excel table with the actual data, the exact source of the data and the release date. This slide shows Heineken NV Total Revenue of Europe Region from the years 2014 to 2018. Download it immediately and use it for your business.
-
 Heineken nv regional review stats europe 2017-2018
The information presented in this slide has been researched by our team of professional business analysts. This is part of our Company Profiles products selection, and you will need a Paid account to download the actual report with accurate data and sources. Downloaded report will be in Powerpoint and will contain the actual editable slides with the actual data and sources for each data. This slide shows Heineken NV Regional Review Statistics Europe in 2017 to 2018. Download it immediately and use it for your business.
-
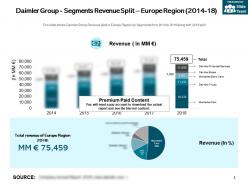 Daimler group segments revenue split europe region 2014-18
This is a professionally designed visual chart for Daimler Group Segments Revenue Split Europe Region 2014 to 18. This is part of our Data and Statistics products selection, and you will need a Paid account to download the actual report with accurate data and sources. Downloaded report will contain the editable graph with accurate data, an excel table with the actual data, the exact source of the data and the release date. This slide shows Daimler Group Revenue Split in Europe Region by Segments from 2014 to 2018 along with 2018 split. Download it immediately and use it for your business.
-
 Tesla inc revenue of china 2014-2018
This is a professionally designed visual chart for Tesla Inc Revenue Of China 2014 to 2018. This is part of our Data and Statistics products selection, and you will need a Paid account to download the actual report with accurate data and sources. Downloaded report will contain the editable graph with accurate data, an excel table with the actual data, the exact source of the data and the release date. This slide shows Revenue of Tesla Inc in China from the years 2014 to 2018. Download it immediately and use it for your business.
-
 Honda motor co ltd revenue from europe region 2014-2018
This is a professionally designed visual chart for Honda Motor Co Ltd Revenue From Europe Region 2014 to 2018. This is part of our Data and Statistics products selection, and you will need a Paid account to download the actual report with accurate data and sources. Downloaded report will contain the editable graph with accurate data, an excel table with the actual data, the exact source of the data and the release date. This slide shows the Hondas revenue from Europe region from 2014 to 2018 In billions JPY. Download it immediately and use it for your business.
-
 Fiat chrysler automobiles emea segment stats 2017-2018
This is a professionally designed visual chart for Fiat Chrysler Automobiles EMEA Segment Stats 2017 to 2018. This is part of our Data and Statistics products selection, and you will need a Paid account to download the actual report with accurate data and sources. Downloaded report will contain the editable graph with accurate data, an excel table with the actual data, the exact source of the data and the release date. This slide provides the EMEA Europe, Middle East and Africa segment stats revenues, shipment, sales volume, market share, adjusted EBIT etc. of Fiat Chrysler Automobiles, for the year 2017 to 2018. Download it immediately and use it for your business.
-
 Fiat chrysler automobiles market share in asia pacific 2014-2018
This is a professionally designed visual chart for Fiat Chrysler Automobiles Market Share In Asia Pacific 2014 to 2018. This is part of our Data and Statistics products selection, and you will need a Paid account to download the actual report with accurate data and sources. Downloaded report will contain the editable graph with accurate data, an excel table with the actual data, the exact source of the data and the release date. The slide shows Fiat Chrysler Automobiles Market Share in top 5 major markets in Asia Pacific China, Japan, India, Australia, and South Korea for the Year 2014 to 2018. Download it immediately and use it for your business.
-
 Fiat chrysler automobiles vehicle sales in asia pacific 2014-2018
This is a professionally designed visual chart for Fiat Chrysler Automobiles Vehicle Sales In Asia Pacific 2014 to 2018. This is part of our Data and Statistics products selection, and you will need a Paid account to download the actual report with accurate data and sources. Downloaded report will contain the editable graph with accurate data, an excel table with the actual data, the exact source of the data and the release date. The slide shows Fiat Chrysler Automobiles Vehicle Sales in top 5 major markets in Asia Pacific China, Japan, India, Australia, and South Korea for the Year 2014 to 2018. Download it immediately and use it for your business.
-
 Ford motor company market share of asia pacific 2014-2018
This is a professionally designed visual chart for Ford Motor Company Market Share Of Asia Pacific 2014 to 2018. This is part of our Data and Statistics products selection, and you will need a Paid account to download the actual report with accurate data and sources. Downloaded report will contain the editable graph with accurate data, an excel table with the actual data, the exact source of the data and the release date. This slide shows Market share of Asia Pacific Including China, India and Australia of Ford Motor Company from 2014 to 2018. Download it immediately and use it for your business.
-
 Ford motor company market share of europe 2014-2018
This is a professionally designed visual chart for Ford Motor Company Market Share Of Europe 2014 to 2018. This is part of our Data and Statistics products selection, and you will need a Paid account to download the actual report with accurate data and sources. Downloaded report will contain the editable graph with accurate data, an excel table with the actual data, the exact source of the data and the release date. This slide shows Market share of Europe Including United Kingdom, Germany and Russia of Ford Motor Company from 2014 to 2018. Download it immediately and use it for your business.
-
 Ford motor company market share of north america 2014-2018
This is a professionally designed visual chart for Ford Motor Company Market Share Of North America 2014 to 2018. This is part of our Data and Statistics products selection, and you will need a Paid account to download the actual report with accurate data and sources. Downloaded report will contain the editable graph with accurate data, an excel table with the actual data, the exact source of the data and the release date. This slide shows Market share of North America including U.S and Canada of Ford Motor Company from 2014 to 2018. Download it immediately and use it for your business.
-
 Ford motor company market share of south america 2014-2018
This is a professionally designed visual chart for Ford Motor Company Market Share Of South America 2014 to 2018. This is part of our Data and Statistics products selection, and you will need a Paid account to download the actual report with accurate data and sources. Downloaded report will contain the editable graph with accurate data, an excel table with the actual data, the exact source of the data and the release date. This slide shows Market share of South America Including Brazil and Argentina of Ford Motor Company from 2014 to 2018. Download it immediately and use it for your business.
-
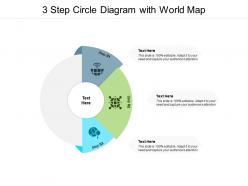 3 step circle diagram with world map
Presenting this set of slides with name 3 Step Circle Diagram With World Map. This is a three stage process. The stages in this process are 3 Step Circle Diagram, Process, Planning. This is a completely editable PowerPoint presentation and is available for immediate download. Download now and impress your audience.
-
 Volkswagen ag local production of vehicles in china 2014-18
This is a professionally designed visual chart for Volkswagen Ag Local Production Of Vehicles In China 2014 to 18. This is part of our Data and Statistics products selection, and you will need a Paid account to download the actual report with accurate data and sources. Downloaded report will contain the editable graph with accurate data, an excel table with the actual data, the exact source of the data and the release date. This slide provides a stack chart of Local Production of Vehicles consisting of Volkswagen Passenger Cars, Audi and Skoda of Volkswagen Group China of the company Volkswagen AG from the years 2014 to 18. Download it immediately and use it for your business.
-
 Volkswagen ag passenger car deliveries in china 2014-18
This is a professionally designed visual chart for Volkswagen Ag Passenger Car Deliveries In China 2014 to 18. This is part of our Data and Statistics products selection, and you will need a Paid account to download the actual report with accurate data and sources. Downloaded report will contain the editable graph with accurate data, an excel table with the actual data, the exact source of the data and the release date. This slide provides the graph of Passenger Car Deliveries in China of the company Volkswagen AG from the years 2014 to 18. Download it immediately and use it for your business.
-
 Volkswagen ag volkswagen group china 2014-18
This is a professionally designed visual chart for Volkswagen Ag Volkswagen Group China 2014 to 18. This is part of our Data and Statistics products selection, and you will need a Paid account to download the actual report with accurate data and sources. Downloaded report will contain the editable graph with accurate data, an excel table with the actual data, the exact source of the data and the release date. This slide provides the details of Volkswagen Group China along with financials consisting of Vehicle Sales and Production, Deliveries of the company Volkswagen AG from the years 2014 to 18. Download it immediately and use it for your business.
-
 Intel corporation china revenue 2014-2018
This is a professionally designed visual chart for Intel Corporation China Revenue 2014 to 2018. This is part of our Data and Statistics products selection, and you will need a Paid account to download the actual report with accurate data and sources. Downloaded report will contain the editable graph with accurate data, an excel table with the actual data, the exact source of the data and the release date. This slide provides a graph of Revenue in JPY MM of Intel Corporation from China including Hong Kong region for the years 2014 to 2018. Download it immediately and use it for your business.
-
 Diageo revenue from europe and turkey segment 2014-18
This is a professionally designed visual chart for Diageo Revenue From Europe And Turkey Segment 2014 to 18. This is part of our Data and Statistics products selection, and you will need a Paid account to download the actual report with accurate data and sources. Downloaded report will contain the editable graph with accurate data, an excel table with the actual data, the exact source of the data and the release date. This slide provides you the Diageos sales by Europe and Turkey segment from 2014 to 2018. Download it immediately and use it for your business.
-
 Suntory beverage and food limited europe financials 2014-18
This is a professionally designed visual chart for Suntory Beverage And Food Limited Europe Financials 2014 to 18. This is part of our Data and Statistics products selection, and you will need a Paid account to download the actual report with accurate data and sources. Downloaded report will contain the editable graph with accurate data, an excel table with the actual data, the exact source of the data and the release date. This slide provides the graph of Business Unit Europes Financials Revenue and EBIT in JPY billions of the company Suntory Beverage and Food Limited from the years 2014 to 18. Download it immediately and use it for your business.
-
 Suntory beverage and food limited business unit europe 2018
The information presented in this slide has been researched by our team of professional business analysts. This is part of our Company Profiles products selection, and you will need a Paid account to download the actual report with accurate data and sources. Downloaded report will be in Powerpoint and will contain the actual editable slides with the actual data and sources for each data. This slide gives the details of the Business Unit Europe along with its Key Brands of the company Suntory Beverage and Food Limited for the year 2018. Download it immediately and use it for your business.
-
 Suntory beverage and food limited europe 2019 strategies for major countries
The information presented in this slide has been researched by our team of professional business analysts. This is part of our Company Profiles products selection, and you will need a Paid account to download the actual report with accurate data and sources. Downloaded report will be in Powerpoint and will contain the actual editable slides with the actual data and sources for each data. This slide provides the Strategies as of 2019 of major countries of Europe of the company Suntory Beverage and Food Limited. Download it immediately and use it for your business.
-
 General motors company market share of asia pacific middle east and africa by segment 2014-2018
This is a professionally designed visual chart for General Motors Company Market Share Of Asia Pacific Middle East And Africa By Segment 2014 to 2018. This is part of our Data and Statistics products selection, and you will need a Paid account to download the actual report with accurate data and sources. Downloaded report will contain the editable graph with accurate data, an excel table with the actual data, the exact source of the data and the release date. This slide describes the Market Share of Asia Pacific, Middle East and Africa by Segment of General Motors from 2014 to 2018. Download it immediately and use it for your business.
-
 General motors company market share of europe 2014-2018
This is a professionally designed visual chart for General Motors Company Market Share Of Europe 2014 to 2018. This is part of our Data and Statistics products selection, and you will need a Paid account to download the actual report with accurate data and sources. Downloaded report will contain the editable graph with accurate data, an excel table with the actual data, the exact source of the data and the release date. This slide describes the Market Share of Europe of General Motors from 2014 to 2017. Download it immediately and use it for your business.
-
 General motors company market share of north america by segment 2014-2018
This is a professionally designed visual chart for General Motors Company Market Share Of North America By Segment 2014 to 2018. This is part of our Data and Statistics products selection, and you will need a Paid account to download the actual report with accurate data and sources. Downloaded report will contain the editable graph with accurate data, an excel table with the actual data, the exact source of the data and the release date. This slide describes the Market Share of North America by Segment of General Motors from 2014 to 2018. Download it immediately and use it for your business.
-
 General motors company market share of south america by segment 2014-2018
This is a professionally designed visual chart for General Motors Company Market Share Of South America By Segment 2014 to 2018. This is part of our Data and Statistics products selection, and you will need a Paid account to download the actual report with accurate data and sources. Downloaded report will contain the editable graph with accurate data, an excel table with the actual data, the exact source of the data and the release date. This slide describes the Market Share of South America by Segment of General Motors from 2014 to 2018. Download it immediately and use it for your business.
-
 General motors company retail sales volume of total europe 2014-2018
This is a professionally designed visual chart for General Motors Company Retail Sales Volume Of Total Europe 2014 to 2018. This is part of our Data and Statistics products selection, and you will need a Paid account to download the actual report with accurate data and sources. Downloaded report will contain the editable graph with accurate data, an excel table with the actual data, the exact source of the data and the release date. This slide describes the Retail Sales Volume of Total Europe of General Motors from 2014 to 2018. Download it immediately and use it for your business.
-
 Acer inc revenue split of mainland china 2014-2018
This is a professionally designed visual chart for Acer Inc Revenue Split Of Mainland China 2014 to 2018. This is part of our Data and Statistics products selection, and you will need a Paid account to download the actual report with accurate data and sources. Downloaded report will contain the editable graph with accurate data, an excel table with the actual data, the exact source of the data and the release date. This slide provides a graph of revenue split in NT JPY MM of Mainland China of Acer Inc from the years 2014 to 2018. Download it immediately and use it for your business.
-
 A and f co number of retail stores in china 2014-2018
This is a professionally designed visual chart for A And F Co Number Of Retail Stores In China 2014 to 2018. This is part of our Data and Statistics products selection, and you will need a Paid account to download the actual report with accurate data and sources. Downloaded report will contain the editable graph with accurate data, an excel table with the actual data, the exact source of the data and the release date. The slide shows the Number of Retail Stores count in China of Abercrombie and Fitch Co. for the years 2014 to 2018. Download it immediately and use it for your business.
-
 A and f co retail stores in europe 2014-2018
This is a professionally designed visual chart for A And F Co Retail Stores In Europe 2014 to 2018. This is part of our Data and Statistics products selection, and you will need a Paid account to download the actual report with accurate data and sources. Downloaded report will contain the editable graph with accurate data, an excel table with the actual data, the exact source of the data and the release date. The slide shows the Number of Retail Stores count in Europe of Abercrombie and Fitch Co. for the years 2014 to 2018. Download it immediately and use it for your business.
-
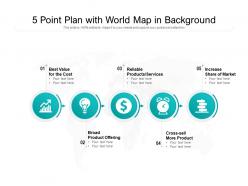 5 point plan with world map in background
Presenting this set of slides with name 5 Point Plan With World Map In Background. This is a five stage process. The stages in this process are 5 Point Plan, Strategy Icon, Concentric Circle. This is a completely editable PowerPoint presentation and is available for immediate download. Download now and impress your audience.
-
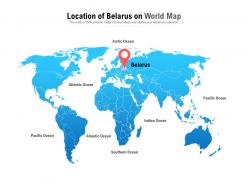 Location of belarus on world map
Presenting this set of slides with name Location Of Belarus On World Map. This is a one stage process. The stages in this process are Belarus, National Flag, World Map. This is a completely editable PowerPoint presentation and is available for immediate download. Download now and impress your audience.
-
 Aeon operating profit in china 2014-2018
This is a professionally designed visual chart for Aeon Operating Profit In China 2014 to 2018. This is part of our Data and Statistics products selection, and you will need a Paid account to download the actual report with accurate data and sources. Downloaded report will contain the editable graph with accurate data, an excel table with the actual data, the exact source of the data and the release date. The slide provides graph of Operating Profit in JPY billions in China of Aeon Co. Ltd. for the years 2014 to 2018. Download it immediately and use it for your business.
-
 Aeon operating revenue in china 2014-2018
This is a professionally designed visual chart for Aeon Operating Revenue In China 2014 to 2018. This is part of our Data and Statistics products selection, and you will need a Paid account to download the actual report with accurate data and sources. Downloaded report will contain the editable graph with accurate data, an excel table with the actual data, the exact source of the data and the release date. The slide provides graph of Operating Revenue in JPY billions in China of Aeon Co. Ltd. for the years 2014 to 2018. Download it immediately and use it for your business.
-
 Creative shown through world map on hand
Presenting this set of slides with name Creative Shown Through World Map On Hand. This is a two stage process. The stages in this process are Creative, Process, Brain. This is a completely editable PowerPoint presentation and is available for immediate download. Download now and impress your audience.
-
 Asos plc key statistics of europe 2018
The information presented in this slide has been researched by our team of professional business analysts. This is part of our Company Profiles products selection, and you will need a Paid account to download the actual report with accurate data and sources. Downloaded report will be in Powerpoint and will contain the actual editable slides with the actual data and sources for each data. This slide provides information about some key statistics of Europe Region of ASOS PLC for the year 2018. Download it immediately and use it for your business.
-
 Asos plc distribution expenses of europe 2014-2018
This is a professionally designed visual chart for ASOS PLC Distribution Expenses Of Europe 2014 to 2018. This is part of our Data and Statistics products selection, and you will need a Paid account to download the actual report with accurate data and sources. Downloaded report will contain the editable graph with accurate data, an excel table with the actual data, the exact source of the data and the release date. This slide provides a graph of Distribution Expenses of Europe in JPY MM of ASOS PLC for the years 2014 to 2018. Download it immediately and use it for your business.
-
 Asos plc europe region segment revenue split 2014-2018
This is a professionally designed visual chart for ASOS PLC Europe Region Segment Revenue Split 2014 to 2018. This is part of our Data and Statistics products selection, and you will need a Paid account to download the actual report with accurate data and sources. Downloaded report will contain the editable graph with accurate data, an excel table with the actual data, the exact source of the data and the release date. This slide provides a graph of revenue split of Europe region in JPY MM of ASOS PLC for the years 2014 to 2018. Download it immediately and use it for your business.
-
 Asos plc gross profit of europe 2014-2018
This is a professionally designed visual chart for ASOS PLC Gross Profit Of Europe 2014 to 2018. This is part of our Data and Statistics products selection, and you will need a Paid account to download the actual report with accurate data and sources. Downloaded report will contain the editable graph with accurate data, an excel table with the actual data, the exact source of the data and the release date. This slide provides a graph of Gross profit and Margin of Europe in JPY MM of ASOS PLC for the years 2014 to 2018. Download it immediately and use it for your business.
-
 Asos plc retail sales of europe 2014-2018
This is a professionally designed visual chart for ASOS PLC Retail Sales Of Europe 2014 to 2018. This is part of our Data and Statistics products selection, and you will need a Paid account to download the actual report with accurate data and sources. Downloaded report will contain the editable graph with accurate data, an excel table with the actual data, the exact source of the data and the release date. This slide provides a graph of Retail Sales of Europe in JPY MM of ASOS PLC for the years 2014 to 2018. Download it immediately and use it for your business.
-
 Axa business segment europe 2018
The information presented in this slide has been researched by our team of professional business analysts. This is part of our Company Profiles products selection, and you will need a Paid account to download the actual report with accurate data and sources. Downloaded report will be in Powerpoint and will contain the actual editable slides with the actual data and sources for each data. This slide provides the details of Business Segment Europe consisting of Products and Services, New product initiatives and Distribution channels of the company AXA SA for the year 2018. Download it immediately and use it for your business.
-
 Axa europe combined ratios 2016-18
This is a professionally designed visual chart for AXA Europe Combined Ratios 2016 to 18. This is part of our Data and Statistics products selection, and you will need a Paid account to download the actual report with accurate data and sources. Downloaded report will contain the editable graph with accurate data, an excel table with the actual data, the exact source of the data and the release date. This slide provides a graph of Combined Ratios in percent comprising of Property and Casualty, Health and Protection of Business Segment Europe of the company AXA SA from the years 2016 to 18. Download it immediately and use it for your business.
-
 Axa europe gross revenue by product categories 2016-18
This is a professionally designed visual chart for AXA Europe Gross Revenue By Product Categories 2016 to 18. This is part of our Data and Statistics products selection, and you will need a Paid account to download the actual report with accurate data and sources. Downloaded report will contain the editable graph with accurate data, an excel table with the actual data, the exact source of the data and the release date. This slide provides a stack chart of Gross Revenue JPY millions of Business Segment Europe by Product Categories Life and Savings, Property and Casualty, Health and Other including Asset Management, Banking of the company AXA SA from the years 2016 to 18. Download it immediately and use it for your business.
-
 Axa europe gross revenue by regions 2016-18
This is a professionally designed visual chart for AXA Europe Gross Revenue By Regions 2016 to 18. This is part of our Data and Statistics products selection, and you will need a Paid account to download the actual report with accurate data and sources. Downloaded report will contain the editable graph with accurate data, an excel table with the actual data, the exact source of the data and the release date. This slide provides a stack chart of Gross Revenue JPY millions of Business Segment Europe by Regions Switzerland, Germany, Belgium, United Kingdom and Ireland, Spain and Italy of the company AXA SA from the years 2016 to 18. Download it immediately and use it for your business.
-
 Axa europe gross written premiums 2016-18
This is a professionally designed visual chart for AXA Europe Gross Written Premiums 2016 to 18. This is part of our Data and Statistics products selection, and you will need a Paid account to download the actual report with accurate data and sources. Downloaded report will contain the editable graph with accurate data, an excel table with the actual data, the exact source of the data and the release date. This slide provides a graph of Gross Written Premiums JPY millions of Business Segment Europe of the company AXA SA from the years 2016 to 18. Download it immediately and use it for your business.
-
 Sales roadmap of automobile company in europe
Presenting this set of slides with name Sales Roadmap Of Automobile Company In Europe. This is a six stage process. The stages in this process are Sales Roadmap Of Automobile Company In Europe, 2014 To 2019. This is a completely editable PowerPoint presentation and is available for immediate download. Download now and impress your audience.
-
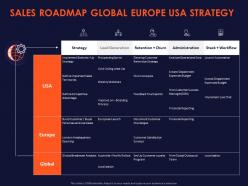 Sales roadmap global europe usa strategy ppt powerpoint presentation examples
Presenting this set of slides with name Sales Roadmap Global Europe Usa Strategy Ppt Powerpoint Presentation Examples. The topics discussed in these slides are Strategy, Lead Generation, Retention Churn, Administration, Stack Workflow. This is a completely editable PowerPoint presentation and is available for immediate download. Download now and impress your audience.
-
 Economic impact of covid 19 on china tourism ppt powerpoint presentation inspiration introduction
This slide provides details about the economic impact of COVID-19 outbreak on China tourism and is analyzed for best, moderate and worst-case scenarios. Presenting this set of slides with name Economic Impact Of COVID On China Tourism Ppt Powerpoint Presentation Inspiration Introduction. The topics discussed in these slides are Best Case, Moderate Case, Worst Case, Hypothetical Worst Case. This is a completely editable PowerPoint presentation and is available for immediate download. Download now and impress your audience.
No Reviews


