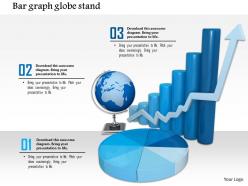
0814 bar graph with growth arrow and globe pie chart for business result analysis image graphics for powerpoint
Examining growth and success trends gives you a better chance to tackle revenue and cost related issues in business with our 0814 bar graph with growth arrow and globe pie chart for business result analysis image graphics for PowerPoint icon. This PPT slide with growth arrow diagram is graphical representations of data arranged in a time sequence and it shows a trend line that displays the general pattern of change in business. By using this presentation template you can observe net profit trends over a given period of time which allows you to identify encouraging and unfavorable trend changes and maintain consistency and accuracy of assessment. The profit statistics used in this PowerPoint template must have similar time period, such as months, quarters and years to years for analysis. With the help of this PPT theme you can consider an increasing trend to indicate rising profits, improved operation efficiency and to review how profit trends will stimulate growth. Add some fizz with our 0814 Bar Graph With Growth Arrow And Globe Pie Chart For Business Result Analysis Image Graphics For Powerpoint. Then Just sit back, relax, have a coke.
You must be logged in to download this presentation.
 Impress your
 audience
Editable
of Time
PowerPoint presentation slides
Fully attuned with Google slides. Easy to add company logo, trademark or name; accommodate words to support the key points. Images do no blur out even when they are projected on wide screen. PPT template can be utilized by sales and marketing teams and business managers. Instantly downloadable slide and supports formats like JPEG and PDF. Adjust colors, text and fonts as per your business requirements.
People who downloaded this PowerPoint presentation also viewed the following :
0814 bar graph with growth arrow and globe pie chart for business result analysis image graphics for powerpoint with all 3 slides:
Establish desired goals with our 0814 Bar Graph With Growth Arrow And Globe Pie Chart For Business Result Analysis Image Graphics For Powerpoint. They help you go hammer and tongs for it.
-
Easily Editable.
-
Professional and unique presentations.


