Rapport trimestriel d'une page, présentation infographique, ppt, pdf
Ce document intitulé "Présentation du rapport trimestriel de marketing sur une page" est un modèle au format A4 conçu sous Powerpoint et entièrement modifiable. Il présente les détails dans un format clair, concis et attrayant visuellement. Avec ce document, vous pourrez fournir une vue d'ensemble complète à votre audience avec un minimum d'efforts. Ce document vous fera gagner un temps précieux et vous aidera à communiquer votre message à vos spectateurs.
You must be logged in to download this presentation.
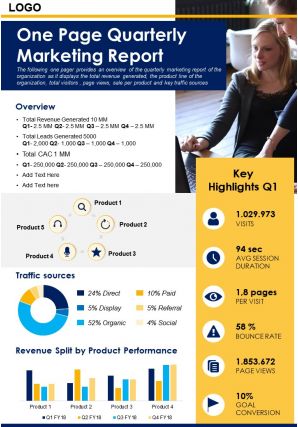
Nous présentons ici un modèle de présentation PowerPoint d'un rapport trimestriel de marketing sur une page. Évaluez les performances de vos équipes trimestriellement en utilisant cette diapositive de mesure de la performance trimestrielle. Les propriétaires d'entreprise peuvent utiliser cette évaluation de la performance sur une page disponible. Notez le nom et le logo de l'entreprise, puis affichez les points clés en intégrant ce modèle de présentation sur une page. Vous pouvez également mettre en lumière les indicateurs clés de performance du compte de résultat, notamment la marge brute, la marge nette, la marge des frais généraux et la marge bénéficiaire d'exploitation. Mettez en évidence les revenus et les dépenses à l'aide des graphiques circulaires représentés sur la page, ce qui facilitera la compréhension des données par votre public. Le rapport trimestriel sur une page vous aidera à analyser les raisons pour lesquelles les performances étaient meilleures ou plus faibles que le trimestre précédent. Cette revue en temps opportun peut vous aider à élaborer des stratégies et des plans pour votre prochain trimestre. Le modèle est entièrement modifiable et vous permet de personnaliser tous les éléments, des couleurs aux polices, sans aucun problème. Procurez-vous maintenant ce modèle de présentation d'un rapport trimestriel de marketing sur une page.
Rapport trimestriel d'une page sur la présentation du rapport d'infographie marketing avec tous les 2 diapositives : document ppt pdf.
Utilisez notre rapport trimestriel d'une page, notre présentation de rapport d'infographie, notre PPT ou notre document PDF pour vous faire gagner un temps précieux. Ils sont prêts à s'intégrer dans n'importe quelle structure de présentation.
FAQ’s for Reports
- What kinds of reports do you offer?
- Can I change the default layout of these reports?
- Are these reports shareable with my executives?
- Can these reports accommodate large amounts of data?
- I have a few sets of data that are to be converted into reports? Can you create customized reports from that data?
- I need a hard copy of my report. How do I get one?
- How do I save my business report?
- In which kind of format can I save my reports?
What kinds of reports do you offer?
We have a huge collection of reports on various topics, both personal and professional. These report templates cater to every domain making them useful for every individual or organization that downloads it. For more information feel free to browse through our collection and select the designs that excite you!
Can I change the default layout of these reports?
These reports are sample representations that are Excel linked. Useful content has been added to make them look more presentable. However, they come in a fully editable format, so, all the default charts, graphs, etc. used in these templates can be modified to fit your needs and aspirations.
Are these reports shareable with my executives?
Yes, these reports can be exported and shared with others as they come in a downloadable format. Simply download the file, save it in the format of your choice, and share it with other members. The formats we offer are PNG, PDF, JPG, PPT, and Google Slides, making the exporting process convenient for the end-user.
Can these reports accommodate large amounts of data?
Any amount of data can be imported to these reports. The design and layout will adjust itself according to the data added, making the information presented easy to retain and reinforce itself.
I have a few sets of data that are to be converted into reports? Can you create customized reports from that data?
We offer custom design services, for which you can get in touch with our SlideTeam design professionals at [email protected]. They will help in transforming your data into valuable and informative report sets. Consequently, you can also download a few sample reports from our gallery and custom-tailor them according to your needs.
I need a hard copy of my report. How do I get one?
Simply, login to your account, open the report of your choice and click on the “Download this Report” button. A zip folder will be downloaded. Extract the files and save it in the format of choice like PNG, JPG, PPT, PDF, etc. These files can be easily converted into hard copies.
How do I save my business report?
Simply click on the “Download this Report” button to save the reports for further application. Downloading the reports will give you access to save it, update it, and share it as per your liking.
In which kind of format can I save my reports?
The reports can be saved and exported in various formats like PNG, PDF, PPT, JPG, and Google Slides. You can keep these folders in your system for as long as you like and use them for multiple projects.


