Cost Optimization Strategies Powerpoint Presentation Slides
Remove waste and improve processes to minimize cost of goods sold using content-ready Cost Optimization Strategies PowerPoint Presentation Slides. Outline a strategy for cost reduction without compromising the quality of the products with ready-made cost optimization strategies PPT templates. Intensify profitability and cash flow of an organization by implementing cost reduction strategies. Get access to the cost optimization strategies PowerPoint presentation slides for executing various strategies such as target costing, activity-based costing, enterprise resource planning, value engineering, and more. This deck covers various topics such as key levers to cost management, levers to achieve successful cost optimization, levels of strategic cost optimization, prioritizing IT cost optimization, IT cost optimization: three step approach, IT cost optimization initiative benefits, cost optimization techniques, cost optimization planning, cost cutting, cost management, cost design, cost positioning, and more. These templates are completely editable. You can use cost optimization strategies PowerPoint deck as per your need. Our Cost Optimization Strategies Powerpoint Presentation Slides help advancing your brand. Folks will get conscious of it's existence and benefits.
You must be logged in to download this presentation.
 Impress your
 audience
Editable
of Time
PowerPoint presentation slides
Presenting cost optimization strategies presentation slides. This deck comprises of 36 creatively designed slides. Our PowerPoint experts have included all the necessary templates, designs, icons, graphs and other essential material. This deck is well curated after a thorough research. Slides comprises of amazing visuals and appropriate content. These PPT slides can be instantly downloaded with just a click. Compatible with all screen types and monitors. Supports Google Slides. Premium Customer Support available.
People who downloaded this PowerPoint presentation also viewed the following :
Content of this Powerpoint Presentation
Slide 1: This slide introduces to Cost Optimization Strategies. State Your Company Namea and get started.
Slide 2: This is Our Agenda slide. State your agendas here.
Slide 3: This slide presents Key Levers to Cost Management with the following sub headings- Working Capital Management: To ensure sustainability, reduce reliance & exposure to short-term funding needs, It is also subject to exposure and risks from areas including receivables, payables and inventory management, Procurement: Due to reducing cost in china, many procurement teams are facing growing pressure. This will lead to more strategic sourcing, consolidation of resources and improved contract & inventory management Operational Efficiency: Companies often reduce focus on operational & process efficiency, Top performing companies understand the fact that financial strength is built from driving out operational inefficiencies Supply Chain: Inefficiencies in channel management and distribution networks needs to be identified & understood to optimize efficiency gains along the supply chain
Slide 4: This slide shows Levers to Achieve Successful Cost Optimization with the following subheadings- Discover: How to best establish the cost optimization program? What are the goals / scope of the program Insight: What is the scale of the cost optimization opportunities? Design: What opportunities are available and which one should be developed? Implement: Which opportunities should be implemented and in what order? Maintain & Grow: What can be done better? How can the benefits and improvement to the financial performance be permanently embedded?
Slide 5: This slide presents Levels of Strategic Cost Optimization with the following points- Transform Agenda: Evaluate technology, broaden capabilities., create new sources of revenue. Invest more to optimize more Rationalize Agenda: Rationalize IT portfolio, reduce functional redundancies. Business relevance, flexibility, agility Optimize Agenda: Improve processes, “go lean,” evaluate target operations models (shared services), exercise sourcing options. Remove waste, increase efficiency Reduce Agenda: Cut IT costs, prioritize demand, span of control enhancements Reduce costs and prioritize spend
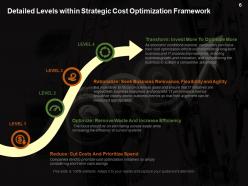
Slide 6: This slide displays Detailed Levels within Strategic Cost Optimization Framewor. The points are- Reduce: Cut Costs And Prioritize Spend Companies tend to prioritize cost optimization initiatives by simply considering short-term cash savings. Optimize: Remove Waste And Increase Efficiency The focus should be on eliminating excess waste while increasing the efficiency of current systems. Rationalize: Seek Business Relevance, Flexibility and Agility. It is imperative to focus on business goals and ensure that IT initiatives are aligned with business objectives and priorities. IT performance metrics should be closely tied to business metrics so that their alignment can be measured appropriately Transform: Invest More To Optimize More As economic conditions improve, companies can focus their cost optimization efforts on implementing long-term business and IT process improvements, enabling business growth and innovation, and repositioning the business to sustain a competitive advantage
Slide 7: This slide shows Prioritizing IT Cost Optimization with the following parameters- Reject, Accept, Evaluate.
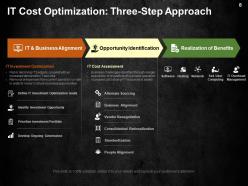
Slide 8: This slide showcases IT Cost Optimization: Three-Step Approach. The divided sub headings are- IT & Business Alignment (IT Investment Optimization) Flat or declining IT budgets, coupled with an increased demand for IT services, Removal of expenses from current spend or run rate in order to invest in future business opportunities, Define IT investment Optimization Goals, Identify Investment Opportunity, Prioritize Investment Portfolio, Develop Ongoing Governance. Opportunity Identification (IT Cost Assessment) Business challenges identified through merger, acquisition or divestiture of business operation, Increased utilization of IT resources & assets, Alternate Sourcing, Business Alignment, Vendor Renegotiation, Consolidation/ Rationalization, Standardization, People Alignment. Realization of Benefits- Software, Hosting, Network, End User Computing, IT Overhead Management.
Slide 9: This slide presents IT Cost Optimization Initiative Benefits. The sub headings are- Application Portfolio Rationalization (Improved Cost Management, Increased Efficiency, Business Transformation) Infrastructure Rationalization (Reduce total cost of ownership, Improve economies of scale by standardization of assets) Organization & Operating Model (Savings due to process standardization and reduced re-work, Improved Product Quality and Service) Operations & Process Transformation (Improve visibility of end-to-end value chain Increase demand forecast accuracy Drive significant increase in bottom line).
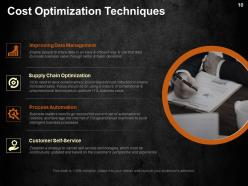
Slide 10: This slide displays Cost Optimization Techniques. The listed points are- Improving Data Management Enable people to share data in an easy & efficient way & use that data to create business value through better & faster decisions Supply Chain Optimization CIOs need to work collaboratively to look beyond cost reduction to enable increased sales. Focus should be on using a mixture of conventional & unconventional techniques to optimize IT & business costs Process Automation Business leaders need to go beyond the current use of automation to robotics, and leverage the Internet of Things and smart machines to build intelligent business processes Customer Self-Service Establish a strategy to handle self-service technologies, which must be continuously updated and based on the customer’s perspective and experience
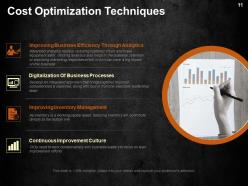
Slide 11: This slide also displays Cost Optimization Techniques. The listed points are- Improving Business Efficiency Through Analytics: (Advanced analytics helps in reducing customer churn and make equipment safer. Utilizing analytics also helps in the customer retention or improving marketing responses which in turn can have a big impact on the business). Digitalization Of Business Processes (Develop an integrated approach that brings together required competencies & expertise, along with buy-in from the executive leadership team). Improving Inventory Management (As inventory is a working capital asset, reducing inventory will contribute directly to the bottom line). Continuous Improvement Culture (CIOs need to work collaboratively with business leaders to focus on lean improvement efforts).
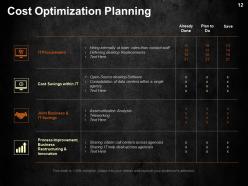
Slide 12: This slide showcases Cost Optimization Planning in terms of- Already Done, Plan to Do, Save.
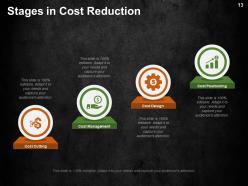
Slide 13: This slide presents Stages in Cost Reduction. The listed stages are- Cost Cutting, Cost Management, Cost Design, Cost Positioning.
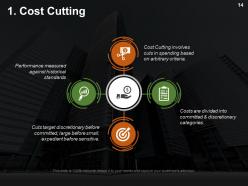
Slide 14: This slide showcases the first stage Cost Cutting. The points are- Cost Cutting involves cuts in spending based on arbitrary criteria, Costs are divided into committed & discretionary categories, Cuts target discretionary before committed; large before small; expedient before sensitive, Performance measured against historical standards.
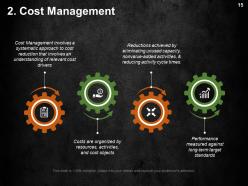
Slide 15: This slide shows Cost Management with the following points- Cost Management involves a systematic approach to cost reduction that involves an understanding of relevant cost drivers, Costs are organized by resources, activities, and cost objects, Performance measured against long-term target standards, Reductions achieved by eliminating unused capacity, nonvalue-added activities, & reducing activity cycle times.
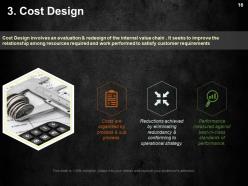
Slide 16: This slide shows Cost Design. It involves an evaluation & redesign of the internal value chain. It seeks to improve the relationship among resources required and work performed to satisfy customer requirements. The points listed thus are- Costs are organized by process & sub process. Reductions achieved by eliminating redundancy & conforming to operational strategy. Performance measured against best-in-class standards of performance.
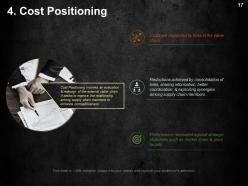
Slide 17: This slide showcases Cost Positioning with the following points- Cost Positioning involves an evaluation & redesign of the external value chain. It seeks to improve the relationship among supply chain members to enhance competitiveness. Costs are organized by links in the value chain Reductions achieved by consolidation of links, sharing information, better coordination, & exploiting synergies among supply chain members Performance measured against strategic objectives such as market share & price targets.
Slide 18: This slide presents Comparison of Stages.
Slide 19: This slide is titled Time For Tea Break! Halt here. You can change the image and text as per your requirement.
Slide 20: This is a Cost Optimization Strategy Icons Slide. Use them as per requirements.
Slide 21: This slide is titled Additional Slides to move forward. You may change the slide content as per need.
Slide 22: This is an About Us slide. State company/team specifications here.
Slide 23: This is an Our team slide with name, designation and text boxes to state information.
Slide 24: This is a Puzzle image slide. State specifications, information here.
Slide 25: This is Important Notes slide. State reminders, events etc. here.
Slide 26: This is a Target slide. State them here.
Slide 27: This is a Timeline slide to show milestones, growth, highlights etc.
Slide 28: This is a Bulb/Idea image slide. State specifications, information, innovative aspects here.
Slide 29: This is a Magnifying glass image slide. State specifications, information here.
Slide 30: This slide is titled Charts & Graphs to move forward. You may change the slide content as per need.
Slide 31: This is a Pie Chart image slide. State specifications, information here.
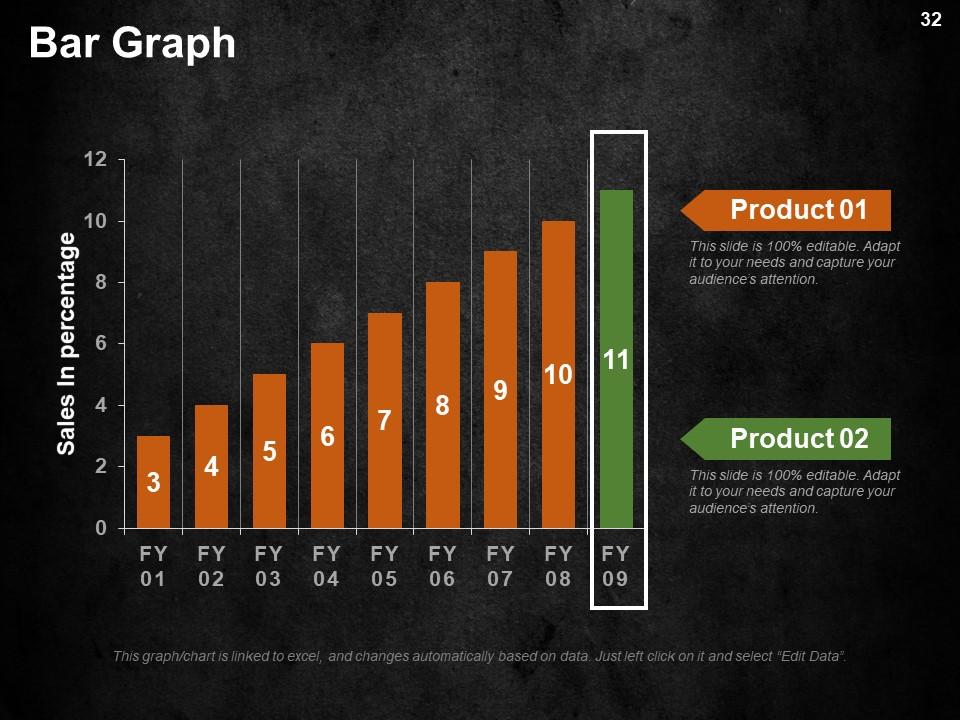
Slide 32: This is a Bar graph slide. State specifications, comparison of products/entities here.
Slide 33: This is a Scatter Chart slide to show product/entity comparison.
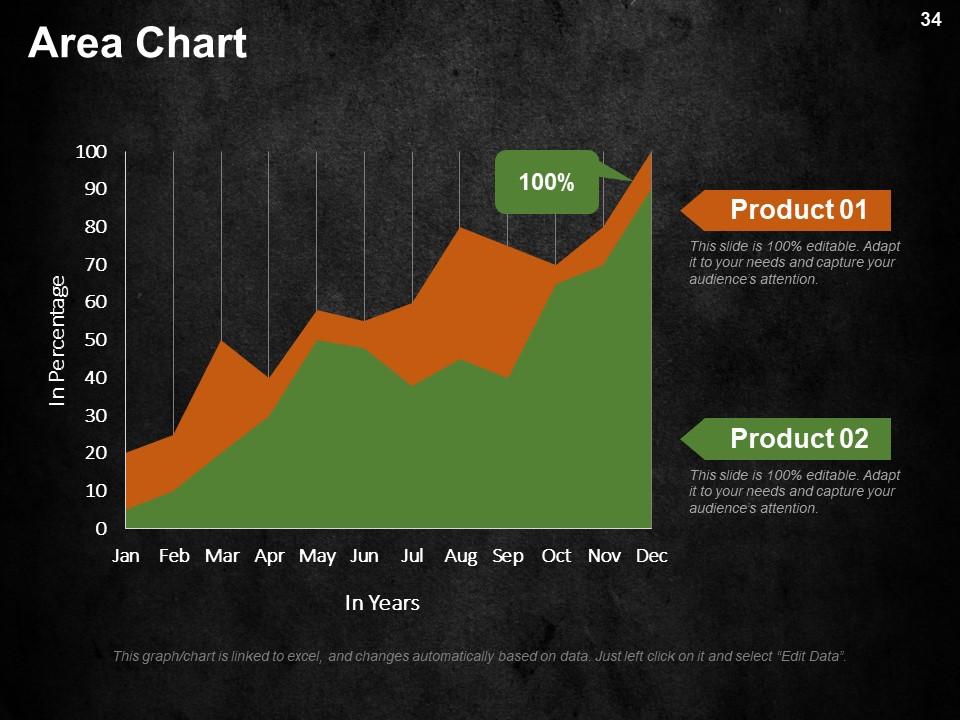
Slide 34: This is an Area Chart slide to show product/entity comparison.
Slide 35: This is a Radar Chart slide to show product/entity comparison.
Slide 36: This is a Thank You For Watching slide with Address# Street number, city, state, Email Address, Contact Numbers.
Cost Optimization Strategies Powerpoint Presentation Slides with all 36 slides:
Earth is your arena with our Cost Optimization Strategies Powerpoint Presentation Slides. They are applicable anywhere.
-
Amazing product with appealing content and design.
-
Commendable slides with attractive designs. Extremely pleased with the fact that they are easy to modify. Great work!


