Management Acquisitions Powerpoint Presentation Slides
Introducing our content ready Management Acquisitions PowerPoint Presentation Slides PPT. Take the assistance of these mergers & acquisitions PPT slides to showcase the criteria for mergers as well as acquisitions. Demonstrate the steps to acquire a company like understating business, determination of market/services, identifying acquisition targets, negotiation using the M & A strategies PowerPoint templates. Take the assistance of this business mergers PPT slideshow to reveal inorganic opportunities such as the horizontal merger, vertical merger, product extension, etc. Present the components of the merger synergy framework namely revenue, growth, commercial optimization, operational optimization and reduction in financial cost along with their opportunity areas. Showcase company valuation methodologies such as asset-based method, income-based method, market-based method, etc. to assess the value of your firm. Counter several post mergers issues including inadequate integration, data amalgamation, investment community, etc. with the help of business acquisition PPT graphics. Download the mergers and acquisitions process PowerPoint visuals to create an understanding of the merger procedure
You must be logged in to download this presentation.
 Impress your
 audience
Editable
of Time
PowerPoint presentation slides
Presenting the Management Acquisitions PowerPoint Presentation Slides. This PowerPoint deck consists of forty-nine fully editable slides. These slides also support the standard and widescreen ratios. Change the color, text, and font size of these templates. This PowerPoint slideshow is also compatible with Google Slides. Transform these slides into various images or document formats including JPEG or PDF.
People who downloaded this PowerPoint presentation also viewed the following :
Content of this Powerpoint Presentation
Slide 1: This slide introduces Management Acquisitions. State Your Company name and begin.
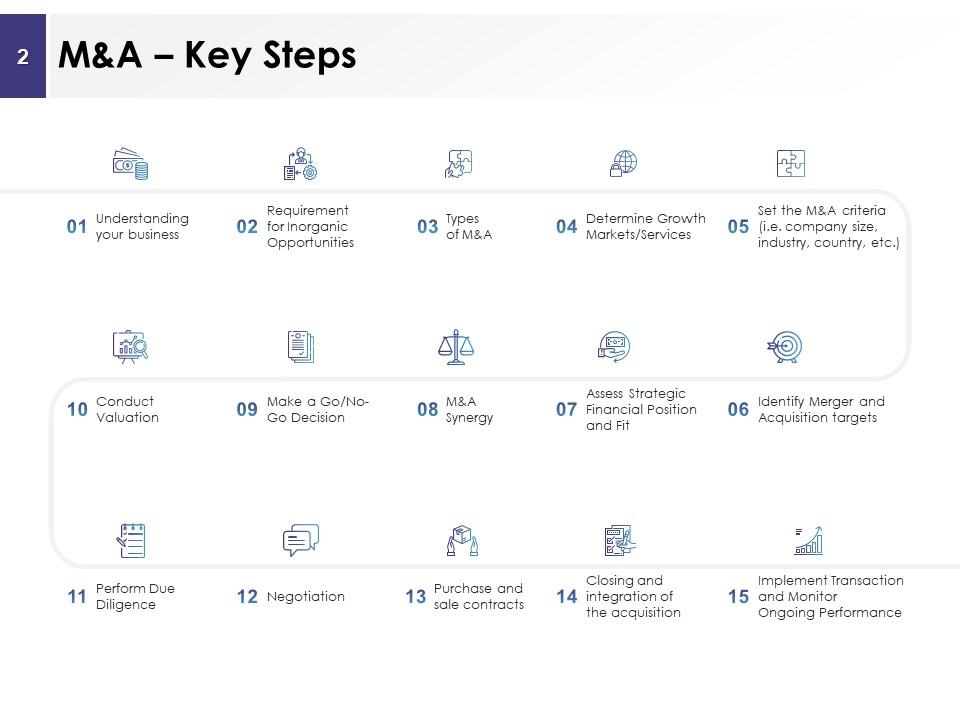
Slide 2: This slide showcases M&A – Key Steps.
Slide 3: This slide depicts Company Overview.
Slide 4: This slide showcases Current Key Offerings.
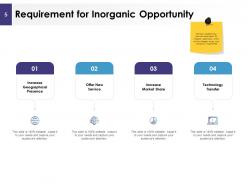
Slide 5: This slide depicts Requirement for Inorganic Opportunity such as- Increase geographical presence, Offer new service, Increase market Share, Technology Transfer.
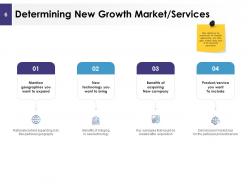
Slide 6: This slide showcases Determining New Growth Market/Services. After identifying the requirement for inorganic opportunities, this slide goes in detail about each of the discussed parameters
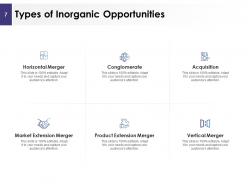
Slide 7: This slide represents Types of Inorganic Opportunities. Horizontal Merger, Conglomerate, Acquisition, Market Extension Merger, Product Extension Merger Vertical Merger.
Slide 8: This slide showcases Setting the M&A Criteria. Finalize the criteria which you would choose for the target company you want to merge/acquire.
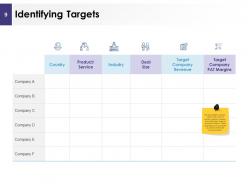
Slide 9: This slide presents Identifying Targets.
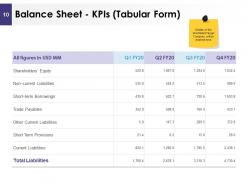
Slide 10: This slide showcases Balance Sheet - KPIs in Tabular Form. Details of the shortlisted Target Company will be entered here
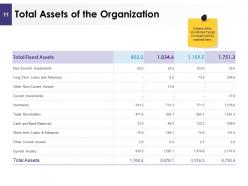
Slide 11: This slide depicts Total Assets of the Organization.
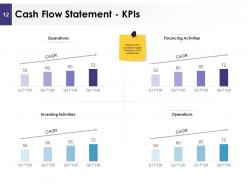
Slide 12: This slide represents Cash Flow Statement - KPIs.
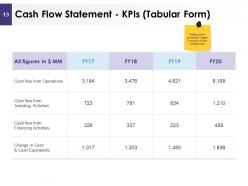
Slide 13: This slide depicts Cash Flow Statement - KPIs in Tabular Form.
Slide 14: This slide showcases Financial Projections – P&L.
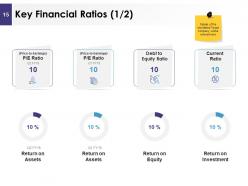
Slide 15: This slide presents Key Financial Ratios. (
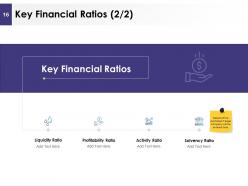
Slide 16: This slide presents Key Financial Ratios containing- Liquidity Ratio, Profitability Ratio, Activity Ratio, Solvency Ratio.
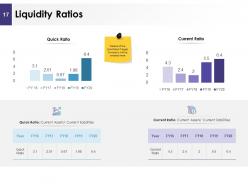
Slide 17: This slide describes Liquidity Ratios.
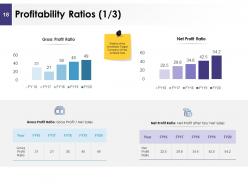
Slide 18: This slide depicts Profitability Ratios.
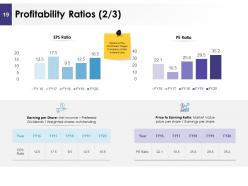
Slide 19: This slide showcases Profitability Ratios.
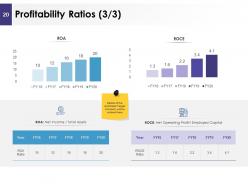
Slide 20: This slide presents Profitability Ratios.
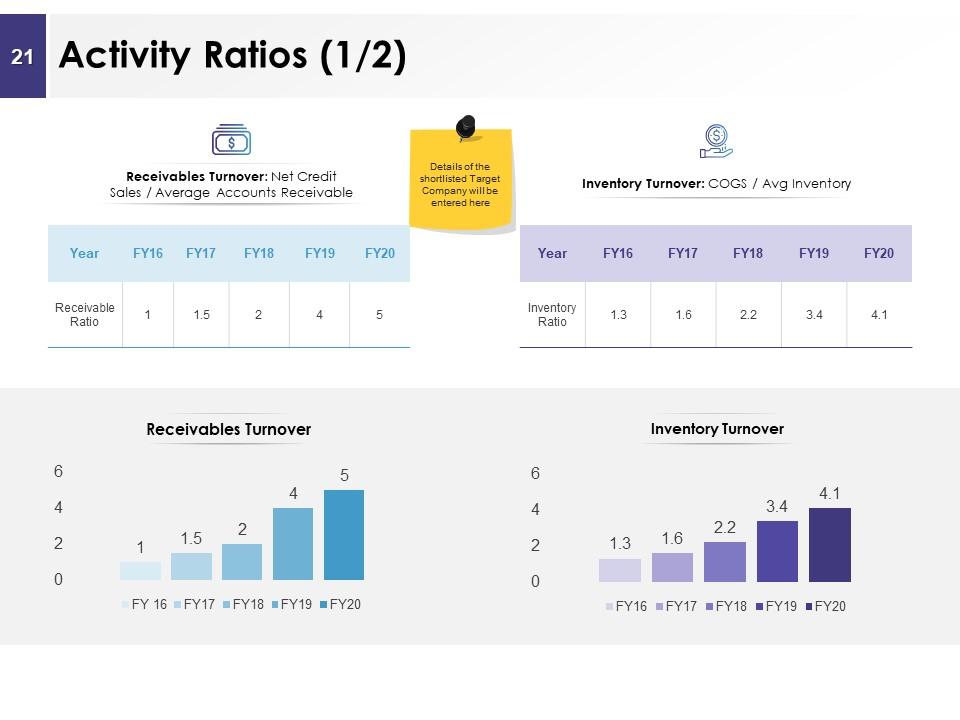
Slide 21: This slide showcases Activity Ratios.
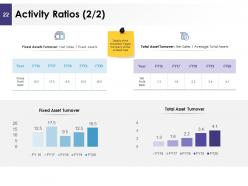
Slide 22: This slide represents Activity Ratios (2/2) Total Asset Turnover, Fixed Assets Turnover, Fixed Asset Turnover, Total Asset Turnover.
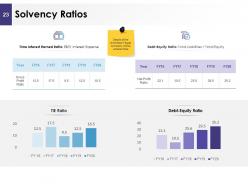
Slide 23: This slide describes Solvency Ratios.
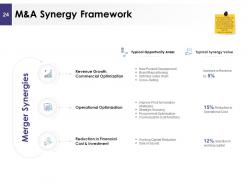
Slide 24: This slide showcases M&A Synergy Framework.
Slide 25: This Company showcases Valuation Methodologies.
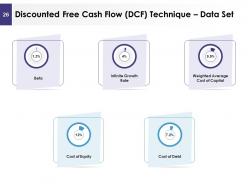
Slide 26: This slide presents Discounted Free Cash Flow Technique – Data Set containing- Cost of Equity, Cost of Debt, Infinite Growth rate, Weighted Average, Cost of Capital, Beta.
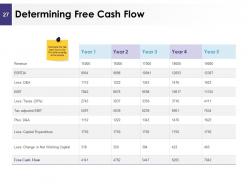
Slide 27: This slide describes about Determining Free Cash Flow. Calculate the free cash flow to the firm after entering all the details.
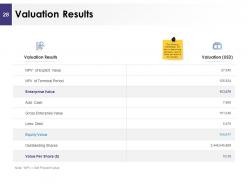
Slide 28: This slide depicts Valuation Results. The following methodology will help in determining the Equity value & Value per share of the company
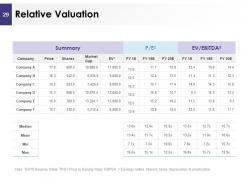
Slide 29: This slide presents Relative Valuation.
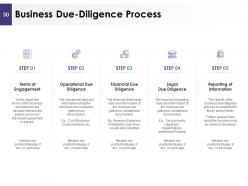
Slide 30: This slide depicts Business Due-Diligence Process.
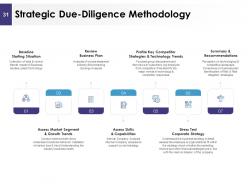
Slide 31: This slide shows Strategic Due-Diligence Methodology.
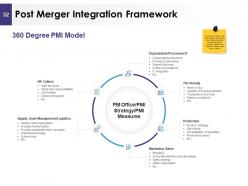
Slide 32: This slide shows Post Merger Integration Framework. Under each function of an organization, there would be an effect due to the merger/acquisition process. Mention the integration effect under each of them
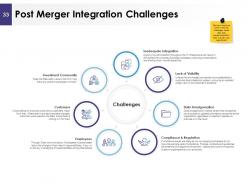
Slide 33: This slide depicts Post Merger Integration Challenges.We have listed out some of the key challenges faced after post merger/acquisition. Alter it as per your requirement.
Slide 34: This slide showcases M&A Performance Tracker.
Slide 35: This is Management Acquisitions Icons Slide.
Slide 36: This slide is titled as Additional Slides for moving forward.
Slide 37: This slide reminds about Coffee Time
Slide 38: This slide depicts Clustered Column Line chart with different products comparison.
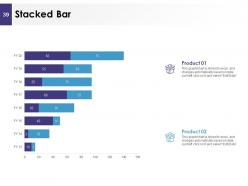
Slide 39: This slide presents Stacked Bar chart with products comparison.
Slide 40: This is Venn slide to showcase related information.
Slide 41: This is Financial slide. Showcase your finance related stuff here.
Slide 42: This is Our Goal slide. Mention your important goals.
Slide 43: This is Quotes slide to convey message, beliefs etc.
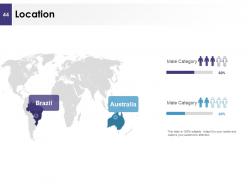
Slide 44: This is Location slide showcasing percentage of male category in different locations.
Slide 45: This is About Us slide to showcase company information.
Slide 46: This is Puzzle slide with icons and text boxes.
Slide 47: This is Comparison slide showcasing comparison between mobile users and iPad users.
Slide 48: This is 30 60 90 Days plan slide.
Slide 49: This is Contact slide with Email address, address and contact information.
Management Acquisitions Powerpoint Presentation Slides with all 49 slides:
Our Management Acquisitions Powerpoint Presentation Slides are convenient and user friendly. Just select the relevant ones and personalise them with your text.
No Reviews


