Investor update profile about business powerpoint presentation with slides
Want to present a business profile that establishes your company as a leader. To help you out here we are presenting a complete PPT model so as to keep your investors updated with latest information. With this PowerPoint show you can potentially engage with your investors, in fact by revealing your operations you can successfully gain your financiers confidence. Well keeping an investor updated in a systematic way with help of a good PPT example supports to build a sound and transparent image. Going further exclusive PowerPoint templates like Production Team, Business Model Canvas, Annual Run Rate, Revenue Model, Production Costs, Competitive Analysis etc. of this PPT sample file supports to cover all major aspects. From investor relations manager to business investors, financial investors and project managers all can take advantage of this readymade presentation deck. Get on! Roll up your sleeves to download this amazing PPT example.
You must be logged in to download this presentation.
 Impress your
 audience
Editable
of Time
PowerPoint presentation slides
Complete set of 60 slide templates for business investors and private investors. Pre deigned high resolution presentation diagrams to save time. Customize layout, font, text, color and presentation background as per your style. Free of space constraints to mention titles and sub titles. Original creative designs. Easy to insert company logo, trademark or name. Well compatible with Google slides. Downloads instantly in a snap
People who downloaded this PowerPoint presentation also viewed the following :
Content of this Powerpoint Presentation
Slide 1: This is an introductory slide for INVESTOR UPDATE Template. State Your Company Name and begin.
Slide 2: This slide showcases Company Investor Update.
Slide 3: This is an About Company slide. State business position, facts, stats, etc. here.
Slide 4: This is Our Team slide with names, designation and text boxes to fill information.
Slide 5: This is Our Team hierarchy slide with names, designation and text boxes to fill information.
Slide 6: This is Product Team slide with names, designation and text boxes to fill information.
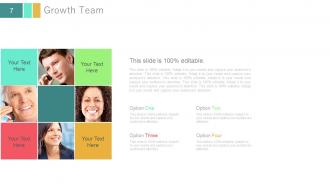
Slide 7: This is Growth Team slide with names, designation and text boxes to fill information.
Slide 8: This slide presents a Business Model Canvas.
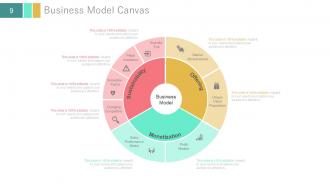
Slide 9: This slide showcases Business Model Canvas showcasing- Business Model, Graceful, Exit, Market Attractiveness, Unique Value Proposition, Profit Models, Sales Performance Model, Changing Competitive, Innovation, Factor, Pitfall, Avoidance, Sustainability, Offering, Monetization.
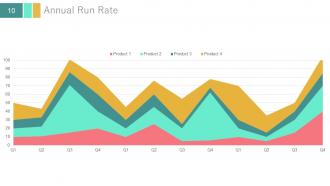
Slide 10: This slide showcases Annual Run Rate in graph form.
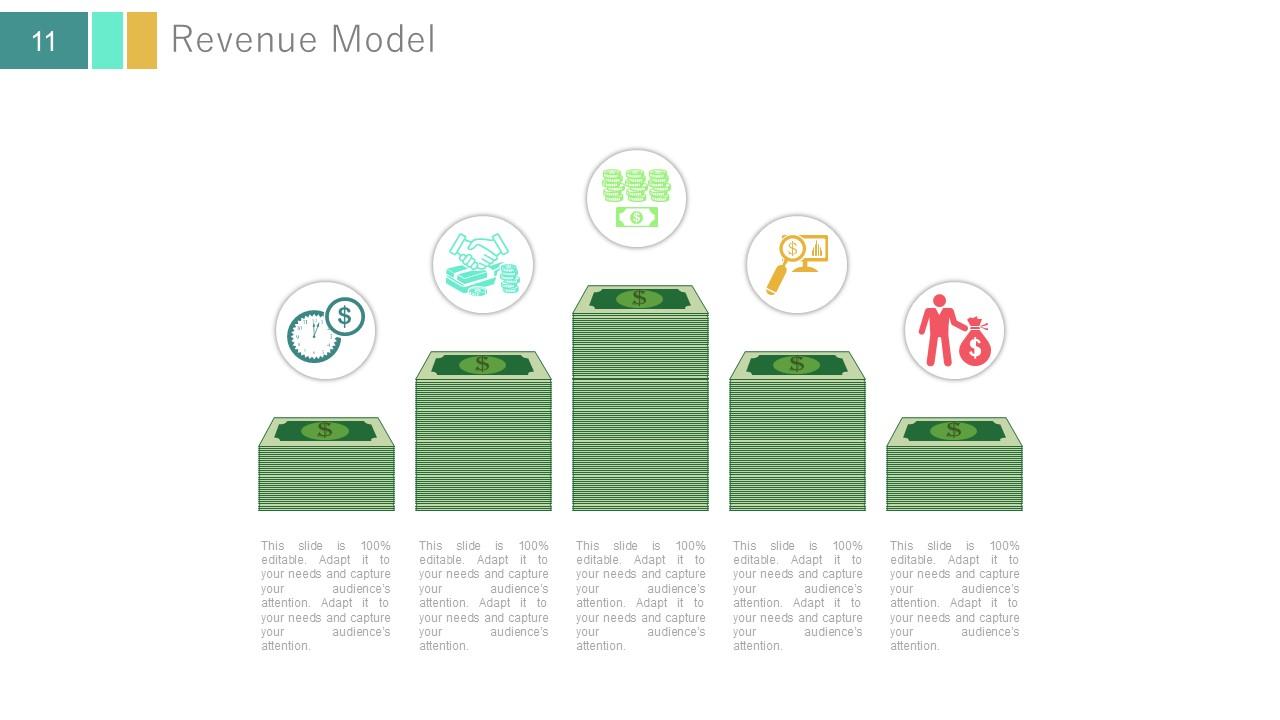
Slide 11: This is a Revenue Model slide.
Slide 12: This slide displays Monthly Run Revenue in graph form.
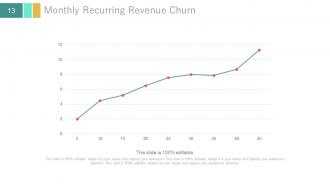
Slide 13: This slide presents Monthly Recurring Revenue Churn in graph form.
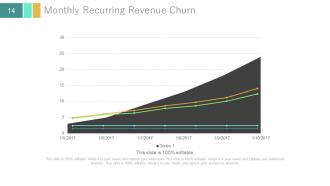
Slide 14: This slide presents Monthly Recurring Revenue Churn in graph form.
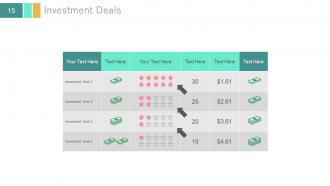
Slide 15: This slide presents Investment Deals in tabular form.
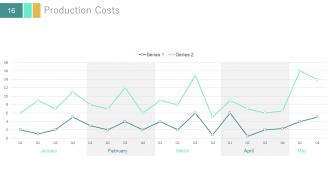
Slide 16: This slide showcases Production Costs in graphical form.
Slide 17: This slide shows Production Costs displaying- MANUFACTURING, LABOUR, FACTORY PROFIT.
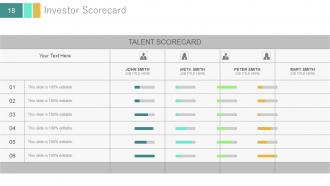
Slide 18: This slide showcases an Investor Scorecard.
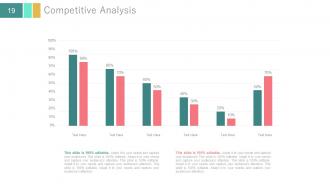
Slide 19: This slide shows Competitive Analysis in graph form.
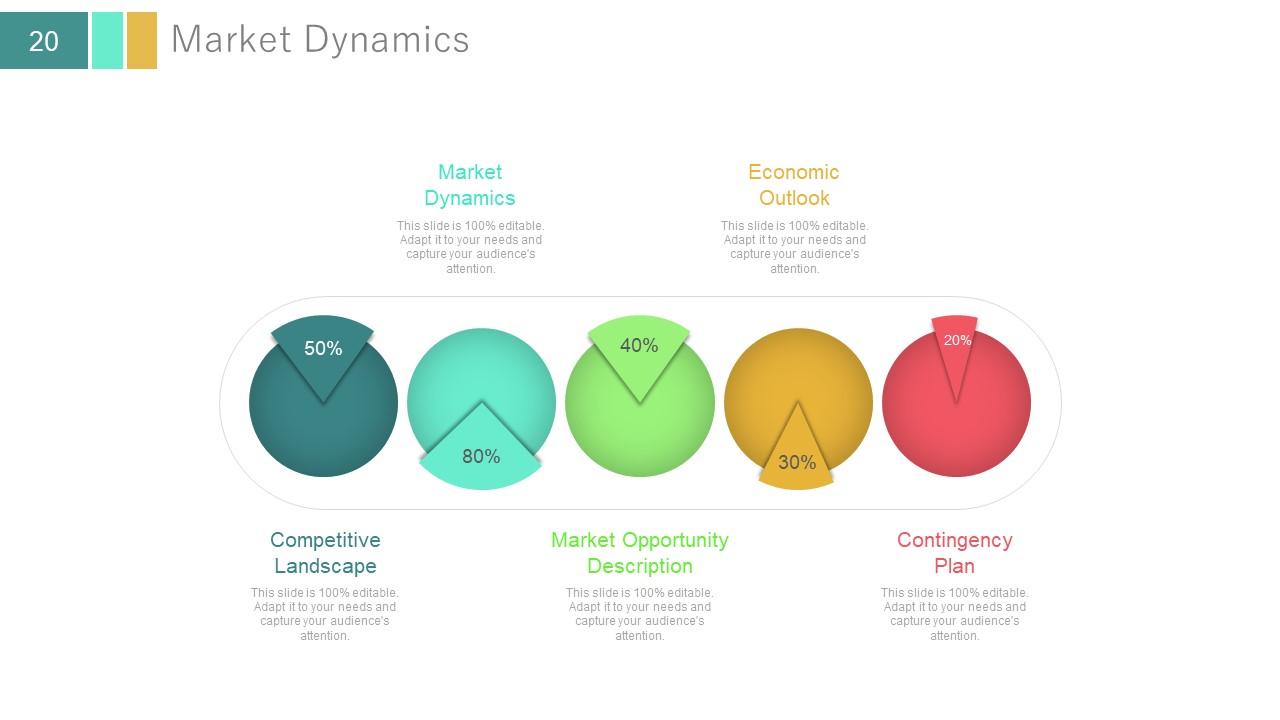
Slide 20: This slide shows Market Dynamics displaying- Market Dynamics, Economic Outlook, Competitive Landscape, Contingency Plan, Market Opportunity Description.
Slide 21: This slide presents Market Budget displaying- Marketing Objectives, Target Mark, Business Opportunities, Competition, Products & Services.
Slide 22: This slide presents Value Chain displaying- Inbound Logistics, Operations, Outbound Logistics, Marketing & Sales, Service, Infrastructure, HR Management, Research & Development, Procurement, PRIMARY FUNCTION, SUPPORTING FUNCTION, VALUE ADDED.
Slide 23: This slide shows Platform Build On Value Chain.
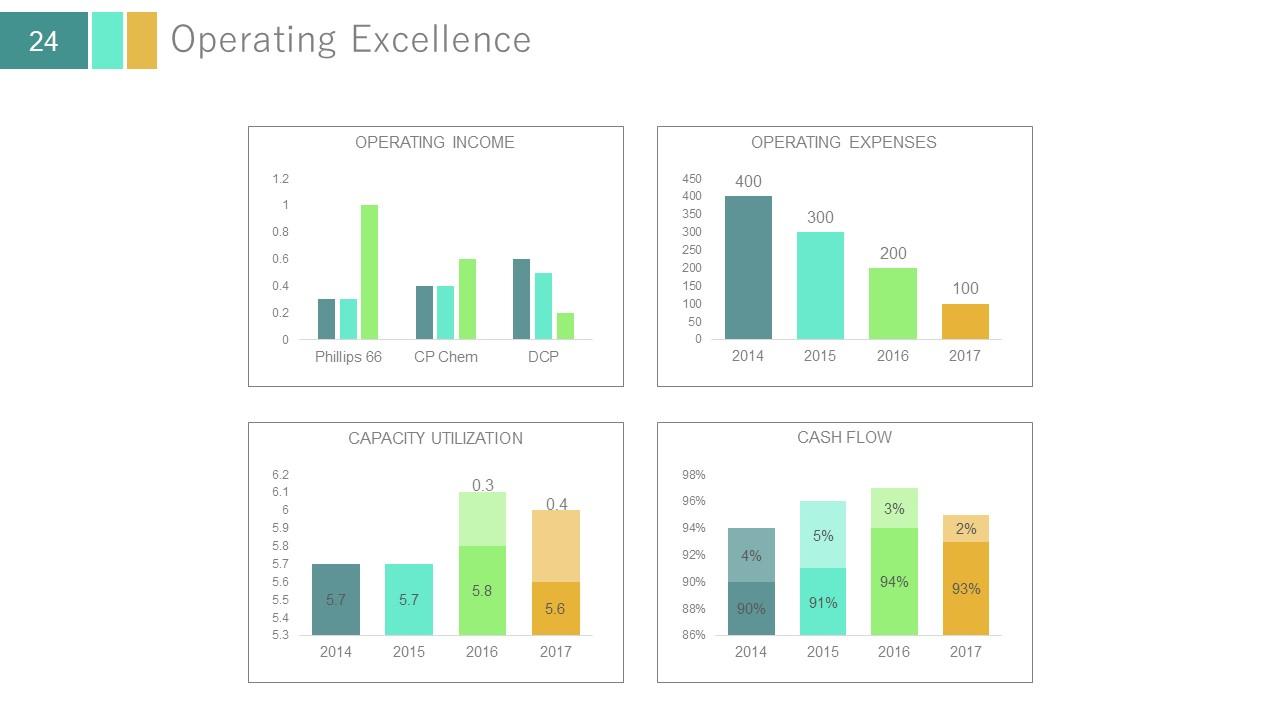
Slide 24: This slide shows Operating Excellence in graphical form showing- Operating Income Operating Expenses Capacity Utilization Cash Flow
Slide 25: This slide presents Financial Highlights in graphical form.
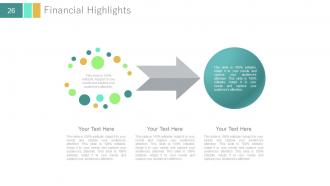
Slide 26: This slide presents Financial Highlights with creative imagery.
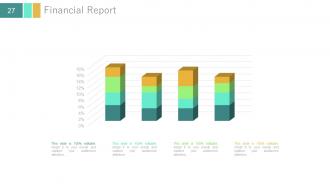
Slide 27: This is a Financial Report slide in graph form.
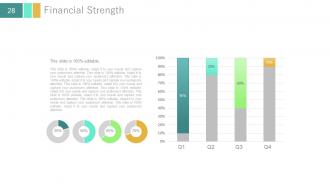
Slide 28: This slide showcases Financial Strength to be displayed.
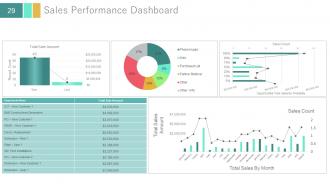
Slide 29: This slide presents a Sales Performance Dashboard.
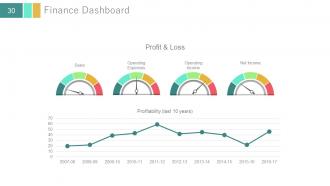
Slide 30: This is a Finance Dashboard slide showcasing- Sales, Operating Expenses, Operating Income, Net Income, Profit & Loss.
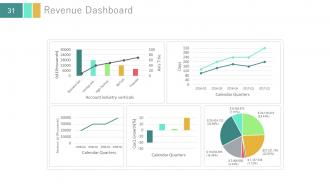
Slide 31: This slide shows a Revenue Dashboard.
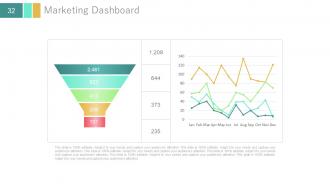
Slide 32: This slide displays a Marketing Dashboard in funnel form.
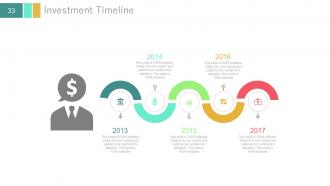
Slide 33: This slide showcases Investment Timeline. Present financial journey etc. here.
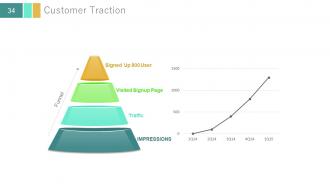
Slide 34: This slide presents Customer Traction.
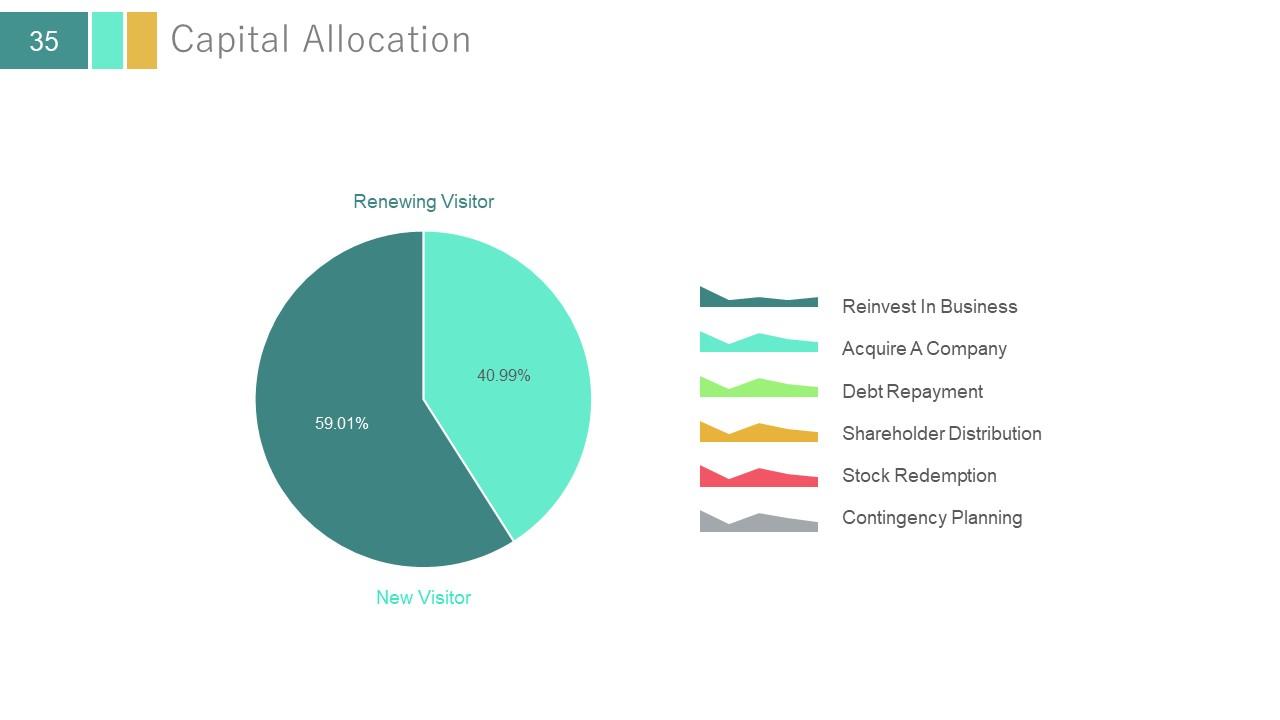
Slide 35: This slide shows Capital Allocation displaying- New Visitor, Renewing Visitor, Reinvest In Business, Acquire A Company, Debt Repayment, Shareholder Distribution, Stock Redemption, Contingency Planning.
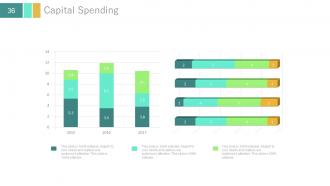
Slide 36: This slide shows Capital Spending in graph form.
Slide 37: This slide shows Project Progress And Reasons For Delay in graphs and charts form.
Slide 38: This slide showcases Distribution Growth in graph form.
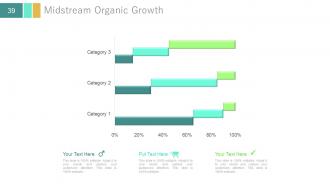
Slide 39: This slide presents Midstream Organic Growth in graph form.
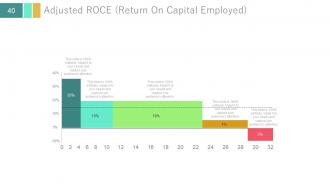
Slide 40: This slide showcases Adjusted ROCE (Return On Capital Employed).
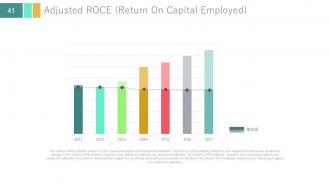
Slide 41: This slide shows Adjusted ROCE (Return On Capital Employed).
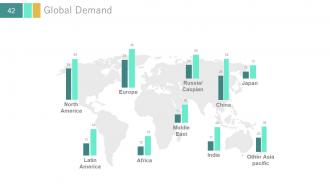
Slide 42: This slide showcases Global Demand in creative graph and world map image form.
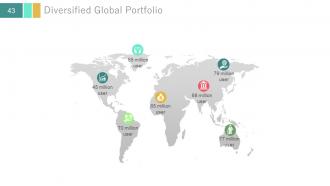
Slide 43: This slide showcases Diversified Global Portfolio with world map imagery.
Slide 44: This slide is titled Additional Slides to move forward. You can change/modify the slide content as per need.
Slide 45: This is an Agenda slide. Showcase your exclusive agendas here.
Slide 46: This slide contains Our Mission with Vision, Startegy and Goal. State them here.
Slide 47: This is a Dashboard slide to state Low, medium and High aspects, kpis, metrics etc.
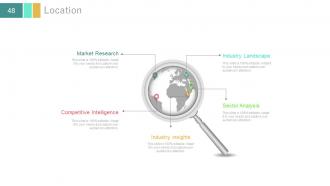
Slide 48: This is Location slide of world map image to show global growth, presence etc. with- Market Research, Industry Landscape, Sector Analysis, Competitive Intelligence, Industry insights.
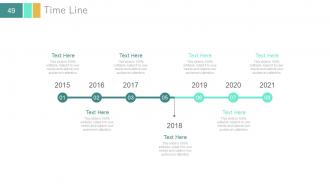
Slide 49: This slide presents a Timeline to show growth, milestones, journey, evolution etc.
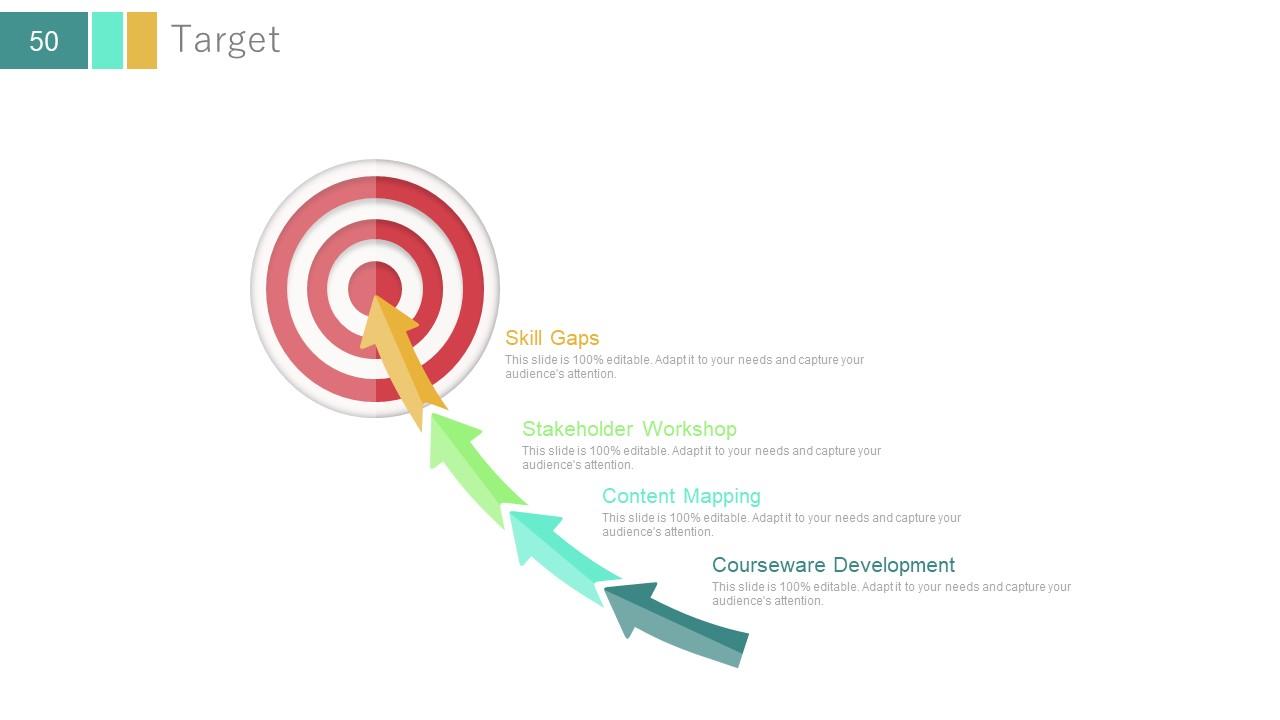
Slide 50: This slide showcases Target to display- Skill Gaps, Stakeholder Workshop, Content Mapping, Courseware Development.
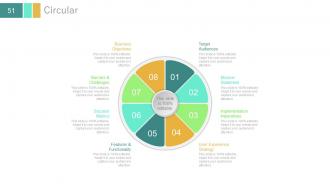
Slide 51: This is a Circular image slide. State specifications, information here such as- User Experience Strategy, Target Audiences, Mission Statement, Success Metrics, Features & Functionality, Business Objectives, Barriers & Challenges.
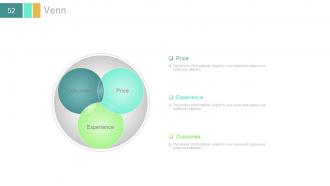
Slide 52: This is a Venn diagram slide to show information, specifications etc. such as- Price, Experience, Outcomes.
Slide 53: This is a Mind Map image slide to show segmentation, information, specifications etc. such as- Personal Motivation, Suggestion, Music And The Arts.
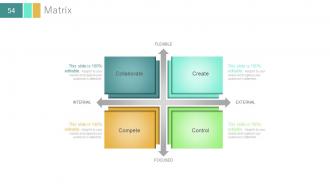
Slide 54: This is a Matrix slide showcasing- FLEXIBLE, EXTERNAL, FOCUSED, INTERNAL, Collaborate, Create, Control, Compete.
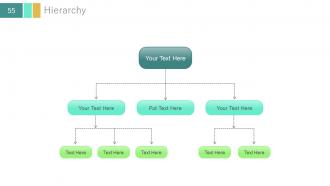
Slide 55: This is a Hierarchy Chart slide to show team information, organizational specifications etc.
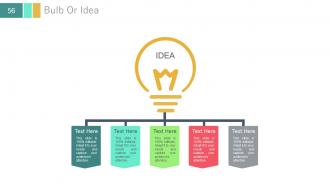
Slide 56: This is a Bulb or Idea image slide to show ideas, innovative information etc.
Slide 57: This is a Magnify Glass image slide to showcase information, specifications etc. such as- Performance Management System, Performance Plans And Goal Setting, Competency Models, Leadership Department, Performance Appraisal.
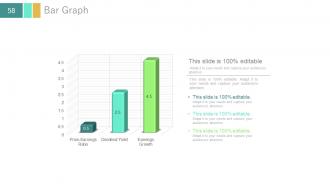
Slide 58: This is a Bar Graph slide to showcase information, specifications etc.
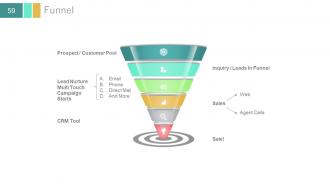
Slide 59: This is a Funnel image slide to show information, specifications etc. such as- Prospect / Customer Pool, CRM Tool, Lead Nurture Multi Touch Campaign Starts, Email, Phone, Direct Mail, Inquiry / Leads In Funnel, Sale! Sales, Web, Agent Calls.
Slide 60: This is a Thank You slide for acknowledgement.
Investor update profile about business powerpoint presentation with slides with all 60 slides:
Our Investor Update Profile About Business Powerpoint Complete Deck are an economical choice. They deliver better for every buck.
-
Great product with highly impressive and engaging designs.
-
Awesome use of colors and designs in product templates.


