Investment And Security Analysis Portfolio Management Powerpoint Presentation Slides
Presenting our investment and security analysis portfolio management PowerPoint presentation slides. These investment management PPT templates guide your financial expert to determine the cost of assets in a portfolio. Using our financial statement presentation diagrams, figure out the profit, liabilities, and asset of your company. The stages in these project portfolio management PowerPoint slides are risk tolerance analysis, asset allocation, target modelling, parento optimal portfolio, key driver analytics, resource capacity planning, scheduling, investor personality, performance attributions and key evaluation metrics. These portfolio investment presentation graphics are suitable for those who want to create a presentation on related topics such as index investing, financial planning, stock market security analysis, active management, close-end funds, strategic management, equity finance, shareholder budget analysis and stock valuation. Our ready-made asset management PPT illustrations also help to trace out the effect of various market value fluctuations. Download our investment and security analysis portfolio management PPT designs, add text and present!. Implement decisions with alacrity due to our Investment And Security Analysis Portfolio Management Powerpoint Presentation Slides. It helps you get to the business end.
You must be logged in to download this presentation.
 Impress your
 audience
Editable
of Time
PowerPoint presentation slides
These templates can be easily downloaded. This graphic consists of more than 50 slides. These designs are fully editable. Compatible presentation layout. Our visuals can be easily converted to PDF and JPG formats. High-resolution template designs. Standardized position, color, and style. Our templates are 100% risk-free. Our slides can be used by investors, portfolio manager, security analyst, marketers, sales, finance analyst and many more.The stages in this process are equity capital, equity ownership co ownership etc.
People who downloaded this PowerPoint presentation also viewed the following :
Content of this Powerpoint Presentation
Slide 1: This slide introduces Investment and Security Analysis Portfolio Management. State your company name and begin.
Slide 2: This slide shows Agenda. You can use as per your company agenda.
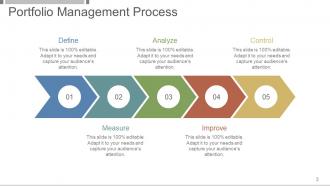
Slide 3: This slide showcases Portfolio Management Process with these following stages- Measure, Improve, Define, Analyze, Control.
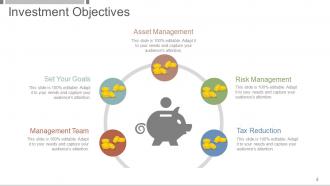
Slide 4: This slide shows Investment Objectives with these points to mention- Asset Management, Set Your Goals, Risk Management, Management Team, Tax Reduction.
Slide 5: This slide presents Investment Objectives with these main five are- Why Are You Investing, Increase Income, Reduce Tax Liability, Finance Expenses, Fight Inflation, Increase Saving.
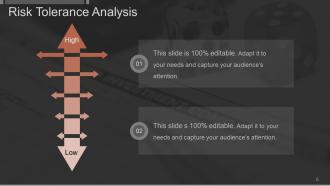
Slide 6: This slide shows Risk Tolerance Analysis with main frames are- Low, High.
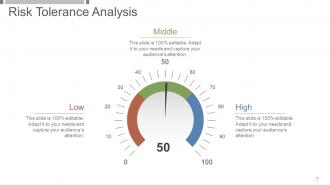
Slide 7: This slide shows Risk Tolerance Analysis three parameters to analyze- Low, High, Middle.
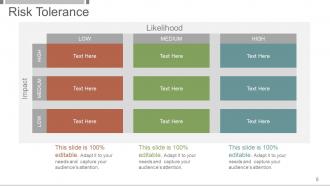
Slide 8: This slide presents Risk Tolerance with three streams-high, medium, low.
Slide 9: This slide presents Risk Reward Matrix and comparing with respect to- Investment Reward, Investment Risk.
Slide 10: This slide shows Risk Reward Matrix with these four parameters. You can demostrate your own reward points.
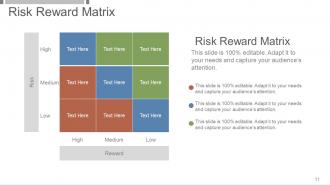
Slide 11: This slide presents Risk Reward Matrix. You can edit this by your data or information.
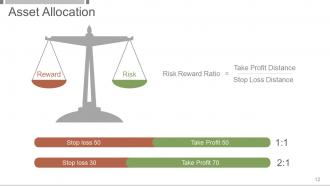
Slide 12: This slide shows Asset Allocation with these two factors- Reward, Risk.
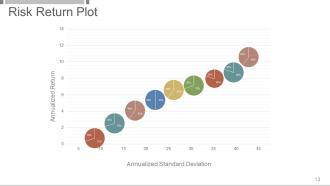
Slide 13: This slide showcases Risk Return Plot/graph showing comparison of these two- Annualized Return, Annualized Standard Deviation.
Slide 14: This slide shows what-if modelling which further having these three factors- Challenge, Consequence, Choice.
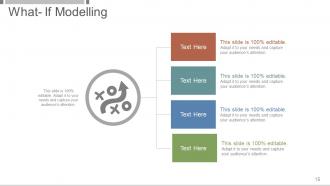
Slide 15: This slide is showing one more graphical representation of What- If Modelling. You can edit or add data as per your requirement.
Slide 16: This slide showcases What- If Modelling table. You can add your content of your business in this and make the best use of it.
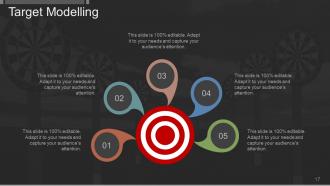
Slide 17: This slide presents Target Modelling. You can add your information as per your business needs.
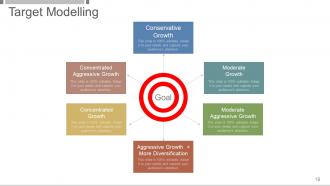
Slide 18: This slide showcases Target Modelling which further includes Goal and these are- Moderate Growth, Concentrated Aggressive Growth, Moderate Aggressive Growth, Concentrated Growth, Conservative Growth, Aggressive Growth + More Diversification.
Slide 19: This slide presents Key Driver Analytics with the four facts. You can state your company facts.
Slide 20: This slide shows Key Driver Analytics. You can add your drivers and use it for your company.
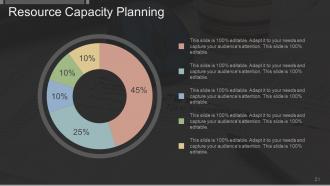
Slide 21: This slide displays Resource Capacity Planning. You can add your details and make the use of it.
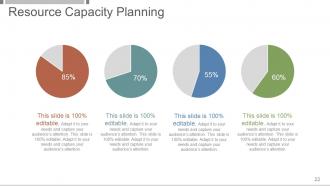
Slide 22: This slide is showing Resource Capacity Planning. This also includes pie chart form with which you can add percentages.
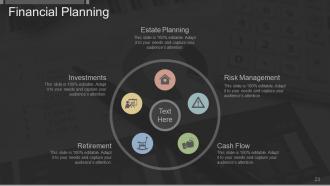
Slide 23: This slide shows Financial Planning , You can use these steps for your planning- Estate Planning, Cash Flow, Retirement, Risk Management, Investments.
Slide 24: This slide shows Scheduling and also showing month wise information you can put in it.
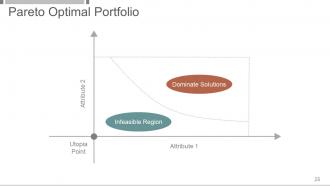
Slide 25: This slide showcases Pareto Optimal Portfolio graph with these variables- Attribute 2, Dominate Solutions, Infeasible Region, Utopia, Point, Attribute 1.
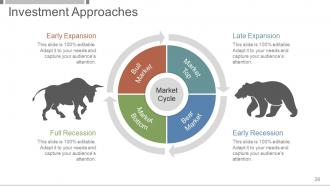
Slide 26: This slide showcases Investment Approaches showing this framework with these features- Early Expansion, Late Expansion, Full Recession, Early Recession.
Slide 27: This slide showcases Investment Approaches. You can us ethis as such or add your information.
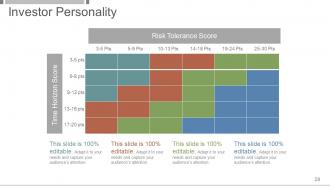
Slide 28: This slide presents Investor Personality with different variable.
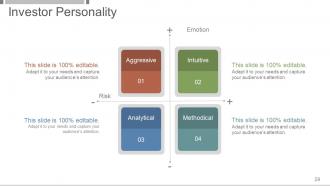
Slide 29: This slide shows Investor Personality with these criterion- Methodical, Intuitive, Analytical, Aggressive.
Slide 30: This slide presents Portfolio Return And Performance which further includes Performance Projection For This Fund.
Slide 31: This slide shows Portfolio Return And Performance. This slide further shows graphical representation and table in which you can add your data.
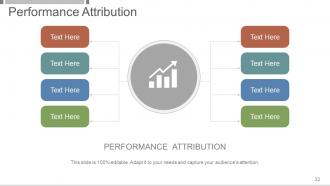
Slide 32: This slide shows Performance Attribution and further it has parameters you can add as per your need.
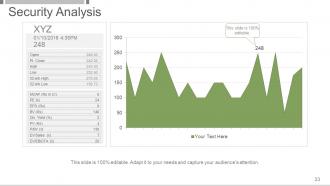
Slide 33: This slide Security Analysis with data chart and analysis graph.
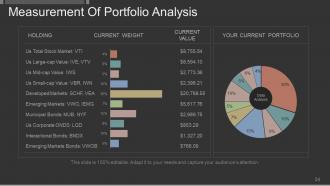
Slide 34: This slide showcases Measurement Of Portfolio Analysis showing bar chart and pie chart too.
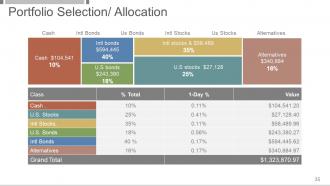
Slide 35: This is about Portfolio Selection/ Allocation with a metrics showing differnt bonds and stocks.
Slide 36: This slide showcases Portfolio Selection/ Allocation with data table and bar chart.
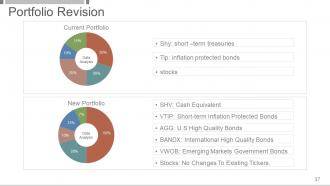
Slide 37: This slide presents Portfolio Revision and further includes current portfolio and new portfolio.
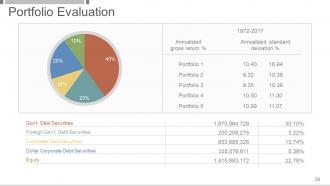
Slide 38: This slide showcases Portfolio Evaluation. You can add or edit the information.
Slide 39: This slide shows Portfolio Evaluation, and further it includes data in bar chart.
Slide 40: This slide showcases Portfolio Evaluation and also it includes bar graph chart and pie chart.
Slide 41: This slide shows Feasible Set Of Portfolio Feasible And Efficient Portfolios.
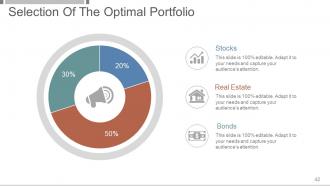
Slide 42: This slide presents Selection Of The Optimal Portfolio with these pie chart ratio- Stocks, Real Estate, Bonds.
Slide 43: This slide showcases Selection Of The Optimal Portfolio with the table.
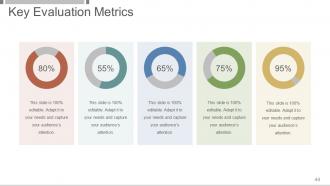
Slide 44: This slide presents Key Evaluation Metrics showing five variations of pie chart. You can put the percentage according to your need.
Slide 45: This slide is titled Additional Slides to move forward.
Slide 46: This slide represents Our Mission. State your mission, goals etc.
Slide 47: This slide showcases Our Team with Name and Designation to fill.
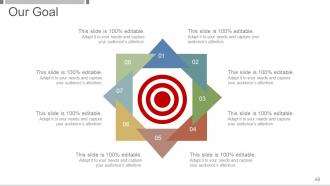
Slide 48: This slide shows Our Goals for your company.
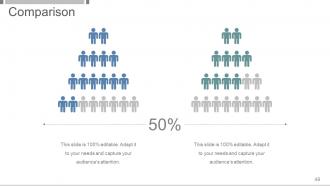
Slide 49: This slide shows a Comparison. You can edit the data and compare your product.
Slide 50: This slide displays Financial Projections And Key Metrics for customers and employees.
Slide 51: This is a Business Quotes slide to quote something you believe in.
Slide 52: This is a Dashboard slide to show- Strategic System, Success, Goal Process, Sales Review, Communication Study.
Slide 53: This is a Timelines slide to show- Plan, Budget, Schedule, Review.
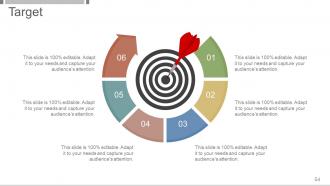
Slide 54: This slide shows Target image with text boxes.
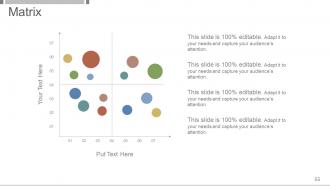
Slide 55: This slide shows a Matrix in terms of High and Low.
Slide 56: This is a LEGO slide with text boxes to show information.
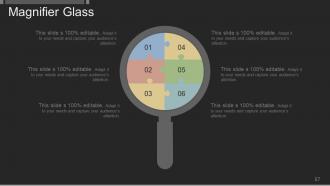
Slide 57: This slide shows a Magnifying glass with text boxes.
Slide 58: This slide presents a Bar graph in arrow form with text boxes.
Slide 59: This is a Thank You slide with Address# street number, city, state, Contact Numbers, Email Address.
Investment And Security Analysis Portfolio Management Powerpoint Presentation Slides with all 59 slides:
Our Investment And Security Analysis Portfolio Management Powerpoint Presentation Slides are awash with ideas. You will find them greatly empowering.
-
Very well designed and informative templates.
-
Easily Editable.


