Powerpoint Templates and Google slides for Visualized Analytics
Save Your Time and attract your audience with our fully editable PPT Templates and Slides.
-
 Visual Analytics Powerpoint Ppt Template Bundles
Engage buyer personas and boost brand awareness by pitching yourself using this prefabricated set. This Visual Analytics Powerpoint Ppt Template Bundles is a great tool to connect with your audience as it contains high-quality content and graphics. This helps in conveying your thoughts in a well-structured manner. It also helps you attain a competitive advantage because of its unique design and aesthetics. In addition to this, you can use this PPT design to portray information and educate your audience on various topics. With sixteen this is a great design to use for your upcoming presentations. Not only is it cost-effective but also easily pliable depending on your needs and requirements. As such color, font, or any other design component can be altered. It is also available for immediate download in different formats such as PNG, JPG, etc. So, without any further ado, download it now.
-
 Bigdata analytics visualization techniques technologies sources monitoring data
It has PPT slides covering wide range of topics showcasing all the core areas of your business needs. This complete deck focuses on Bigdata Analytics Visualization Techniques Technologies Sources Monitoring Data and consists of professionally designed templates with suitable graphics and appropriate content. This deck has total of twelve slides. Our designers have created customizable templates for your convenience. You can make the required changes in the templates like colour, text and font size. Other than this, content can be added or deleted from the slide as per the requirement. Get access to this professionally designed complete deck PPT presentation by clicking the download button below.
-
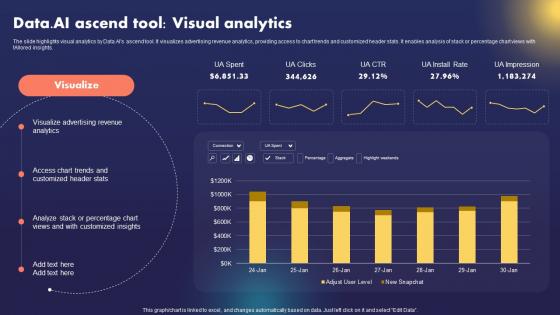 Data AI Artificial Intelligence Business Platform Data AI Ascend Tool Visual Analytics AI SS
The slide highlights visual analytics by Data.AIs ascend tool. It visualizes advertising revenue analytics, providing access to chart trends and customized header stats. It enables analysis of stack or percentage chart views with tAIlored insights. Deliver an outstanding presentation on the topic using this Data AI Artificial Intelligence Business Platform Data AI Ascend Tool Visual Analytics AI SS. Dispense information and present a thorough explanation of Visual Analytics By Data AI, Visualizes Advertising, Revenue Analytics, Customized Header Stats using the slides given. This template can be altered and personalized to fit your needs. It is also available for immediate download. So grab it now.
-
 Visual Analytics Dashboard To Boost Marketer Roi
This slide outlines the visual analytics dashboard for marketers. It includes actionable insights and comprehensive view of marketing performance. Presenting our well structured Visual Analytics Dashboard To Boost Marketer Roi. The topics discussed in this slide are Analytics, Dashboard, Performance. This is an instantly available PowerPoint presentation that can be edited conveniently. Download it right away and captivate your audience.
-
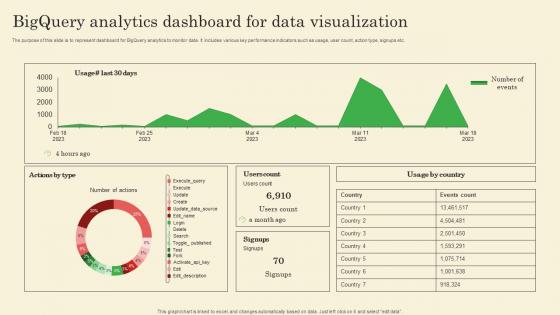 Bigquery Analytics Dashboard For Data Visualization
The purpose of this slide is to represent dashboard for BigQuery analytics to monitor data. It includes various key performance indicators such as usage, user count, action type, signups etc. Introducing our Bigquery Analytics Dashboard For Data Visualization set of slides. The topics discussed in these slides are Users Count, Usage By Country. This is an immediately available PowerPoint presentation that can be conveniently customized. Download it and convince your audience.
-
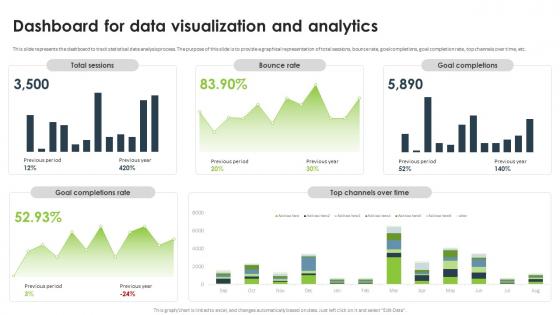 Statistical Analysis For Data Driven Dashboard For Data Visualization And Analytics
This slide represents the dashboard to track statistical data analysis process. The purpose of this slide is to provide a graphical representation of total sessions, bounce rate, goal completions, goal completion rate, top channels over time, etc. Present the topic in a bit more detail with this Statistical Analysis For Data Driven Dashboard For Data Visualization And Analytics. Use it as a tool for discussion and navigation on Data Visualization And Analytics, Bounce Rate, Goal Completions, Goal Completion Rate. This template is free to edit as deemed fit for your organization. Therefore download it now.
-
 Advanced Data Analytics Visualization Tool Comparison Matrix
This slide highlights the comparative analysis among several advanced data analytics visualization tools. The purpose of this template is to help businesses make informed decisions regarding purchases. It includes parameters such as pricing, number of downloads, ratings, etc.Presenting our well structured Advanced Data Analytics Visualization Tool Comparison Matrix. The topics discussed in this slide are Facilitates Communicating, Researchers Understand, Predictive Analysis. This is an instantly available PowerPoint presentation that can be edited conveniently. Download it right away and captivate your audience.
-
 Advanced Data Analytics Visualization Tools Icon
Introducing our Advanced Data Analytics Visualization Tools Icon set of slides. The topics discussed in these slides are Advanced Data Analytics, Visualization Tools Icon. This is an immediately available PowerPoint presentation that can be conveniently customized. Download it and convince your audience.
-
 Big Data Visualization Uses For HR Analytics
This slide represents the major uses and applications of big data visualization for HR analytics. It further includes areas of use of data visualization such as recruiting, retention, turnover, productivity, workforce planning, etc. Introducing our premium set of slides with Big Data Visualization Uses For HR Analytics. Ellicudate the six stages and present information using this PPT slide. This is a completely adaptable PowerPoint template design that can be used to interpret topics like Recruiting, Turnover, Planning. So download instantly and tailor it with your information.
-
 Difference Between Visual And Data Analytics
This slide outlines the comparison between visual and data analytics. It includes various basics such as meaning, platforms, usage, industries, tools and performance. Presenting our well structured Difference Between Visual And Data Analytics. The topics discussed in this slide are Service, Management, Dashboards. This is an instantly available PowerPoint presentation that can be edited conveniently. Download it right away and captivate your audience.
-
 Human Computer Interaction In Visual Software Analytics
This slide outlines the human computer interaction role in visual software analytics. It includes various aspects such as healthcare, artificial intelligence and visual analytics. Presenting our set of slides with Human Computer Interaction In Visual Software Analytics. This exhibits information on three stages of the process. This is an easy to edit and innovatively designed PowerPoint template. So download immediately and highlight information on Visual Analytics, Human Computer Interaction, Artificial Intelligence.
-
 Interactive Dynamics Arrangement For Visual Analytics
This slide outlines the classification of interactive dynamics for visual analytics that provide information about datasets and patterns. It includes various aspects such as data and view specification, view manipulation and process and provenance. Introducing our premium set of slides with Interactive Dynamics Arrangement For Visual Analytics. Ellicudate the three stages and present information using this PPT slide. This is a completely adaptable PowerPoint template design that can be used to interpret topics like Data View Specification, View Manipulation, Process Provenance . So download instantly and tailor it with your information.
-
 Types Of Big Data Visual Analytics
This slide outlines the visual analytics type to explore and analyze large datasets to achieve analytical objectives. It includes various types such as charts, plots, maps and word clouds. Presenting our set of slides with Types Of Big Data Visual Analytics. This exhibits information on four stages of the process. This is an easy to edit and innovatively designed PowerPoint template. So download immediately and highlight information on Analytics, Unstructured, Demonstrate.
-
 Visual Analytics Best Practices To Manage Dataset
This slide outlines the Visual analytics consideration to represent the structure and relationships within the graphical dataset. It includes various aspects such as define goals, integrate and manage data, simplify visualization and get inspired. Introducing our premium set of slides with Visual Analytics Best Practices To Manage Dataset. Ellicudate the four stages and present information using this PPT slide. This is a completely adaptable PowerPoint template design that can be used to interpret topics like Define Goals, Integrate And Manage Data, Simplify Visualizations. So download instantly and tailor it with your information.
-
 Visual Analytics Challenges And Their Solutions
This slide outlines the challenges in visual analytics and their potential solutions to fix analytical issues . It includes key challenges such as visual noise, information loss and high-performance requirements. Presenting our well structured Visual Analytics Challenges And Their Solutions. The topics discussed in this slide are Information Loss, Visual Noise, High Performance Requirements. This is an instantly available PowerPoint presentation that can be edited conveniently. Download it right away and captivate your audience.
-
 Visual Analytics Checklist For Data Arrangement
This slide outlines the visual analytics checklist that assist to ensure the data visualizations are accurate and impactful. It includes various activity such as check the reliability and integrity of the data sources, address any incomplete or missing data is proper, etc. Presenting our well structured Visual Analytics Checklist For Data Arrangement. The topics discussed in this slide are Data Arrangement, Data Visualizations, Visual Analytics. This is an instantly available PowerPoint presentation that can be edited conveniently. Download it right away and captivate your audience.
-
 Visual Analytics Future Design Trends
This slide outlines the numerous design trends to enhance user experiences and improve data exploration capabilities. It includes key aspects such as survey data, video inforgaphic and real-time data visualization. Presenting our set of slides with Visual Analytics Future Design Trends. This exhibits information on three stages of the process. This is an easy to edit and innovatively designed PowerPoint template. So download immediately and highlight information on Survey Data, Video Infographic, Real Time Data Visualization.
-
 Visual Analytics Roadmap For Organizational Goals
This slide outlines the visual analytics roadmap for data driven decision making and business insights. It includes various strategy such as assessment and planning, data integration and etc. Presenting our well structured Visual Analytics Roadmap For Organizational Goals. The topics discussed in this slide are Analytics, Roadmap, Organizational. This is an instantly available PowerPoint presentation that can be edited conveniently. Download it right away and captivate your audience.
-
 Visual Analytics Tools In Business Intelligence
This slide outlines the visual analytics tools that enable organizations to transform complex data into visual representations. It includes key tools with their features, pros, cons, pricing and user review. Presenting our well structured Visual Analytics Tools In Business Intelligence. The topics discussed in this slide are Business, Intelligence, Analytics. This is an instantly available PowerPoint presentation that can be edited conveniently. Download it right away and captivate your audience.
-
 Visual Bar Chart Data Analytics Icon
Presenting our set of slides with Visual Bar Chart Data Analytics Icon. This exhibits information on three stages of the process. This is an easy to edit and innovatively designed PowerPoint template. So download immediately and highlight information on Analytics Icon, Visual Bar Chart Data.
-
 Visual Information Analytics Report Icon
Introducing our premium set of slides with Visual Information Analytics Report Icon. Ellicudate the three stages and present information using this PPT slide. This is a completely adaptable PowerPoint template design that can be used to interpret topics like Information, Analytics, Report Icon. So download instantly and tailor it with your information.
-
 Visual Line Graph Analytics Icon
Presenting our set of slides with Visual Line Graph Analytics Icon. This exhibits information on three stages of the process. This is an easy to edit and innovatively designed PowerPoint template. So download immediately and highlight information on Visual Line Graph, Analytics Icon.
-
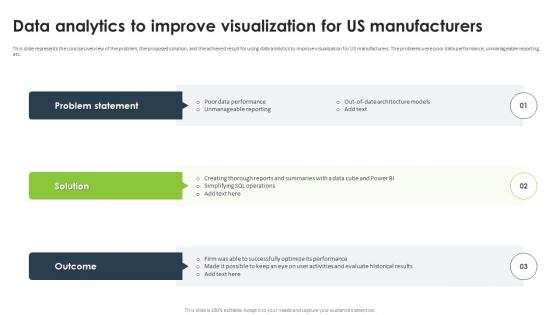 Data Analytics To Improve Visualization For Us Manufacturers Statistical Analysis For Data Driven
This slide represents the concise overview of the problem, the proposed solution, and the achieved result for using data analytics to improve visualization for US manufacturers. The problems were poor data performance, unmanageable reporting, etc. Increase audience engagement and knowledge by dispensing information using Data Analytics To Improve Visualization For Us Manufacturers Statistical Analysis For Data Driven. This template helps you present information on three stages. You can also present information on Poor Data Performance, Unmanageable Reporting, Data Analytics, Visualization For US Manufacturers using this PPT design. This layout is completely editable so personaize it now to meet your audiences expectations.
-
 4 Week Social Media And Web Analytics Training Schedule Data Visualization DTE SS
This slide brings forth a four-week social media and web analytics training schedule to be used by trainers and employees for tracking their training activities. The elements in the slide are activities and training approach for each. Present the topic in a bit more detail with this 4 Week Social Media And Web Analytics Training Schedule Data Visualization DTE SS. Use it as a tool for discussion and navigation on Social Data Types, Load Social Media Trends, Activity. This template is free to edit as deemed fit for your organization. Therefore download it now.
-
 Business Analytics Software Training Timeline Data Visualization DTE SS
This slide contains business a timeline for business analytics software training to be utilized by trainers for smooth and organized training. The training will be held for five days containg topis such as statistical analysis, machine learning, etc. Introducing Business Analytics Software Training Timeline Data Visualization DTE SS to increase your presentation threshold. Encompassed with five stages, this template is a great option to educate and entice your audience. Dispence information on Exploratory Data Analysis, Statistical Analysis, Data Visualization, using this template. Grab it now to reap its full benefits.
-
 Business Analytics Training Team Roles And Responsibilities Data Visualization DTE SS
This slide highlights the roles and responsibilities of members who will conduct training on business analytics. The top roles covered in the slide are training lead, subject matter experts, and training coordinators. Present the topic in a bit more detail with this Business Analytics Training Team Roles And Responsibilities Data Visualization DTE SS. Use it as a tool for discussion and navigation on Training Lead, Responsibilities, Trainer Information. This template is free to edit as deemed fit for your organization. Therefore download it now.
-
 Checklist To Track Business Analytics Training Success Data Visualization DTE SS
Deliver an outstanding presentation on the topic using this Checklist To Track Business Analytics Training Success Data Visualization DTE SS. Dispense information and present a thorough explanation of Curriculum Development, Data Analytics, Machine Learning using the slides given. This template can be altered and personalized to fit your needs. It is also available for immediate download. So grab it now.
-
 Cost Allocation For Business Analytics Training Data Visualization DTE SS
This slide on business analytics training budget provides an overview of allocated funds, aiding managers in effective financial planning for the comprehensive training program in business analytics. The expenses highlighted are trainer fees, materials, etc. Present the topic in a bit more detail with this Cost Allocation For Business Analytics Training Data Visualization DTE SS. Use it as a tool for discussion and navigation on Lead Instructors, Cost Estimation, Technology. This template is free to edit as deemed fit for your organization. Therefore download it now.
-
 Data Analytics Training Implemented By Netflix Data Visualization DTE SS
This slide on business analytics training implemented by Netflix offers insights into Netflixs approach, providing practical lessons for managers in structuring effective business analytics training programs. Elements in the slide are company details, challenges, etc. Increase audience engagement and knowledge by dispensing information using Data Analytics Training Implemented By Netflix Data Visualization DTE SS. This template helps you present information on three stages. You can also present information on Challenge, Training Course, Result using this PPT design. This layout is completely editable so personaize it now to meet your audiences expectations.
-
 Data Visualization Business Analytics Training Program For Employees DTE SS
Introducing Data Visualization Business Analytics Training Program For Employees DTE SS to increase your presentation threshold. Encompassed with three stages, this template is a great option to educate and entice your audience. Dispence information on Data Automation, Data Visualization Proficiency, Training Content, using this template. Grab it now to reap its full benefits.
-
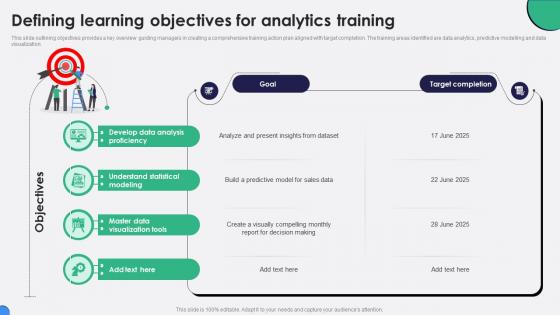 Defining Learning Objectives For Analytics Training Data Visualization DTE SS
This slide outlining objectives provides a key overview guiding managers in creating a comprehensive training action plan aligned with target completion. The training areas identified are data analytics, predictive modelling and data visualization. Introducing Defining Learning Objectives For Analytics Training Data Visualization DTE SS to increase your presentation threshold. Encompassed with two stages, this template is a great option to educate and entice your audience. Dispence information on Goal, Target Completion, Master Data Visualization Tools, using this template. Grab it now to reap its full benefits.
-
 Employee Business Analytics Training Result Data Visualization DTE SS
Deliver an outstanding presentation on the topic using this Employee Business Analytics Training Result Data Visualization DTE SS. Dispense information and present a thorough explanation of Employee, Pass Percentage,Demonstrates Programs using the slides given. This template can be altered and personalized to fit your needs. It is also available for immediate download. So grab it now.
-
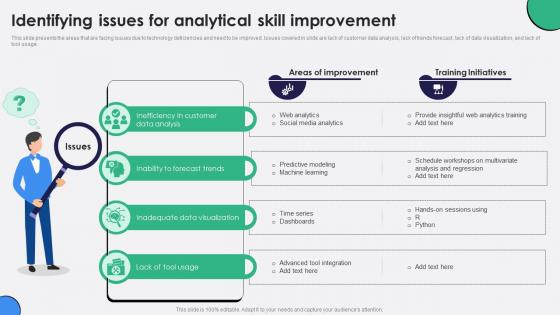 Identifying Issues For Analytical Skill Improvement Data Visualization DTE SS
This slide presents the areas that are facing issues due to technology deficiencies and need to be improved. Issues covered in slide are lack of customer data analysis, lack of trends forecast, lack of data visualization, and lack of tool usage. Increase audience engagement and knowledge by dispensing information using Identifying Issues For Analytical Skill Improvement Data Visualization DTE SS. This template helps you present information on four stages. You can also present information on Areas Improvement, Training Initiatives, Lack Tool Usage using this PPT design. This layout is completely editable so personaize it now to meet your audiences expectations.
-
 Kpis To Measure Analytics Training Effectiveness Data Visualization DTE SS
This slide brings forth post-training improvements in IT team skill KPIs, offering managers a clear overview of the enhanced skills and capabilities within the team, and facilitating the assessment of training program effectiveness. Increase audience engagement and knowledge by dispensing information using Kpis To Measure Analytics Training Effectiveness Data Visualization DTE SS. This template helps you present information on four stages. You can also present information on KPI, Team Proficiency Level, Business using this PPT design. This layout is completely editable so personaize it now to meet your audiences expectations.
-
 Social Media And Web Analytics Learning Course Data Visualization DTE SS
The following slide highlights the topics that will be covered in social media and web analytics training such as social media data, visualizing patterns in data, social media networks and social media text. Deliver an outstanding presentation on the topic using this Social Media And Web Analytics Learning Course Data Visualization DTE SS. Dispense information and present a thorough explanation of Social Media Data, Visualizing Patterns Data, Social Media Networks using the slides given. This template can be altered and personalized to fit your needs. It is also available for immediate download. So grab it now.
-
 Timeline For Conducting Business Analytics Training Data Visualization DTE SS
Increase audience engagement and knowledge by dispensing information using Timeline For Conducting Business Analytics Training Data Visualization DTE SS. This template helps you present information on three stages. You can also present information on Application ML Algorithms, Application EDA, Real Company Datasets using this PPT design. This layout is completely editable so personaize it now to meet your audiences expectations.
-
 Tools Training For Automating Business Analytics Functions Data Visualization DTE SS
The following slide includes information regarding tools that can be used by managers to automate business analytics functions and streamline analytics processes. The elements in the slide include tool name, purpose, key focus, business application, and techniques. Introducing Tools Training For Automating Business Analytics Functions Data Visualization DTE SS to increase your presentation threshold. Encompassed with three stages, this template is a great option to educate and entice your audience. Dispence information on Training Purpose, Business Application, Training Techniques, using this template. Grab it now to reap its full benefits.
-
 XR Applications For Enhanced Data Visualization And Analytics Extended Reality Spectrum Bridging TC SS
This slide showcases various use cases of extended reality XR in enhancing data visualization and analytics across various industries. It includes scientific research, business analytics, healthcare diagnostics, geospatial mapping and manufacturing And quality control. Introducing XR Applications For Enhanced Data Visualization And Analytics Extended Reality Spectrum Bridging TC SS to increase your presentation threshold. Encompassed with Three stages, this template is a great option to educate and entice your audience. Dispence information on Scientific Research, Business Analytics, Healthcare Diagnostics using this template. Grab it now to reap its full benefits.
-
 Visual Representation Of Predictive Analytics Models Predictive Analytics For Data Driven AI SS
This slide showcases visual representation of various predictive analytics models that can help business to make data-driven decisions. Various models showcases are decision trees, regression and neural networks. Increase audience engagement and knowledge by dispensing information using Visual Representation Of Predictive Analytics Models Predictive Analytics For Data Driven AI SS. This template helps you present information on three stages. You can also present information on Decision Trees, Regression, Neural Networks, Predictive Analytics Models using this PPT design. This layout is completely editable so personaize it now to meet your audiences expectations.
-
 Text Analysis Stage 4 Visualization Text Analytics
This slide outlines the fourth stage of text analysis, visualization, which is used to clearly represent the text analysis results through charts, graphs, etc. Introducing Text Analysis Stage 4 Visualization Text Analytics to increase your presentation threshold. Encompassed with five stages, this template is a great option to educate and entice your audience. Dispence information on Visualization, Text Analysis Stage, Identify Issues, Build Action Plans, using this template. Grab it now to reap its full benefits.
-
 Example of visual analytics powerpoint guide
Presenting example of visual analytics powerpoint guide. This is a example of visual analytics powerpoint guide. This is a four stage process. The stages in this process are data analysis, business problem, find structure, data view.
-
 Data Visualization With Augmented Analytics Dashboard Snapshot Ppt Infographics
This slide represents the data visualization with an augmented analytics dashboard covering sales, spending per customer, gross profit, unique customers, unique purchase, and gross profit. Present the topic in a bit more detail with this Data Visualization With Augmented Analytics Dashboard Snapshot Ppt Infographics. Use it as a tool for discussion and navigation on Data Visualization With Augmented Analytics Dashboard. This template is free to edit as deemed fit for your organization. Therefore download it now.
-
 Visual Analytical KPI Dashboard Snapshot For Data Warehouse
Presenting our well structured Visual Analytical KPI Dashboard Snapshot For Data Warehouse. The topics discussed in this slide are Profit, Revenue Change, Analysis. This is an instantly available PowerPoint presentation that can be edited conveniently. Download it right away and captivate your audience.
-
 Oracle analytics cloud it oracle analytics cloud solutions powerful data visualization
This slide represents the solutions provided by OAC to business problems, and it shows how OAC can help create data reports that are compelling and easy to understand. Deliver an outstanding presentation on the topic using this Oracle Analytics Cloud It Oracle Analytics Cloud Solutions Powerful Data Visualization. Dispense information and present a thorough explanation of Oracle Analytics Cloud Solutions Powerful Data Visualization using the slides given. This template can be altered and personalized to fit your needs. It is also available for immediate download. So grab it now.
-
 Oracle analytics cloud it oracle data visualization cloud service dvcs
This slide depicts the data visualization service provided by the oracle analytics cloud and how it allows users to experiment with data easily to visualize data from different perspectives. Deliver an outstanding presentation on the topic using this Oracle Analytics Cloud It Oracle Data Visualization Cloud Service Dvcs. Dispense information and present a thorough explanation of Visualization, Service, Representations using the slides given. This template can be altered and personalized to fit your needs. It is also available for immediate download. So grab it now.
-
 Data Visualizations Playbook How To Bridge Business Intelligence And Predictive Analytics
This template depicts that with interactive BI visualization and predictive modeling in the same enterprise analytics platform, organizations can easily collaborate on initiatives that make recommended actions accessible to the business. Present the topic in a bit more detail with this Data Visualizations Playbook How To Bridge Business Intelligence And Predictive Analytics. Use it as a tool for discussion and navigation on Probability Package, Customer Information, Trend Internet, Internet Data. This template is free to edit as deemed fit for your organization. Therefore download it now.
-
 Data Visualizations Playbook How To Overcome Search Driven Analytics Barriers
This template depicts that intuitive search-driven analytics gives users an easy way to ask questions, receive suggestions on what to query, and visualize their data. Present the topic in a bit more detail with this Data Visualizations Playbook How To Overcome Search Driven Analytics Barriers. Use it as a tool for discussion and navigation on Retail, Total Revenue, Region And Department. This template is free to edit as deemed fit for your organization. Therefore download it now.
-
 Business kpi contain visualization aid of analytic data in form of bar chart
Presenting this set of slides with name - Business Kpi Contain Visualization Aid Of Analytic Data In Form Of Bar Chart. This is a four stage process. The stages in this process are Business Kpi, Business Dashboard, Business Metrics.
-
 Web-based data visualization and analytics on mobile devices
Presenting this set of slides with name - Web-Based Data Visualization And Analytics On Mobile Devices. This is a two stage process. The stages in this process are Data Visualization, Data Management, Data Representation.
-
 Analytical competitors ppt powerpoint presentation visual aids summary cpb
Presenting Analytical Competitors Ppt Powerpoint Presentation Visual Aids Summary Cpb slide which is completely adaptable. The graphics in this PowerPoint slide showcase four stages that will help you succinctly convey the information. In addition, you can alternate the color, font size, font type, and shapes of this PPT layout according to your content. This PPT presentation can be accessed with Google Slides and is available in both standard screen and widescreen aspect ratios. It is also a useful set to elucidate topics like Analytical Competitors. This well structured design can be downloaded in different formats like PDF, JPG, and PNG. So, without any delay, click on the download button now.
-
 Applications Hr Analytics Ppt Powerpoint Presentation Professional Visual Aids Cpb
Presenting our Applications Hr Analytics Ppt Powerpoint Presentation Professional Visual Aids Cpb PowerPoint template design. This PowerPoint slide showcases four stages. It is useful to share insightful information on Applications Hr Analytics This PPT slide can be easily accessed in standard screen and widescreen aspect ratios. It is also available in various formats like PDF, PNG, and JPG. Not only this, the PowerPoint slideshow is completely editable and you can effortlessly modify the font size, font type, and shapes according to your wish. Our PPT layout is compatible with Google Slides as well, so download and edit it as per your knowledge.
-
 Visual Analytics Branch Of Visualization Research Ppt Slides Picture
This slide shows visual analytics, the last branch of visualization research, which emerged from the advancements in the other two branches and mainly focused on analytical reasoning. Increase audience engagement and knowledge by dispensing information using Visual Analytics Branch Of Visualization Research Ppt Slides Picture. This template helps you present information on five stages. You can also present information on Visualization And Information, Analytical Reasoning, Interactive Visual Interface using this PPT design. This layout is completely editable so personaize it now to meet your audiences expectations.
-
 Visualization research it visual analytics branch of visualization research
This slide shows visual analytics, the last branch of visualization research, which emerged from the advancements in the other two branches and mainly focused on analytical reasoning. Increase audience engagement and knowledge by dispensing information using Visualization Research IT Visual Analytics Branch Of Visualization Research. This template helps you present information on one stages. You can also present information on Visualization And Information Visualization, Focus On Analytical Reasoning, Interactive Visual Interface using this PPT design. This layout is completely editable so personaize it now to meet your audiences expectations.
-
 Predictive Analytics Workflow Ppt Powerpoint Presentation Slides Visuals Cpb
Presenting our Predictive Analytics Workflow Ppt Powerpoint Presentation Slides Visuals Cpb PowerPoint template design. This PowerPoint slide showcases three stages. It is useful to share insightful information on Predictive Analytics Workflow. This PPT slide can be easily accessed in standard screen and widescreen aspect ratios. It is also available in various formats like PDF, PNG, and JPG. Not only this, the PowerPoint slideshow is completely editable and you can effortlessly modify the font size, font type, and shapes according to your wish. Our PPT layout is compatible with Google Slides as well, so download and edit it as per your knowledge.
-
 Importance data visualization analytics ppt powerpoint presentation summary ideas cpb
Presenting our Importance Data Visualization Analytics Ppt Powerpoint Presentation Summary Ideas Cpb PowerPoint template design. This PowerPoint slide showcases three stages. It is useful to share insightful information on Importance Data Visualization Analytics. This PPT slide can be easily accessed in standard screen and widescreen aspect ratios. It is also available in various formats like PDF, PNG, and JPG. Not only this, the PowerPoint slideshow is completely editable and you can effortlessly modify the font size, font type, and shapes according to your wish. Our PPT layout is compatible with Google Slides as well, so download and edit it as per your knowledge.
-
 Data Visualizations Playbook Analytics From All The Data At Scale Challenges
This template covers the problems while implementing analytics from all the data, at scale in the organization. The challenges are large and complex data and analytic slowdown. Introducing Data Visualizations Playbook Analytics From All The Data At Scale Challenges to increase your presentation threshold. Encompassed with one stages, this template is a great option to educate and entice your audience. Dispence information on Challenges, Analytic Slowdown, Large Complex Data, using this template. Grab it now to reap its full benefits.
-
 Data Visualizations Playbook Business Intelligence And Predictive Analytics Challenges
This template covers the problems while implementing BI and predictive analytics in the organization. The challenges are undefined KPIs and metrics, and unable to hire right data science talent. Increase audience engagement and knowledge by dispensing information using Data Visualizations Playbook Business Intelligence And Predictive Analytics Challenges. This template helps you present information on two stages. You can also present information on Challenges, Data Science, Common Misconception, Operationalizing Data Science using this PPT design. This layout is completely editable so personaize it now to meet your audiences expectations.
-
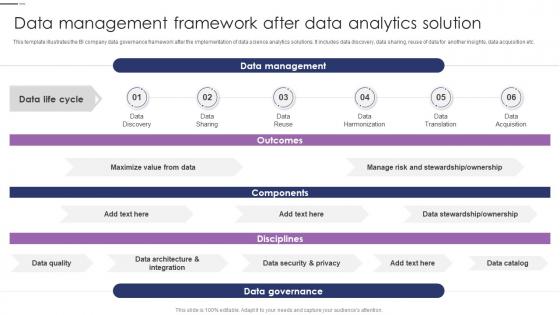 Data Visualizations Playbook Data Management Framework After Data Analytics Solution
This template illustrates the BI company data governance framework after the implementation of data science analytics solutions. It includes data discovery, data sharing, reuse of data for another insights, data acquisition etc. Present the topic in a bit more detail with this Data Visualizations Playbook Data Management Framework After Data Analytics Solution. Use it as a tool for discussion and navigation on Data Management, Data Governance, Data Sharing. This template is free to edit as deemed fit for your organization. Therefore download it now.
-
 Data Visualizations Playbook Final Thoughts For Data Analytics Playbook
This template covers the data analytics company final thoughts at the end of the e-book. Introducing Data Visualizations Playbook Final Thoughts For Data Analytics Playbook to increase your presentation threshold. Encompassed with five stages, this template is a great option to educate and entice your audience. Dispence information on Growth, Business Insights, Organization, Analytics, using this template. Grab it now to reap its full benefits.
-
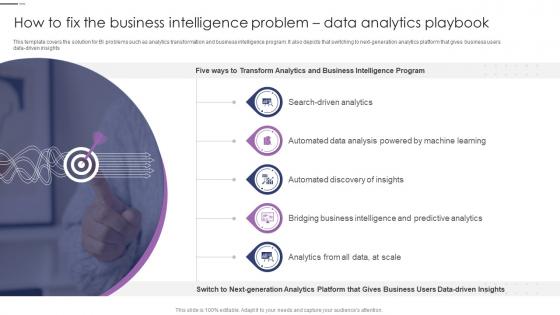 Data Visualizations Playbook How To Fix The Business Intelligence Problem Data Analytics
This template covers the solution for BI problems such as analytics transformation and business intelligence program. It also depicts that switching to next-generation analytics platform that gives business users data-driven insights. Introducing Data Visualizations Playbook How To Fix The Business Intelligence Problem Data Analytics to increase your presentation threshold. Encompassed with five stages, this template is a great option to educate and entice your audience. Dispence information on Search Driven Analytics, Automated Data Analysis, Machine Learning, using this template. Grab it now to reap its full benefits.


