Powerpoint Templates and Google slides for Visualizations And Dashboards
Save Your Time and attract your audience with our fully editable PPT Templates and Slides.
-
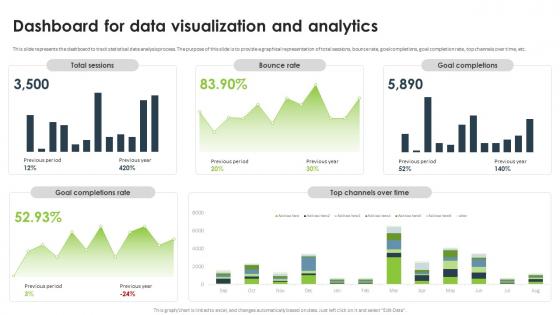
 Statistical Analysis For Data Driven Dashboard For Data Visualization And Analytics
This slide represents the dashboard to track statistical data analysis process. The purpose of this slide is to provide a graphical representation of total sessions, bounce rate, goal completions, goal completion rate, top channels over time, etc. Present the topic in a bit more detail with this Statistical Analysis For Data Driven Dashboard For Data Visualization And Analytics. Use it as a tool for discussion and navigation on Data Visualization And Analytics, Bounce Rate, Goal Completions, Goal Completion Rate. This template is free to edit as deemed fit for your organization. Therefore download it now.
-
 NFT Trading NFT Transaction Analysis And Tracking Dashboard Ppt Powerpoint Presentation Visual
This slide demonstrates the dashboard for tracking NFT transactions and analysis based on daily sales, ETH volume collections, and so on. Present the topic in a bit more detail with this NFT Trading NFT Transaction Analysis And Tracking Dashboard Ppt Powerpoint Presentation Visual. Use it as a tool for discussion and navigation on Transaction Analysis, Tracking Dashboard, Volume Collections. This template is free to edit as deemed fit for your organization. Therefore download it now.
-
 Dashboards Visualization In Powerpoint And Google Slides Cpb
Presenting Dashboards Visualization In Powerpoint And Google Slides Cpb slide which is completely adaptable. The graphics in this PowerPoint slide showcase six stages that will help you succinctly convey the information. In addition, you can alternate the color, font size, font type, and shapes of this PPT layout according to your content. This PPT presentation can be accessed with Google Slides and is available in both standard screen and widescreen aspect ratios. It is also a useful set to elucidate topics like Dashboards Visualization. This well-structured design can be downloaded in different formats like PDF, JPG, and PNG. So, without any delay, click on the download button now.
-
 BI Dashboard Icon For Data Analysis And Visualization
Presenting our set of slides with BI Dashboard Icon For Data Analysis And Visualization. This exhibits information on three stages of the process. This is an easy to edit and innovatively designed PowerPoint template. So download immediately and highlight information on BI Dashboard Icon, Data Analysis, Visualization.
-
 Dashboard Brand Visual Colored Icon In Powerpoint Pptx Png And Editable Eps Format
This is a colourful powerpoint icon that is perfect for adding visual impact to your presentation. It is easy to use and will help you make an impression with your audience. Its a great way to add a professional touch to your slides.
-
 Dashboard Brand Visual Monotone Icon In Powerpoint Pptx Png And Editable Eps Format
This Monotone powerpoint icon is perfect for presentations and other professional documents. It is a vector graphic and is easy to customize with a single click. It has a modern and minimalistic design, perfect for any project. It is available in various sizes and formats, so you can use it for any purpose.
-
 Kpi and dashboard ppt powerpoint presentation file visual aids
Presenting this set of slides with name - Kpi And Dashboard Ppt Powerpoint Presentation File Visual Aids. This is a two stage process. The stages in this process are Business, Management, Marketing.
-
 Kpi and dashboard summary management ppt powerpoint visual aids
Presenting this set of slides with name KPI And Dashboard Summary Management Ppt Powerpoint Visual Aids. This is a two stage process. The stages in this process are KPI Dashboard, KPI Metrics, Business, Management, Marketing. This is a completely editable PowerPoint presentation and is available for immediate download. Download now and impress your audience.
-
 Kpi metrics and dashboards ppt powerpoint presentation visual aids professional
Presenting this set of slides with name Kpi Metrics And Dashboards Ppt Powerpoint Presentation Visual Aids Professional. The topics discussed in these slides are KPI Metrics, Dashboards. This is a completely editable PowerPoint presentation and is available for immediate download. Download now and impress your audience.
-
 Data visualization dashboard snapshot with net and gross profit
Presenting this set of slides with name Data Visualization Dashboard With Net And Gross Profit. The topics discussed in these slides are Data Visualization Dashboard Snapshot With Net And Gross Profit. This is a completely editable PowerPoint presentation and is available for immediate download. Download now and impress your audience.


