Powerpoint Templates and Google slides for Visualization For US Manufacturers
Save Your Time and attract your audience with our fully editable PPT Templates and Slides.
-
 Data Analytics To Improve Visualization For Us Manufacturers Statistical Analysis For Data Driven
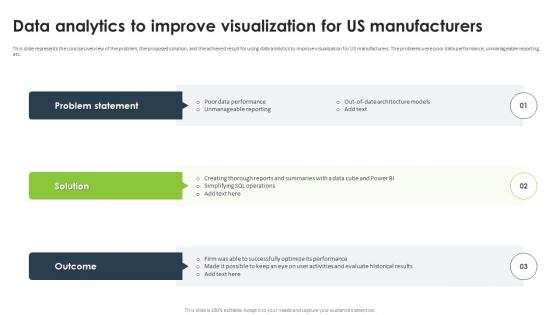
This slide represents the concise overview of the problem, the proposed solution, and the achieved result for using data analytics to improve visualization for US manufacturers. The problems were poor data performance, unmanageable reporting, etc. Increase audience engagement and knowledge by dispensing information using Data Analytics To Improve Visualization For Us Manufacturers Statistical Analysis For Data Driven. This template helps you present information on three stages. You can also present information on Poor Data Performance, Unmanageable Reporting, Data Analytics, Visualization For US Manufacturers using this PPT design. This layout is completely editable so personaize it now to meet your audiences expectations.


