Powerpoint Templates and Google slides for Track Analytics
Save Your Time and attract your audience with our fully editable PPT Templates and Slides.
-
 Google Analytics Tool To Track Bounce Rate Edu Ppt
Presenting Google Analytics Tool to Track Bounce Rate. Our PowerPoint experts have included all the necessary templates, designs, icons, graphs, and other essential material. This deck is well crafted by an extensive research. Slides consist of amazing visuals and appropriate content. These PPT slides can be instantly downloaded with just a click. Compatible with all screen types and monitors. Supports Google Slides. Premium Customer Support available. Suitable for use by managers, employees, and organizations. These slides are easily customizable. You can edit the color, text, icon, and font size to suit your requirements.
-
 Google Analytics Tool To Track Search Queries Edu Ppt
Presenting Google Analytics Tool to Track Search Queries. These slides are 100 percent made in PowerPoint and are compatible with all screen types and monitors. They also support Google Slides. Premium Customer Support available. Suitable for use by managers, employees, and organizations. These slides are easily customizable. You can edit the color, text, icon, and font size to suit your requirements.
-
 Google Analytics Tool To Track Traffic Changes Edu Ppt
Presenting Google Analytics Tool to Track Traffic Changes. Our PowerPoint experts have included all the necessary templates, designs, icons, graphs, and other essential material. This deck is well crafted by an extensive research. Slides consist of amazing visuals and appropriate content. These PPT slides can be instantly downloaded with just a click. Compatible with all screen types and monitors. Supports Google Slides. Premium Customer Support available. Suitable for use by managers, employees, and organizations. These slides are easily customizable. You can edit the color, text, icon, and font size to suit your requirements.
-
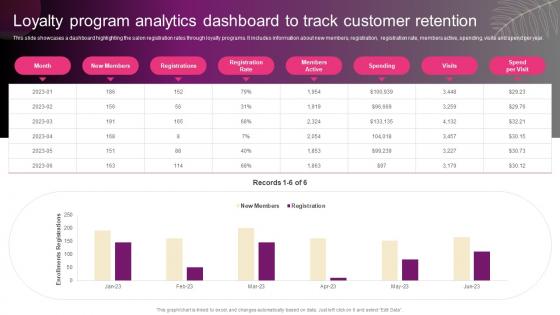 Loyalty Program Analytics Dashboard To Track New Hair And Beauty Salon Marketing Strategy SS
This slide showcases a dashboard highlighting the salon registration rates through loyalty programs. It includes information about new members, registration, registration rate, members active, spending, visits and spend per year. Present the topic in a bit more detail with this Loyalty Program Analytics Dashboard To Track New Hair And Beauty Salon Marketing Strategy SS. Use it as a tool for discussion and navigation on Loyalty Program, Analytics Dashboard, Customer Retention. This template is free to edit as deemed fit for your organization. Therefore download it now.
-
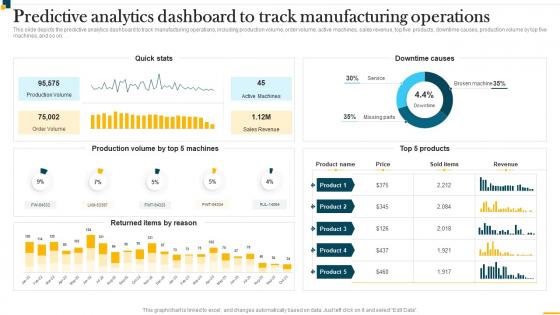 IT In Manufacturing Industry V2 Predictive Analytics Dashboard To Track Manufacturing Operations
This slide depicts the predictive analytics dashboard to track manufacturing operations, including production volume, order volume, active machines, sales revenue, top five products, downtime causes, production volume by top five machines, and so on. Present the topic in a bit more detail with this IT In Manufacturing Industry V2 Predictive Analytics Dashboard To Track Manufacturing Operations. Use it as a tool for discussion and navigation on Predictive Analytics Dashboard, Track Manufacturing Operations, Production Volume. This template is free to edit as deemed fit for your organization. Therefore download it now.
-
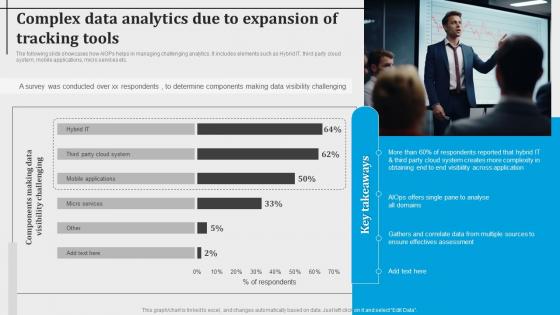 Complex Data Analytics Due To Expansion Of Tracking Tools Introduction To Aiops AI SS V
The following slide showcases how AIOPs helps in managing challenging analytics. It includes elements such as Hybrid IT, third party cloud system, mobile applications, micro services etc. Present the topic in a bit more detail with this Complex Data Analytics Due To Expansion Of Tracking Tools Introduction To Aiops AI SS V. Use it as a tool for discussion and navigation on Respondents, Reported. This template is free to edit as deemed fit for your organization. Therefore download it now.
-
 Analytics Dashboard To Track Website Performance Direct Response Marketing Channels Used To Increase MKT SS V
This slide provides an overview of the analytics dashboard that helps to measure the performance of the website. The dashboard includes visits, average session duration, bounce rate, page views and goal conversion. Present the topic in a bit more detail with this Analytics Dashboard To Track Website Performance Direct Response Marketing Channels Used To Increase MKT SS V. Use it as a tool for discussion and navigation on Traffic Sources, Visitors By User Type. This template is free to edit as deemed fit for your organization. Therefore download it now.
-
 Social Media Analytics With Tools Dashboards For Social Media Analytics Tracking And Monitoring
This slide depicts the dashboard for Social Media Analytics insights. The purpose of this slide is to highlight insights such as brand awareness, audience growth, post-engagement rate, provider analytics, etc. Present the topic in a bit more detail with this Social Media Analytics With Tools Dashboards For Social Media Analytics Tracking And Monitoring. Use it as a tool for discussion and navigation on Dashboards For Social Media, Analytics Tracking And Monitoring, Brand Awareness, Audience Growth, Post Engagement Rate. This template is free to edit as deemed fit for your organization. Therefore download it now.
-
 HR Analytics To Track Employees Information
The slide highlights key aspects such as employee overview, monthly analysis, performance metrics, historical trends, occupancy rates, and headcount. These HR analytics tools assist in precise employee information tracking, enabling data driven HR management decisions. Introducing our HR Analytics To Track Employees Information set of slides. The topics discussed in these slides are Headcount By Office, Headcount By Tenure Range, Headcount By Department. This is an immediately available PowerPoint presentation that can be conveniently customized. Download it and convince your audience.
-
 Big Data Analytics Dashboard To Track Retail Big Data Analytics Applications Data Analytics SS
This slide showcases dashboard for monitoring retail business performance which helps in improving revenue generation. It provides information regarding KPIs such as gross margin, sales, card abandonment rate, average unit price etc. Present the topic in a bit more detail with this Big Data Analytics Dashboard To Track Retail Big Data Analytics Applications Data Analytics SS. Use it as a tool for discussion and navigation on Cart Abandonment Rate, Average Transactions. This template is free to edit as deemed fit for your organization. Therefore download it now.
-
 Data Analytics Dashboard To Track Hospital Big Data Analytics Applications Data Analytics SS
This slide showcases dashboard for tracking hospitals activities which helps in improving performance efficiency. It provides information regarding bed occupancy rate, patient satisfaction rate, staff to patient ratio, room turnover etc. Present the topic in a bit more detail with this Data Analytics Dashboard To Track Hospital Big Data Analytics Applications Data Analytics SS. Use it as a tool for discussion and navigation on Bed Occupancy Rates, Equipment Utilization Rate. This template is free to edit as deemed fit for your organization. Therefore download it now.
-
 Analytics Dashboard Tracking Effective Energy Monitoring And Enabling Growth Centric DT SS
This slide presents how power companies can utilize analytics-driven insights for monitoring equipment health and performance. It includes predictive analytics, anomaly detection, trend analysis, and prescriptive analytics. Deliver an outstanding presentation on the topic using this Analytics Dashboard Tracking Effective Energy Monitoring And Enabling Growth Centric DT SS Dispense information and present a thorough explanation of Solar Energy, Carbon Savings, Financial Savings using the slides given. This template can be altered and personalized to fit your needs. It is also available for immediate download. So grab it now.
-
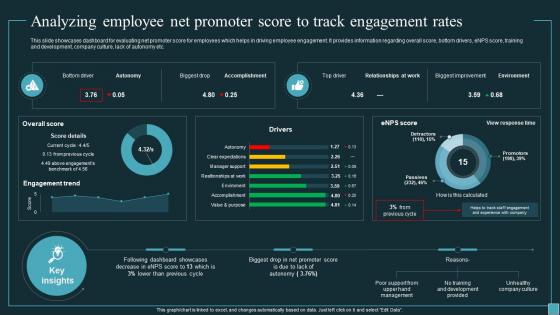 Analyzing Employee Net Promoter Score To Track Implementing Workforce Analytics Data Analytics SS
This slide showcases dashboard for evaluating net promoter score for employees which helps in driving employee engagement. It provides information regarding overall score, bottom drivers, eNPS score, training and development, company culture, lack of autonomy etc. Deliver an outstanding presentation on the topic using this Analyzing Employee Net Promoter Score To Track Implementing Workforce Analytics Data Analytics SS. Dispense information and present a thorough explanation of Analyzing Employee, Net Promoter Score, Track Engagement Rates, Company Culture, Lack Of Autonomy using the slides given. This template can be altered and personalized to fit your needs. It is also available for immediate download. So grab it now.
-
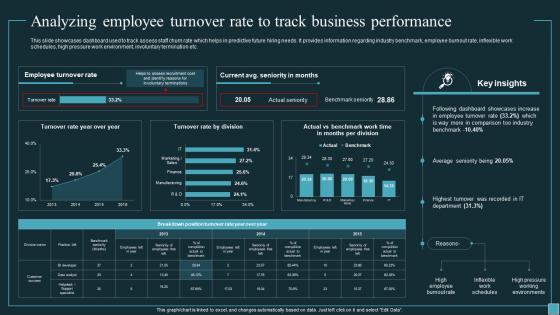 Analyzing Employee Turnover Rate To Track Business Implementing Workforce Analytics Data Analytics SS
This slide showcases dashboard used to track assess staff churn rate which helps in predictive future hiring needs. It provides information regarding industry benchmark, employee burnout rate, inflexible work schedules, high pressure work environment, involuntary termination etc. Present the topic in a bit more detail with this Analyzing Employee Turnover Rate To Track Business Implementing Workforce Analytics Data Analytics SS. Use it as a tool for discussion and navigation on Analyzing Employee Turnover Rate, Track Business Performance, Work Environment, Involuntary Termination. This template is free to edit as deemed fit for your organization. Therefore download it now.
-
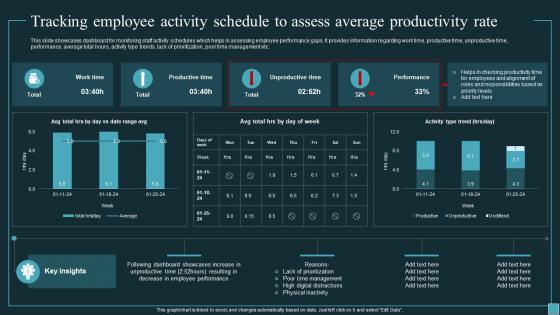 Implementing Workforce Analytics Tracking Employee Activity Schedule To Assess Average Data Analytics SS
This slide showcases dashboard for monitoring staff activity schedules which helps in assessing employee performance gaps. It provides information regarding work time, productive time, unproductive time, performance, average total hours, activity type trends, lack of prioritization, poor time management etc. Present the topic in a bit more detail with this Implementing Workforce Analytics Tracking Employee Activity Schedule To Assess Average Data Analytics SS. Use it as a tool for discussion and navigation on Tracking Employee Activity Schedule, Assess Average Productivity Rate, Lack Of Prioritization, Poor Time Management. This template is free to edit as deemed fit for your organization. Therefore download it now.
-
 Pinterest Marketing Analytics To Track Campaign Performance
This slide represents Pinterest analytics dashboard which assists to gain insights about followers and track pinterest success over time. It includes key components such as average impressions, average views, etc Introducing our Pinterest Marketing Analytics To Track Campaign Performance set of slides. The topics discussed in these slides are Average Monthly Views, Average Monthly Engagement, Average Impressions. This is an immediately available PowerPoint presentation that can be conveniently customized. Download it and convince your audience.
-
 Big Data Analytics Dashboard To Track Retail Performance Data Driven Insights Big Data Analytics SS V
This slide showcases dashboard for monitoring retail business performance which helps in improving revenue generation. It provides information regarding KPIs such as gross margin, sales, card abandonment rate, average unit price etc. Present the topic in a bit more detail with this Big Data Analytics Dashboard To Track Retail Performance Data Driven Insights Big Data Analytics SS V Use it as a tool for discussion and navigation on Big Data Analytics Dashboard, Track Retail Performance This template is free to edit as deemed fit for your organization. Therefore download it now.
-
 Data Analytics Dashboard To Track Hospital Performance Data Driven Insights Big Data Analytics SS V
This slide showcases dashboard for tracking hospitals activities which helps in improving performance efficiency. It provides information regarding bed occupancy rate, patient satisfaction rate, staff to patient ratio, room turnover etc. Deliver an outstanding presentation on the topic using this Data Analytics Dashboard To Track Hospital Performance Data Driven Insights Big Data Analytics SS V Dispense information and present a thorough explanation of Bed Occupancy Rates, Efficiency Costs, Satisfaction Service Indicators using the slides given. This template can be altered and personalized to fit your needs. It is also available for immediate download. So grab it now.
-
 Dashboard Tracking Augmented Analytics For Manufacturing Company
This slide showcases dashboard of augmented analytics. The main purpose of this template is to measure company efficiency after using augmented analytics. This includes casualty, revenue vs. cost of labour, product per unit, available operation, etc. Introducing our Dashboard Tracking Augmented Analytics For Manufacturing Company set of slides. The topics discussed in these slides are Manufacturing Company, Available Operators, Produced Unit By Line. This is an immediately available PowerPoint presentation that can be conveniently customized. Download it and convince your audience.
-
 Analyzing Patient Churn Rate To Track Definitive Guide To Implement Data Analytics SS
This slide showcases dashboard for assessing patient turnover rate which helps in improving patient engagement. It provides information regarding bed occupancy rate, average cost per patient, staff to patient ratio, existing patients, number of beds etc. Present the topic in a bit more detail with this Analyzing Patient Churn Rate To Track Definitive Guide To Implement Data Analytics SS. Use it as a tool for discussion and navigation on Occupancy, Opportunity, Organizations, Dashboard. This template is free to edit as deemed fit for your organization. Therefore download it now.
-
 Analyzing Patient Satisfaction Score To Track Definitive Guide To Implement Data Analytics SS
This slide showcases dashboard to track patient engagement rates during treatment and follow up care sessions. It includes elements such as average length of stay, lab tests, patient satisfaction, long wait times, treatment instructions etc. Present the topic in a bit more detail with this Analyzing Patient Satisfaction Score To Track Definitive Guide To Implement Data Analytics SS. Use it as a tool for discussion and navigation on Patients Metrics, Ineffective Communication, Dashboard. This template is free to edit as deemed fit for your organization. Therefore download it now.
-
 Healthcare Organization Performance Tracking Definitive Guide To Implement Data Analytics SS
This slide showcases dashboard for tracking hospitals revenue and expenditure which helps in improving performance efficiency. It provides information regarding length of stay, patient admission rate, average treatment cost, staff to patient ratio etc. Present the topic in a bit more detail with this Healthcare Organization Performance Tracking Definitive Guide To Implement Data Analytics SS. Use it as a tool for discussion and navigation on Trauma Units, Length Of Patient Stay, Patient Admission Rates, Rehabilitation Units. This template is free to edit as deemed fit for your organization. Therefore download it now.
-
 Prescriptive Dashboard To Track Website Sales Unlocking The Power Of Prescriptive Data Analytics SS
This slide illustrates a KPI dashboard highlighting application of prescriptive analytics to analyze website visits and sales. It covers KPIs such as monthly visitors, monthly sales, cash deposits, increase in subscribers and orders received. Present the topic in a bit more detail with this Prescriptive Dashboard To Track Website Sales Unlocking The Power Of Prescriptive Data Analytics SS. Use it as a tool for discussion and navigation on Monthly Visitors, Monthly Sales, Increase In Subscribers. This template is free to edit as deemed fit for your organization. Therefore download it now.
-
 Social Media Analytics Tracking Dashboard
This slide depicts the social media analytics dashboard for tracking which include social events, facebook shares, twitter retweets and social interactions. Presenting our well structured Social Media Analytics Tracking Dashboard. The topics discussed in this slide are Social Interactions, Social Events, Twitter Retweets. This is an instantly available PowerPoint presentation that can be edited conveniently. Download it right away and captivate your audience.
-
 Dashboard To Track Business Financial Performance Complete Guide To Business Analytics Data Analytics SS
This slide showcases dashboard illustrating company financial performance which helps in analyzing revenue growth and identifying gaps. It provide information regarding KPIs such as gross profit margin, opex ratio, earning before interest and taxes, vendor payment error rate etc. Present the topic in a bit more detail with this Dashboard To Track Business Financial Performance Complete Guide To Business Analytics Data Analytics SS. Use it as a tool for discussion and navigation on Dashboard To Track Business, Financial Performance, Post Strategy Implementation. This template is free to edit as deemed fit for your organization. Therefore download it now.
-
 Sales Performance Tracking Dashboard Post Strateg Complete Guide To Business Analytics Data Analytics SS
This slide showcases dashboard for monitoring sales department performance post implementing improvement strategies based on data insights. It provides information regarding revenue generated, current sales pipeline value, sales opportunities, new deals, sales growth by market segment etc. Deliver an outstanding presentation on the topic using this Sales Performance Tracking Dashboard Post Strateg Complete Guide To Business Analytics Data Analytics SS. Dispense information and present a thorough explanation of Sales Performance Tracking, Dashboard Post, Strategy Implementation, Sales Opportunities using the slides given. This template can be altered and personalized to fit your needs. It is also available for immediate download. So grab it now.
-
 Website Analytics Performance Tracking Dashboard Comprehensive E Commerce Website
The mentioned slide showcases a website performance tracking dashboard on the basis of certain metrics. It includes metrics such as conversions, users, conversion rate, and engagement rate Present the topic in a bit more detail with this Website Analytics Performance Tracking Dashboard Comprehensive E Commerce Website Use it as a tool for discussion and navigation on Conversion By Event Type, Conversion Rate, Engagement Rate This template is free to edit as deemed fit for your organization. Therefore download it now.
-
 Kpi Dashboard For Tracking Efficiency Of Spark Data Analytics
This slide showcases spark data analytics measuring KPI dashboard. This slide includes executors, executors memory usage, driver memory usage, total failed tasks, total completed tasks, max tasks on executor. Introducing our Kpi Dashboard For Tracking Efficiency Of Spark Data Analytics set of slides. The topics discussed in these slides are Dashboard, Efficiency, Data Analytics. This is an immediately available PowerPoint presentation that can be conveniently customized. Download it and convince your audience.
-
 Big Data Analytics Dashboard To Track Healthcare Performance
This slide covers integrating big data analytics to track current healthcare status. It involves details such as current bed occupancy rate, forecasted patient turnover, patient satisfaction and follow up rate. Presenting our well structured Big Data Analytics Dashboard To Track Healthcare Performance. The topics discussed in this slide are Current Occupancy Rate, Project Patient Turnover, Satisfaction Score. This is an instantly available PowerPoint presentation that can be edited conveniently. Download it right away and captivate your audience.
-
 Customer Engagement Tracking Dashboard Leveraging Digital Analytics To Develop Data Analytics SS
This slide showcases dashboard that is used to track user engagement for business website which helps in identifying profitable lead sources. It provides information regarding KPI metrics such as new visitors, return visitors, engagement, conversion, bounce rates, customer win per lead source etc. Deliver an outstanding presentation on the topic using this Customer Engagement Tracking Dashboard Leveraging Digital Analytics To Develop Data Analytics SS. Dispense information and present a thorough explanation of Conversion Rate, Engagement Rate, Return Visitor Information using the slides given. This template can be altered and personalized to fit your needs. It is also available for immediate download. So grab it now.
-
 Social Media Activity Tracking Dashboard Leveraging Digital Analytics To Develop Data Analytics SS
This slide showcases dashboard for tracking business social media activity which helps in enhancing brand visibility and marketing ROI. It provides information regarding KPI metrics such as social media followers, engaged users, page impressions, page likes, clicks, shares, favorites, retweets etc. Deliver an outstanding presentation on the topic using this Social Media Activity Tracking Dashboard Leveraging Digital Analytics To Develop Data Analytics SS. Dispense information and present a thorough explanation of Social Media Activity, Tracking Dashboard, Post Strategy Implementation using the slides given. This template can be altered and personalized to fit your needs. It is also available for immediate download. So grab it now.
-
 Icon To Track CRM Analytics Efficiency
Presenting our well structured Icon To Track CRM Analytics Efficiency. The topics discussed in this slide are Icon To Track CRM, Analytics Efficiency. This is an instantly available PowerPoint presentation that can be edited conveniently. Download it right away and captivate your audience.
-
 KPIs To Track Performance Of CRM Analytics
This slide highlights the major KPIs which can be used to track CRM analytics. The purpose of this template is to help the business manager in assessing CRM strategy performance in order to determine areas of improvement.Introducing our KPIs To Track Performance Of CRM Analytics set of slides. The topics discussed in these slides are Measuring Sales, Measuring Customer, Revenue Generation. This is an immediately available PowerPoint presentation that can be conveniently customized. Download it and convince your audience.
-
 Analyzing Marketing Attribution Marketing Analytics Software For Effective Data Tracking
This slide showcases comparison of marketing data analytics and dashboard software tools which helps in effective data reporting. It provides information regarding software, features, price, free trail and user ratings. Present the topic in a bit more detail with this Analyzing Marketing Attribution Marketing Analytics Software For Effective Data Tracking Use it as a tool for discussion and navigation on Data Platform Inputs, Consumer Attributes, Marketing Touchpoints This template is free to edit as deemed fit for your organization. Therefore download it now.
-
 KPIs To Track Big Data Analytics Efficiency
This slide highlights the various KPIs for evaluating the efficiency of the big data analytics process. The purpose of this slide is to help assess the effectiveness of big data analytics techniques and identify weaknesses to improve them. It includes KPIs such as the number of insights generated per month, accuracy of predictions made, number of models generated per month, etc.Presenting our well structured KPIs To Track Big Data Analytics Efficiency. The topics discussed in this slide are Insights Generated, Predications Made, Developed Per Month. This is an instantly available PowerPoint presentation that can be edited conveniently. Download it right away and captivate your audience.
-
 Real Time Analytics Icon For Tracking Budget
Introducing our premium set of slides with Real Time Analytics Icon For Tracking Budget. Ellicudate the three stages and present information using this PPT slide. This is a completely adaptable PowerPoint template design that can be used to interpret topics like Real Time Analytics, Tracking Budget. So download instantly and tailor it with your information.
-
 Real Time Analytics Icon For Tracking Sales
Presenting our set of slides with Real Time Analytics Icon For Tracking Sales. This exhibits information on three stages of the process. This is an easy to edit and innovatively designed PowerPoint template. So download immediately and highlight information on Real Time Analytics, Tracking Sales.
-
 Analytics Tracking Successful Blogging In Powerpoint And Google Slides Cpb
Presenting Analytics Tracking Successful Blogging In Powerpoint And Google Slides Cpb slide which is completely adaptable. The graphics in this PowerPoint slide showcase three stages that will help you succinctly convey the information. In addition, you can alternate the color, font size, font type, and shapes of this PPT layout according to your content. This PPT presentation can be accessed with Google Slides and is available in both standard screen and widescreen aspect ratios. It is also a useful set to elucidate topics like Analytics Tracking Successful Blogging. This well-structured design can be downloaded in different formats like PDF, JPG, and PNG. So, without any delay, click on the download button now.
-
 Wearable Sensors Use Of Data Analytics To Detect And Track Diseases
This slide represents the use of data analytics to detect and track diseases through sensors, such as accelerometers, gyroscopes, and pedometers. These detectors easily identify variations in sleeping patterns and body movements. Increase audience engagement and knowledge by dispensing information using Wearable Sensors Use Of Data Analytics To Detect And Track Diseases. This template helps you present information on six stages. You can also present information on Analytics, Accelerometers, Measured using this PPT design. This layout is completely editable so personaize it now to meet your audiences expectations.
-
 Agile Analytics Icon For Tracking Budget
Presenting our set of slides with Agile Analytics Icon For Tracking Budget. This exhibits information on three stages of the process. This is an easy to edit and innovatively designed PowerPoint template. So download immediately and highlight information on Agile Analytics Tracking Budget.
-
 Agile Analytics Icon For Tracking Sales
Introducing our premium set of slides with Agile Analytics Icon For Tracking Sales. Ellicudate the three stages and present information using this PPT slide. This is a completely adaptable PowerPoint template design that can be used to interpret topics like Agile Analytics Tracking Sales. So download instantly and tailor it with your information.
-
 Challenges In Tracking Digital Marketing Analytics
This slide focuses on mitigation strategies to resolve challenges in digital marketing analytics. It includes challenges such as missing marketing metrices, disorganized workflow, data scattering, etc. Presenting our set of slides with Challenges In Tracking Digital Marketing Analytics This exhibits information on two stages of the process. This is an easy to edit and innovatively designed PowerPoint template. So download immediately and highlight information on Marketing Metrics, Various Platforms, Data Correctly
-
 Social Media Analytics With Tools Best Practices Of Social Media Analytics Tracking
This slide represents the best practices of Social Media Analytics. The purpose of this slide is to outline the best practices of social media such as learning everything about the audience, measuring what matters, keeping an eye on competitors, etc. Increase audience engagement and knowledge by dispensing information using Social Media Analytics With Tools Best Practices Of Social Media Analytics Tracking. This template helps you present information on eight stages. You can also present information on Social Media Analytics, Eye On Competitors, Monitor Conversations, Social Media Analytics Tracking using this PPT design. This layout is completely editable so personaize it now to meet your audiences expectations.
-
 Social Media Analytics With Tools Checklist For Effective Social Media Analytics Tracking
This slide represents the checklist for Social Media Analytics tracking. The purpose of this slide is to highlight the key approaches of effective Social Media Analytics such as choosing the right metrics, set up analytics tools, etc. Present the topic in a bit more detail with this Social Media Analytics With Tools Checklist For Effective Social Media Analytics Tracking. Use it as a tool for discussion and navigation on Social Media Analytics Tracking, Analytics Tools, Google Analytics, Key Performance Indicators. This template is free to edit as deemed fit for your organization. Therefore download it now.
-
 Social Media Analytics With Tools Major Benefits Of Tracking Social Media Analytics
This slide represents the major benefits of tracking Social Media Analytics. The purpose of this slide is to highlight the benefits of Social Media Analytics such as trendspotting, brand sentiment, value perception, ROI, etc. Increase audience engagement and knowledge by dispensing information using Social Media Analytics With Tools Major Benefits Of Tracking Social Media Analytics. This template helps you present information on six stages. You can also present information on Setting Social Media Goals, Brand Sentiment, Value Perception, Trendspotting, Social Media Analytics using this PPT design. This layout is completely editable so personaize it now to meet your audiences expectations.
-
 Social Media Analytics With Tools Social Media Engagement Tracking Dashboard
This slide depicts the social media engagement metrics dashboard. The purpose of this slide is to outline the engagement metrics such as page engagement, post-key interaction, post-engagement type, etc. Deliver an outstanding presentation on the topic using this Social Media Analytics With Tools Social Media Engagement Tracking Dashboard. Dispense information and present a thorough explanation of Social Media Engagement, Tracking Dashboard, Post Key Interaction, Post Engagement Type using the slides given. This template can be altered and personalized to fit your needs. It is also available for immediate download. So grab it now.
-
 HR Analytics Icon To Track Employee Performance
Introducing our HR Analytics Icon To Track Employee Performance set of slides. The topics discussed in these slides are HR Analytics, Icon, Track Employee Performance. This is an immediately available PowerPoint presentation that can be conveniently customized. Download it and convince your audience.
-
 Tracking Procurement KPIs For Effective Supplier Analytics
This slide represents various procurement KPIs that assist companies in tracking supplier performance reducing risks for supply chain disruptions. It includes KPIs such as number of suppliers, supplier diversity, delivery time, supplier availability, etc. Presenting our well structured Tracking Procurement KPIs For Effective Supplier Analytics. The topics discussed in this slide are Suppliers Increased, Order Fulfillment. This is an instantly available PowerPoint presentation that can be edited conveniently. Download it right away and captivate your audience.
-
 A Comprehensive Guide Metrics To Track Implementation Of Advanced Analytics Data Analytics SS
This slide outlines list of major metrics aimed at helping businesses analyse activities regarding implementation. It covers metrics such as conversion rate, cost of client acquisition, retention rate, number of active users and revenue per user with description and impact Deliver an outstanding presentation on the topic using this A Comprehensive Guide Metrics To Track Implementation Of Advanced Analytics Data Analytics SS Dispense information and present a thorough explanation of Customer Retention, Revenue Per User using the slides given. This template can be altered and personalized to fit your needs. It is also available for immediate download. So grab it now.
-
 A Comprehensive Guide Step 3 Tracking Plan To Monitor Website Event Engagement Data Analytics SS
This slide provides a tracking plan aimed at helping business monitor customer engagement with website page. It covers heads such as event name, description, triggers and properties Deliver an outstanding presentation on the topic using this A Comprehensive Guide Step 3 Tracking Plan To Monitor Website Event Engagement Data Analytics SS Dispense information and present a thorough explanation of Description, Event Trigger, Event Properties using the slides given. This template can be altered and personalized to fit your needs. It is also available for immediate download. So grab it now.
-
 Key Metrics Used To Track Enhancing Business Insights Implementing Product Data Analytics SS V
This slide outlines major metrics used by businesses to analyse product performance aimed at making necessary improvements. It covers key metrics such as engagement, retention, customer lifetime value, number of crashes and feature adoption rate with benefits. Present the topic in a bit more detail with this Key Metrics Used To Track Enhancing Business Insights Implementing Product Data Analytics SS V. Use it as a tool for discussion and navigation on Key Drivers, Align Teams, Customer Retention. This template is free to edit as deemed fit for your organization. Therefore download it now.
-
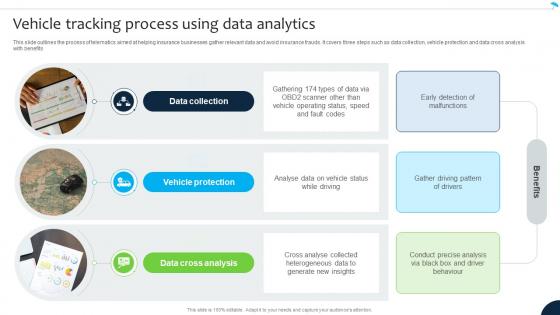 Vehicle Tracking Process Using Data Analytics Navigating The Future Of Insurance Data Analytics SS
This slide outlines the process of telematics aimed at helping insurance businesses gather relevant data and avoid insurance frauds. It covers three steps such as data collection, vehicle protection and data cross analysis with benefits. Increase audience engagement and knowledge by dispensing information using Vehicle Tracking Process Using Data Analytics Navigating The Future Of Insurance Data Analytics SS. This template helps you present information on three stages. You can also present information on Vehicle Protection, Data Cross Analysis, Data Collection using this PPT design. This layout is completely editable so personaize it now to meet your audiences expectations.
-
 Checklist To Track Business Analytics Training Success Data Visualization DTE SS
Deliver an outstanding presentation on the topic using this Checklist To Track Business Analytics Training Success Data Visualization DTE SS. Dispense information and present a thorough explanation of Curriculum Development, Data Analytics, Machine Learning using the slides given. This template can be altered and personalized to fit your needs. It is also available for immediate download. So grab it now.
-
 Icon Showcasing Asset Tracking Monitor Analytics
Presenting our set of slides with name Icon Showcasing Asset Tracking Monitor Analytics. This exhibits information on three stages of the process. This is an easy to edit and innovatively designed PowerPoint template. So download immediately and highlight information on Asset Tracking, Monitor Analytics.
-
 Analytics Tool 3 Rival IQ For Tracking Marketing Leveraging Digital Analytics To Develop Data Analytics SS
This slide showcases social media analytics tool which is used by business to analyze and identify top social content . It provides information regarding report exporting, multiple account tracking, follower data, competitive benchmarking etc. Deliver an outstanding presentation on the topic using this Analytics Tool 3 Rival IQ For Tracking Marketing Leveraging Digital Analytics To Develop Data Analytics SS. Dispense information and present a thorough explanation of Social Media Platforms, Competitive Benchmarking, Social Media Accounts using the slides given. This template can be altered and personalized to fit your needs. It is also available for immediate download. So grab it now.
-
 KPI Metrics To Track Customer Engagement Leveraging Digital Analytics To Develop Data Analytics SS
This slide highlights various engagement metrics which can be tracked to analyzing customer behavior and purchasing patterns . It provides information regarding bounce rate, page per visit, customer satisfaction score, time on site and average benchmarks. Increase audience engagement and knowledge by dispensing information using KPI Metrics To Track Customer Engagement Leveraging Digital Analytics To Develop Data Analytics SS. This template helps you present information on four stages. You can also present information on Bounce Rate, Page Per Visits, Customer Satisfaction Score using this PPT design. This layout is completely editable so personaize it now to meet your audiences expectations.
-
 Analytical CRM Software Key Indicators Tracked By Pipedrive Analytical CRM SA SS
The slide showcases major indicators tracked by analytical software which are monthly sales growth, customer acquisition cost, customer retention rate and lead conversion rate. Introducing Analytical CRM Software Key Indicators Tracked By Pipedrive Analytical CRM SA SS to increase your presentation threshold. Encompassed with Four stages, this template is a great option to educate and entice your audience. Dispence information on Monthly Sales Growth, Customer Acquisition Cost, Customer Retention Rate, Lead Conversion Rate, using this template. Grab it now to reap its full benefits.
-
 Analytical CRM Software Performance Tracking Indicators Assessed By Salesforce SA SS
The slide showcases KPIs measured by the software that are rep retention rate, new leads in pipeline, customer lifetime value and annual contract value. Introducing Analytical CRM Software Performance Tracking Indicators Assessed By Salesforce SA SS to increase your presentation threshold. Encompassed with Four stages, this template is a great option to educate and entice your audience. Dispence information on Rep Retention Rate, New Leads In Pipeline, Customer Lifetime Value, using this template. Grab it now to reap its full benefits.
-
 Tools For Inside Sales Team Call Tracking And Analytics Fostering Growth Through Inside SA SS
This slide showcases a comparison of sales call tracking tools to enhance outreach efforts, including key elements such as tools, features, pricing, and pros. Introducing Tools For Inside Sales Team Call Tracking And Analytics Fostering Growth Through Inside SA SS to increase your presentation threshold. Encompassed with Three stages, this template is a great option to educate and entice your audience. Dispence information on Features, Pricing, Pros using this template. Grab it now to reap its full benefits.
-
 Tracking Intelligence Infrastructure Activities Building Business Analytics Architecture
This slide portrays information regarding tracking essential activities in intelligence infrastructure dashboard in terms of IT operations, security, business analytics, internet of things, etc. Present the topic in a bit more detail with this Tracking Intelligence Infrastructure Activities Building Business Analytics Architecture. Use it as a tool for discussion and navigation on Security, IT Operations, Application Delivery, Business Analytics, Internet Of Things. This template is free to edit as deemed fit for your organization. Therefore download it now.


