Powerpoint Templates and Google slides for Total Sales Revenue
Save Your Time and attract your audience with our fully editable PPT Templates and Slides.
-
 Retail sales smartwatch market with total revenue by year ppt infographics samples
This slide depicts the smartwatch toy market details which includes growth in smartwatch market, accessible pocket money prices, revenue from different years, etc. Present the topic in a bit more detail with this Retail Sales Smartwatch Market With Total Revenue By Year Ppt Infographics Samples. Use it as a tool for discussion and navigation on Smartwatch Market With Total Revenue By Year. This template is free to edit as deemed fit for your organization. Therefore download it now.
-
 Annual Sales Review Dashboard With Total Revenue
This slide represent annual sales review dashboard of various products sold by an organization through various selling platform with comparison and product wise revenue generated .It includes product, unit sold and total revenue. Presenting our well structured Annual Sales Review Dashboard With Total Revenue. The topics discussed in this slide are Annual Sales Review, Dashboard, Revenue, Inventory. This is an instantly available PowerPoint presentation that can be edited conveniently. Download it right away and captivate your audience.
-
 QBR Dashboard Indicating Total Sales And Revenue
This slide shows quarterly business review dashboard highlighting total sales and revenue. It provides information about new customer, gross profit, customer satisfaction, profitability, etc. Presenting our well structured QBR Dashboard Indicating Total Sales And Revenue. The topics discussed in this slide are Revenue, New Customer, Gross Profit, Customer Satisfaction. This is an instantly available PowerPoint presentation that can be edited conveniently. Download it right away and captivate your audience.
-
 Sales waterfall showing total revenues and net profit
Presenting this set of slides with name - Sales Waterfall Showing Total Revenues And Net Profit. This is a eight stage process. The stages in this process are Sales Waterfall, Waterfall Chart.
-
 Total sales brands revenue and unsold stock e commerce dashboard
Presenting this set of slides with name - Total Sales Brands Revenue And Unsold Stock E Commerce Dashboard. This is a nine stage process. The stages in this process are Mercantilism, Commercialism, Ecommerce.
-
 6 Months Sales Budget With Total Revenue
This slide depicts 6 months budget of organization to evaluate total revenue on sales which determine profit made from specific product over certain period and overall performance. It include pointer such as unit sales, total revenue, cash sales, credit, total sales revenue and grand total. Introducing our 6 Months Sales Budget With Total Revenue set of slides. The topics discussed in these slides are Unit Sales, Unit Sale Price. This is an immediately available PowerPoint presentation that can be conveniently customized. Download it and convince your audience.
-
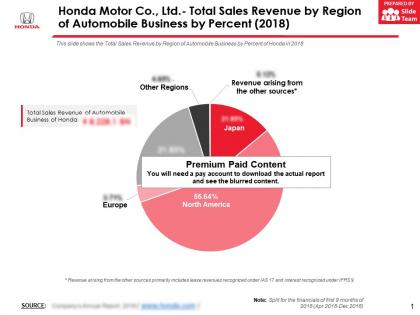
 Honda motor co ltd total sales revenue by region of automobile business by percent 2018
This is a professionally designed visual chart for Honda Motor Co Ltd Total Sales Revenue By Region Of Automobile Business By Percent 2018. This is part of our Data and Statistics products selection, and you will need a Paid account to download the actual report with accurate data and sources. Downloaded report will contain the editable graph with accurate data, an excel table with the actual data, the exact source of the data and the release date. This slide shows the Total Sales Revenue by Region of Automobile Business by Percent of Honda in 2018. Download it immediately and use it for your business.
-
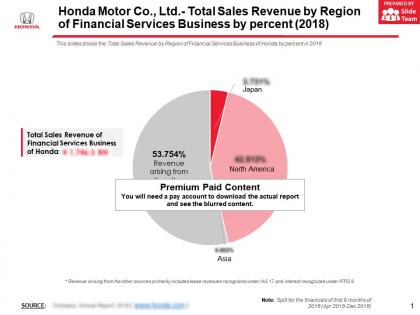
 Honda motor co ltd total sales revenue by region of financial services business by percent 2018
This is a professionally designed visual chart for Honda Motor Co Ltd Total Sales Revenue By Region Of Financial Services Business By Percent 2018. This is part of our Data and Statistics products selection, and you will need a Paid account to download the actual report with accurate data and sources. Downloaded report will contain the editable graph with accurate data, an excel table with the actual data, the exact source of the data and the release date. This slides shows the Total Sales Revenue by Region of Financial Services Business of Honda by percent in 2018. Download it immediately and use it for your business.
-
 Honda motor co ltd total sales revenue by region of motorcycle business by percent 2018
This is a professionally designed visual chart for Honda Motor Co Ltd Total Sales Revenue By Region Of Motorcycle Business By Percent 2018. This is part of our Data and Statistics products selection, and you will need a Paid account to download the actual report with accurate data and sources. Downloaded report will contain the editable graph with accurate data, an excel table with the actual data, the exact source of the data and the release date. This slide shows the Total Sales Revenue by Region of Motorcycle Business by percent of Honda in 2018. Download it immediately and use it for your business.
-
 Honda motor co ltd total sales revenue by region of power product and other businesses by percent 2018
This is a professionally designed visual chart for Honda Motor Co Ltd Total Sales Revenue By Region Of Power Product And Other Businesses By Percent 2018. This is part of our Data and Statistics products selection, and you will need a Paid account to download the actual report with accurate data and sources. Downloaded report will contain the editable graph with accurate data, an excel table with the actual data, the exact source of the data and the release date. This slide shows the Total Sales Revenue by Region of Power Product and Other Businesses by Percent of Honda in 2018. Download it immediately and use it for your business.
-
 Sales strategy summary total revenue ppt powerpoint presentation pictures graphics
Presenting this set of slides with name Sales Strategy Summary Total Revenue Ppt Powerpoint Presentation Pictures Graphics. The topics discussed in these slides are Sales Targets, Pipeline Targets, Revenue, Team, Profit Margin. This is a completely editable PowerPoint presentation and is available for immediate download. Download now and impress your audience.
-
 Split circular illustrating product sales contribution to total revenue
Introducing our premium set of slides with Split Circular Illustrating Product Sales Contribution To Total Revenue. Elucidate the five stages and present information using this PPT slide. This is a completely adaptable PowerPoint template design that can be used to interpret topics like Contribution, Product, Revenue. So download instantly and tailor it with your information.
-
 Total sales vs total revenue ppt powerpoint presentation model inspiration cpb
Presenting our Total Sales Vs Total Revenue Ppt Powerpoint Presentation Model Inspiration Cpb PowerPoint template design. This PowerPoint slide showcases four stages. It is useful to share insightful information on Total Sales Vs Total Revenue This PPT slide can be easily accessed in standard screen and widescreen aspect ratios. It is also available in various formats like PDF, PNG, and JPG. Not only this, the PowerPoint slideshow is completely editable and you can effortlessly modify the font size, font type, and shapes according to your wish. Our PPT layout is compatible with Google Slides as well, so download and edit it as per your knowledge.


