Powerpoint Templates and Google slides for Time revenue
Save Your Time and attract your audience with our fully editable PPT Templates and Slides.
-
 Time Optimization Process Business Distribution Revenue Growth
Introduce your topic and host expert discussion sessions with this Time Optimization Process Business Distribution Revenue Growth. This template is designed using high-quality visuals, images, graphics, etc, that can be used to showcase your expertise. Different topics can be tackled using the twelve slides included in this template. You can present each topic on a different slide to help your audience interpret the information more effectively. Apart from this, this PPT slideshow is available in two screen sizes, standard and widescreen making its delivery more impactful. This will not only help in presenting a birds-eye view of the topic but also keep your audience engaged. Since this PPT slideshow utilizes well-researched content, it induces strategic thinking and helps you convey your message in the best possible manner. The biggest feature of this design is that it comes with a host of editable features like color, font, background, etc. So, grab it now to deliver a unique presentation every time.
-
 Revenue Streams Real Time Editing App Funding Pitch Deck
Following slide showcases major sources through which company generate revenue. It includes elements such as in app purchases, sale of effects and features etc.Present the topic in a bit more detail with this Revenue Streams Real Time Editing App Funding Pitch Deck. Use it as a tool for discussion and navigation on Big Companies, Sale Additional Filters, License Application. This template is free to edit as deemed fit for your organization. Therefore download it now.
-
 Ideal Time To Cross Sell Cross Selling Strategies To Increase Organizational Revenue SA SS
This slide showcases that the best time to cross-sell products is prior, at the point and post-point of a sale. Present the topic in a bit more detail with this Ideal Time To Cross Sell Cross Selling Strategies To Increase Organizational Revenue SA SS. Use it as a tool for discussion and navigation on Computer Window, Sales, Bundle Of Items. This template is free to edit as deemed fit for your organization. Therefore download it now.
-
 Mixpanels monthly recurring revenue over time ppt powerpoint presentation portfolio infographic
The following slide provides information about the monthly recurring revenue of Mixpanel over time along with growth rate. Deliver an outstanding presentation on the topic using this Mixpanels Monthly Recurring Revenue Over Time Ppt Powerpoint Presentation Portfolio Infographic. Dispense information and present a thorough explanation of Mixpanels Monthly Recurring Revenue Over Time using the slides given. This template can be altered and personalized to fit your needs. It is also available for immediate download. So grab it now.
-
 Kpi for revenue spent budget spent legal dispute cycle time presentation slide
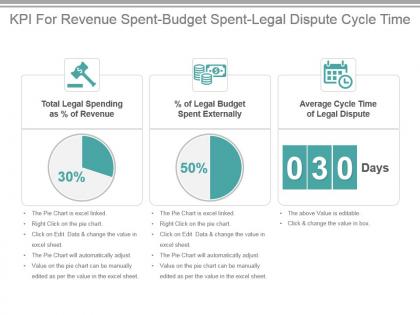
Presenting kpi for revenue spent budget spent legal dispute cycle time presentation slide. This presentation slide shows three Key Performance Indicators or KPIs in a Dashboard style design. The first KPI that can be shown is Total Legal Spending as percentage of Revenue. The second KPI is percentage of Legal Budget Spent Externally and the third is Average Cycle Time of Legal Dispute. These KPI Powerpoint graphics are all data driven,and the shape automatically adjusts according to your data. Just right click on the KPI graphic,enter the right value and the shape will adjust automatically. Make a visual impact with our KPI slides.
-
 Airline kpi for turnaround time average ticket prices freight revenue presentation slide
Presenting airline kpi for turnaround time average ticket prices freight revenue presentation slide. This presentation slide shows three Key Performance Indicators or KPIs in a Dashboard style design. The first KPI that can be shown is Turnaround Time. The second KPI is Average Ticket Prices and the third is Average Freight Revenue Per Ton Mile. These KPI Powerpoint graphics are all data driven, and the shape automatically adjusts according to your data. Just right click on the KPI graphic, enter the right value and the shape will adjust automatically. Make a visual impact with our KPI slides.
-
 Carrier kpi for on time departure revenue per seat lost luggage ppt slide
Presenting carrier kpi for on time departure revenue per seat lost luggage ppt slide. This presentation slide shows three Key Performance Indicators or KPIs in a Dashboard style design. The first KPI that can be shown is percentage of on Time Departure of Flights. The second KPI is Revenue Seat Passenger Kilometer RPK and the third is percentage of Lost Bags Luggage. These KPI Powerpoint graphics are all data driven, and the shape automatically adjusts according to your data. Just right click on the KPI graphic, enter the right value and the shape will adjust automatically. Make a visual impact with our KPI slides.
-
 Logistics dashboard with revenue breakdown and time to market
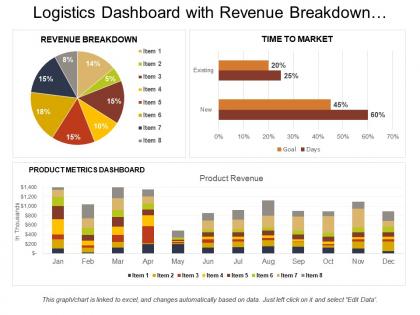
Presenting Logistics Dashboard With Revenue Breakdown And Time To Market PPT slide. The revenue breakdown dashboard PowerPoint template designed by the professional team of SlideTeam to present the entire plan to clients as well as investors. The bar chart, pie charts, text and image in time to market dashboard slide are customizable in PowerPoint and can help you in sharing the market sale target. The logistics performance dashboard slide is compatible with Google Slide which makes easy for a presenter to present business financial statistics. A user may do changes in the font size, font type, color and dimensions of the charts to present the desired sales value.
-
 Calculating value a startup company startup valuation financing cycle with revenue and time
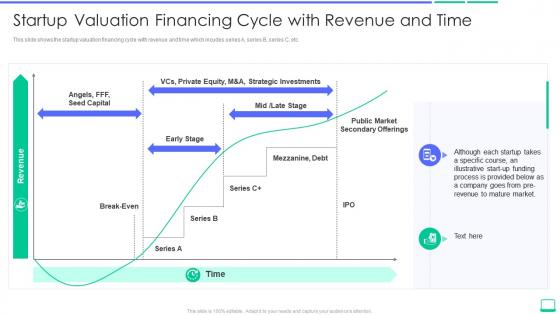
This slide shows the startup valuation financing cycle with revenue and time which incudes series A, series B, series C, etc. Increase audience engagement and knowledge by dispensing information using Calculating Value A Startup Company Startup Valuation Financing Cycle With Revenue And Time. This template helps you present information on three stages. You can also present information on Valuation, Financing, Revenue using this PPT design. This layout is completely editable so personaize it now to meet your audiences expectations.
-
 Times Revenue Method Ppt Powerpoint Presentation Infographic Deck Cpb
Presenting our Times Revenue Method Ppt Powerpoint Presentation Infographic Deck Cpb PowerPoint template design. This PowerPoint slide showcases four stages. It is useful to share insightful information on Times Revenue Method. This PPT slide can be easily accessed in standard screen and widescreen aspect ratios. It is also available in various formats like PDF, PNG, and JPG. Not only this, the PowerPoint slideshow is completely editable and you can effortlessly modify the font size, font type, and shapes according to your wish. Our PPT layout is compatible with Google Slides as well, so download and edit it as per your knowledge.
-
 Startup valuation financing cycle with revenue and time early stage investor value
This slide shows the startup valuation financing cycle with revenue and time which incudes series A, series B, series C, etc. Increase audience engagement and knowledge by dispensing information using Startup Valuation Financing Cycle With Revenue And Time Early Stage Investor Value. This template helps you present information on three stages. You can also present information on Early Stage, Break Even, Mid Or Late Stage using this PPT design. This layout is completely editable so personaize it now to meet your audiences expectations.
-
 Pre revenue startup valuation startup valuation financing cycle with revenue and time
This slide shows the startup valuation financing cycle with revenue and time which incudes series A, series B, series C, etc.Deliver an outstanding presentation on the topic using this Pre Revenue Startup Valuation Startup Valuation Financing Cycle With Revenue And Time Dispense information and present a thorough explanation of Public Market Secondary Offerings, Strategic Investments, Although Each Startup using the slides given. This template can be altered and personalized to fit your needs. It is also available for immediate download. So grab it now.
-
 Startup Business Valuation Methods Startup Valuation Financing Cycle With Revenue And Time
This slide shows the startup valuation financing cycle with revenue and time which incudes series A, series B, series C, etc. Introducing Startup Business Valuation Methods Startup Valuation Financing Cycle With Revenue And Time to increase your presentation threshold. Encompassed with one stages, this template is a great option to educate and entice your audience. Dispence information on Strategic Investments, Market, Capital, Revenue, using this template. Grab it now to reap its full benefits.
-
 Skills Gap Analysis With Revenue And Time
This slide shows the process of identifying skill gaps of a person or a group. This Skills Gap analysis template-based graphical structure with the x-axis mentioned as time and the y axis mentioned as revenue, and the other end has three stages of mark low, risk, and high. Introducing our premium set of slides with Skills Gap Analysis With Revenue And Time. Ellicudate the two stages and present information using this PPT slide. This is a completely adaptable PowerPoint template design that can be used to interpret topics like Revenue, Time, Potential Performance, Product Development. So download instantly and tailor it with your information.
-
 Time To Market Impacts On Revenue And Margin For Seasonal Product
The following slide highlights the time to market impacts on revenue and margin for seasonal product illustrating key takeaways and 4 month seasonal sale which includes sales vs time graph for two products describing loss of sale, margin and revenue for late entrant. Introducing our premium set of slides with Time To Market Impacts On Revenue And Margin For Seasonal Product. Ellicudate the two stages and present information using this PPT slide. This is a completely adaptable PowerPoint template design that can be used to interpret topics like Product 1 Sales, Product 2 Launch. So download instantly and tailor it with your information.
-
 Time To Market Relationship With Cost And Revenue
The following slide highlights the time to market relationship with cost and revenue illustrating graphical representation of shorter time to market and longer time to market impact on cost, revenue and market establishment. Presenting our well structured Time To Market Relationship With Cost And Revenue. The topics discussed in this slide are Shorter Time, Market Cost, Establish Market. This is an instantly available PowerPoint presentation that can be edited conveniently. Download it right away and captivate your audience.
-
 Times Revenue Valuation In Powerpoint And Google Slides Cpb
Presenting our Times Revenue Valuation In Powerpoint And Google Slides Cpb PowerPoint template design. This PowerPoint slide showcases four stages. It is useful to share insightful information on Times Revenue Valuation. This PPT slide can be easily accessed in standard screen and widescreen aspect ratios. It is also available in various formats like PDF, PNG, and JPG. Not only this, the PowerPoint slideshow is completely editable and you can effortlessly modify the font size, font type, and shapes according to your wish. Our PPT layout is compatible with Google Slides as well, so download and edit it as per your knowledge.
-
 Times Revenue Business In Powerpoint And Google Slides Cpb
Presenting our Times Revenue Business In Powerpoint And Google Slides Cpb PowerPoint template design. This PowerPoint slide showcases four stages. It is useful to share insightful information on Times Revenue Business This PPT slide can be easily accessed in standard screen and widescreen aspect ratios. It is also available in various formats like PDF, PNG, and JPG. Not only this, the PowerPoint slideshow is completely editable and you can effortlessly modify the font size, font type, and shapes according to your wish. Our PPT layout is compatible with Google Slides as well, so download and edit it as per your knowledge.
-
 Revenue work hour product development cycle time business strategy
Presenting this set of slides with name - Revenue Work Hour Product Development Cycle Time Business Strategy. This is an editable six stages graphic that deals with topics like Revenue Work Hour, Product Development Cycle Time, Business Strategy to help convey your message better graphically. This product is a premium product available for immediate download, and is 100 percent editable in Powerpoint. Download this now and use it in your presentations to impress your audience.
-
 Revenue per customer cycle time deliver delivery times
Presenting this set of slides with name - Revenue Per Customer Cycle Time Deliver Delivery Times. This is an editable six graphic that deals with topics like revenue per customer, cycle time deliver, delivery times to help convey your message better graphically. This product is a premium product available for immediate download, and is 100 percent editable in Powerpoint. Download this now and use it in your presentations to impress your audience.
-
 Company products revenue timing synergy diagram with icons
Presenting this set of slides with name - Company Products Revenue Timing Synergy Diagram With Icons. This is a five stage process. The stages in this process are Synergy Diagram, Teamwork, Unity.
-
 Summary points team leader cooperation revenue growth time saving
Presenting this set of slides with name - Summary Points Team Leader Cooperation Revenue Growth Time Saving. This is a five stage process. The stages in this process are Summary, Synopsis, Overview, Outline.
-
 Cash cow revenue profit growth time maturity
Presenting this set of slides with name - Cash Cow Revenue Profit Growth Time Maturity. This is a four stage process. The stages in this process are Cash Cow, Business Venture, Cash Flow.
-
 Learning curve showing sales time graph and revenue gap
Presenting this set of slides with name - Learning Curve Showing Sales Time Graph And Revenue Gap. This is a two stage process. The stages in this process are Experience Curve, Learning Curve.
-
 Innovation ambition matrix displaying time and profitability revenue
Presenting this set of slides with name - Innovation Ambition Matrix Displaying Time And Profitability Revenue. This is a one stage process. The stages in this process are Innovation Ambition Matrix, Innovation Management, Innovation Strategy.
-
 Time optimization for revenue growth icon
Introducing our Time Optimization For Revenue Growth Icon set of slides. The topics discussed in these slides are Time Optimization For Revenue Growth Icon. This is an immediately available PowerPoint presentation that can be conveniently customized. Download it and convince your audience.
-
 Times revenue method ppt powerpoint presentation infographic template layout ideas cpb
Presenting Times Revenue Method Ppt Powerpoint Presentation Infographic Template Layout Ideas Cpb slide which is completely adaptable. The graphics in this PowerPoint slide showcase eight stages that will help you succinctly convey the information. In addition, you can alternate the color, font size, font type, and shapes of this PPT layout according to your content. This PPT presentation can be accessed with Google Slides and is available in both standard screen and widescreen aspect ratios. It is also a useful set to elucidate topics like Times Revenue Method. This well-structured design can be downloaded in different formats like PDF, JPG, and PNG. So, without any delay, click on the download button now.


