Powerpoint Templates and Google slides for Statistics And Analytics
Save Your Time and attract your audience with our fully editable PPT Templates and Slides.
-
 Statistics Showing Why Women Are Not In Visionary And Analytical Thinking Strategy SS V
Present the topic in a bit more detail with this Statistics Showing Why Women Are Not In Visionary And Analytical Thinking Strategy SS V. Use it as a tool for discussion and navigation on Executive, Positions, Political. This template is free to edit as deemed fit for your organization. Therefore download it now.
-
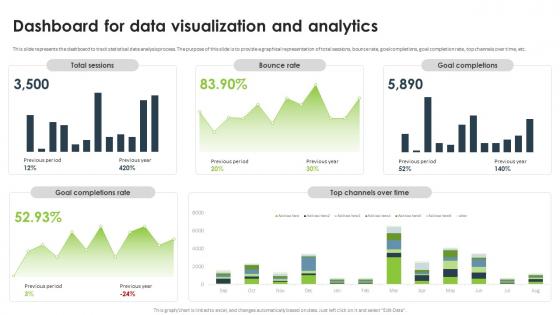
 Statistical Analysis For Data Driven Dashboard For Data Visualization And Analytics
This slide represents the dashboard to track statistical data analysis process. The purpose of this slide is to provide a graphical representation of total sessions, bounce rate, goal completions, goal completion rate, top channels over time, etc. Present the topic in a bit more detail with this Statistical Analysis For Data Driven Dashboard For Data Visualization And Analytics. Use it as a tool for discussion and navigation on Data Visualization And Analytics, Bounce Rate, Goal Completions, Goal Completion Rate. This template is free to edit as deemed fit for your organization. Therefore download it now.
-
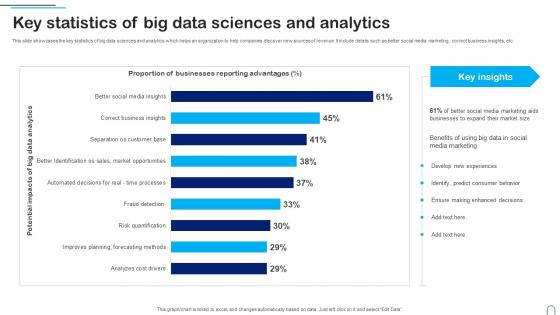
 Key Statistics Of Big Data Sciences And Analytics
This slide showcases the key statistics of big data sciences and analytics which helps an organization to help companies discover new sources of revenue. It include details such as better social media marketing, correct business insights, etc. Introducing our Key Statistics Of Big Data Sciences And Analytics set of slides. The topics discussed in these slides are Develop New Experiences, Predict Consumer Behavior, Ensure Making Enhanced Decisions. This is an immediately available PowerPoint presentation that can be conveniently customized. Download it and convince your audience.
-
 Statistics Highlighting And Monitoring Leveraging Data Analytics For Clinical Success Data Analytics SS
This slide outlines statistical graph highlighting importance of effective site selection and monitoring. It covers current situation of site selection and its impact on enrolment levels Present the topic in a bit more detail with this Statistics Highlighting And Monitoring Leveraging Data Analytics For Clinical Success Data Analytics SS. Use it as a tool for discussion and navigation on Monitoring, Statistics, Therapeutic Practices. This template is free to edit as deemed fit for your organization. Therefore download it now.
-
 Guide For Web And Digital Marketing Statistics Showing Rising Scope For Marketing Analytics MKT SS V
The following slide highlights key stats to understand growing demand for analytics and boosts marketing efforts. It includes elements such as evaluating campaign performances, gaining competitive edge, future projections, gaining higher profits, appropriating promotional budget etc. Introducing Guide For Web And Digital Marketing Statistics Showing Rising Scope For Marketing Analytics MKT SS V to increase your presentation threshold. Encompassed with Six stages, this template is a great option to educate and entice your audience. Dispence information on Performance Of Campaigns, Decision Making, Marketing Budget, using this template. Grab it now to reap its full benefits.
-
 Overview And Key Statistics Of Iot In Big Data Analytics Iot And Big Data Analytics
Following slide provides introduction of IoT and big data analytics that helps in effective decision making. It includes elements such as overview, objectives and key statistics. Increase audience engagement and knowledge by dispensing information using Overview And Key Statistics Of Iot In Big Data Analytics Iot And Big Data Analytics. This template helps you present information on two stages. You can also present information on Key Statistics, Analytics Market Is Estimated using this PPT design. This layout is completely editable so personaize it now to meet your audiences expectations.
-
 Key Industry Statistics Associated With Visionary And Analytical Thinking Strategy SS V
This slide provides glimpse about current industry statistics related to leadership and management that help business understand the changing environment. It includes facts about general leadership, women in leadership, leadership training, etc. Increase audience engagement and knowledge by dispensing information using Key Industry Statistics Associated With Visionary And Analytical Thinking Strategy SS V. This template helps you present information on four stages. You can also present information on General, Leadership, Statistics using this PPT design. This layout is completely editable so personaize it now to meet your audiences expectations.
-
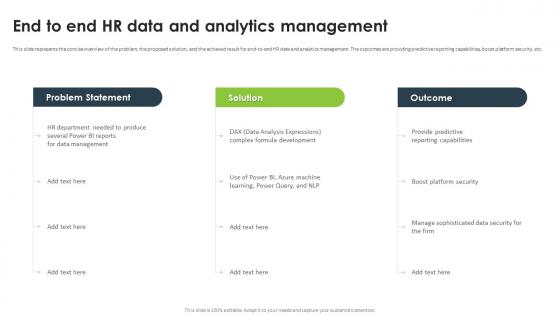
 Statistical Analysis For Data Driven End To End Hr Data And Analytics Management
This slide represents the concise overview of the problem, the proposed solution, and the achieved result for end-to-end HR data and analytics management. The outcomes are providing predictive reporting capabilities, boost platform security, etc. Deliver an outstanding presentation on the topic using this Statistical Analysis For Data Driven End To End HR Data And Analytics Management. Dispense information and present a thorough explanation of Predictive Reporting Capabilities, Data Analysis Expressions, Boost Platform Security using the slides given. This template can be altered and personalized to fit your needs. It is also available for immediate download. So grab it now.
-
 Statistics Analytics Sales In Powerpoint And Google Slides Cpb
Presenting our Statistics Analytics Sales In Powerpoint And Google Slides Cpb PowerPoint template design. This PowerPoint slide showcases five stages. It is useful to share insightful information on Statistics Analytics Sales This PPT slide can be easily accessed in standard screen and widescreen aspect ratios. It is also available in various formats like PDF, PNG, and JPG. Not only this, the PowerPoint slideshow is completely editable and you can effortlessly modify the font size, font type, and shapes according to your wish. Our PPT layout is compatible with Google Slides as well, so download and edit it as per your knowledge.
-
 Statistical Modeling Predictive Analytics Colored Icon In Powerpoint Pptx Png And Editable Eps Format
This colourful PowerPoint icon provides a visual representation of predictive analytics, a powerful tool used to identify trends and make predictions about future outcomes. Its ideal for presentations on business intelligence, data science and forecasting.
-
 Statistical Modeling Predictive Analytics Monotone Icon In Powerpoint Pptx Png And Editable Eps Format
This Monotone PowerPoint Icon is a great visual representation of Predictive Analytics. It features a graph-like image with a blue background and a white arrow pointing up, symbolizing the predictive power of data. Perfect for presentations on data analytics and forecasting.
-
 Mobile analytics showing social statistics and magnifying glass
Presenting this set of slides with name - Mobile Analytics Showing Social Statistics And Magnifying Glass. This is a three stage process. The stages in this process are Mobile Analytics, Mobile Tracking, Mobile Web Analytics.
-
 Predictive model of analytics showing variety of statistical techniques and other approaches
Presenting this set of slides with name - Predictive Model Of Analytics Showing Variety Of Statistical Techniques And Other Approaches. This is a four stage process. The stages in this process are Predictive Model, Predictive Framework, Predictive Structure.


