Powerpoint Templates and Google slides for Statistical Graph Illustrating
Save Your Time and attract your audience with our fully editable PPT Templates and Slides.
-
 Statistical Graph Illustrating Global Retail E Commerce Sales
This slide showcases the graphical presentations of worldwide retail E commerce sales which helps an organization to gain insights over meaningful data and ensures minimal downtime. It include details such as consumer satisfaction surveys, search engine optimization, targeted marketing, etc. Presenting our well structured Statistical Graph Illustrating Global Retail E Commerce Sales. The topics discussed in this slide are Expected, Satisfaction, Marketing. This is an instantly available PowerPoint presentation that can be edited conveniently. Download it right away and captivate your audience.
-
 Graph Illustrating Open Enrollment Communication Statistics
This slide showcases the chart representing open enrollment communication statistics which helps an organization to choose effective benefit plans that reduce and save their expenditure. It include details such as covers financial losses, protects family and changes lifestyle. Presenting our well structured Graph Illustrating Open Enrollment Communication Statistics. The topics discussed in this slide are Health Plans, Retirement Plans. This is an instantly available PowerPoint presentation that can be edited conveniently. Download it right away and captivate your audience.
-
 Statistical Graph Illustrating Automated Networking Operations
This slide showcases the statistical graph highlighting automated networking operations which helps an organization to improve scalability, security and reduce operational costs. It include details such as configuration generation, data collection, software updates, etc. Introducing our Statistical Graph Illustrating Automated Networking Operations set of slides. The topics discussed in these slides are Configuration Generation, Highest Automated Network Operations, Potential Benefits. This is an immediately available PowerPoint presentation that can be conveniently customized. Download it and convince your audience.
-
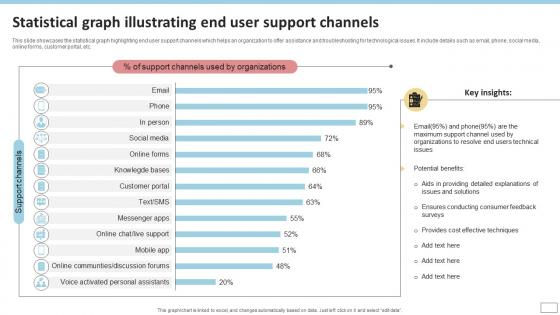
 Statistical Graph Illustrating End User Support Channels
This slide showcases the statistical graph highlighting end user support channels which helps an organization to offer assistance and troubleshooting for technological issues. It include details such as email, phone, social media, online forms, customer portal, etc. Introducing our Statistical Graph Illustrating End User Support Channels set of slides. The topics discussed in these slides are Statistical Graph Illustrating, End User Support Channels. This is an immediately available PowerPoint presentation that can be conveniently customized. Download it and convince your audience.
-
 Statistical Graph Illustrating Multivendor Key Market Players
This slide showcases the statistical graph highlighting multiple distributor key market players which helps an organization to understand market patterns for enhancing their business growth. It include detail such as employs customer focused approach, offers loyalty programs, etc. Introducing our Statistical Graph Illustrating Multivendor Key Market Players set of slides. The topics discussed in these slides are Introduces Constant Innovations, Offers Loyalty Programs, Employs Customer Focused Approach. This is an immediately available PowerPoint presentation that can be conveniently customized. Download it and convince your audience.
-
 Statistical Graph Illustrating Digital Transformation Impact Over Fintech
This slide showcases the statistical graph highlighting digital transformation impacts on financial services which helps an organization to improve and enhance operational efficiency. It include details such as open apis, advances analytics, cloud processing, etc. Presenting our well structured Statistical Graph Illustrating Digital Transformation Impact Over Fintech. The topics discussed in this slide are Digital Transformation Technology, Fintech Industries, Financial Data. This is an instantly available PowerPoint presentation that can be edited conveniently. Download it right away and captivate your audience.
-
 Statistical Graph Illustrating Building Enterprise Security Architecture
This slide showcases the statistical graph highlighting creating enterprise security architecture which helps an organization to create better,secure and safer environment. It include details such as enhances security support,improves team collaboration,etc. Introducing our Statistical Graph Illustrating Building Enterprise Security Architecture set of slides. The topics discussed in these slides are Devops Security,Building Securitys Success,Key Reasons. This is an immediately available PowerPoint presentation that can be conveniently customized. Download it and convince your audience.
-
 Statistical Graph Illustrating Reddit Marketing Channels
This slide showcases the statistical graph highlighting different reddit marketing channels which helps an organization to gain insights regarding best platform while making campaigns. It include details such as direct, referrals, organic search, social, mail, etc. Presenting our well structured Statistical Graph Illustrating Reddit Marketing Channels. The topics discussed in this slide are Statistical Graph Illustrating, Reddit Marketing Channels, Organic Search, Social. This is an instantly available PowerPoint presentation that can be edited conveniently. Download it right away and captivate your audience.
-
 Inbound Sales Icon Illustrating Statistical Graph
Presenting our set of slides with Inbound Sales Icon Showcasing Teamwork. This exhibits information on Three stages of the process. This is an easy to edit and innovatively designed PowerPoint template. So download immediately and highlight information on Inbound Sales Icon Showcasing Teamwork


