Powerpoint Templates and Google slides for Statistical Graph Highlighting
Save Your Time and attract your audience with our fully editable PPT Templates and Slides.
-
 Graph Highlighting AI Copilot Statistics
This slide showcases the graph illustrating artificial intelligence copilot statistics which helps an organization to unify enterprise systems and reduce operational costs. It include details such as enhances efficiency, improves smoother information flow, etc. Introducing our Graph Highlighting AI Copilot Statistics set of slides. The topics discussed in these slides are Graph Highlighting, Copilot Statistics This is an immediately available PowerPoint presentation that can be conveniently customized. Download it and convince your audience.
-
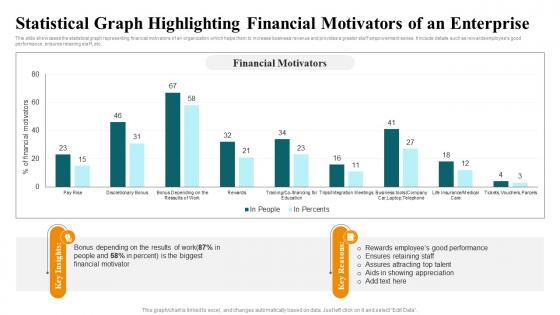
 Statistical Graph Highlighting Financial Motivators Of An Enterprise
This slide showcases the statistical graph representing financial motivators of an organization which helps them to increase business revenue and provides a greater staff empowerment sense. It include details such as rewards employees good performance, ensures retaining staff, etc. Introducing our Statistical Graph Highlighting Financial Motivators Of An Enterprise set of slides. The topics discussed in these slides are Financial Motivators, Key Insights, Key Reasons.This is an immediately available PowerPoint presentation that can be conveniently customized. Download it and convince your audience.
-
 Statistical Graph Highlighting Healthcare Adoption Of Blockchain
This slide showcases the statistical graph representing health industry adoption of blockchain which helps an organization to optimize supply chain and ensure drug traceability. It include details such as ensure strategic planning, assure technological innovation, etc. Introducing our Statistical Graph Highlighting Healthcare Adoption Of Blockchain set of slides. The topics discussed in these slides are Statistical Graph Highlighting, Healthcare Adoption Of Blockchain. This is an immediately available PowerPoint presentation that can be conveniently customized. Download it and convince your audience.
-
 Statistical Graph Highlighting Business Performance Product Bundling Strategies To Enhance
Mentioned slide displays company revenue and net profit over the years to determine and analyse current business situations. Present the topic in a bit more detail with this Statistical Graph Highlighting Business Performance Product Bundling Strategies To Enhance. Use it as a tool for discussion and navigation on Statistical Graph Highlighting, Business Performance, Current Business Situations. This template is free to edit as deemed fit for your organization. Therefore download it now.


