Powerpoint Templates and Google slides for Size Chart
Save Your Time and attract your audience with our fully editable PPT Templates and Slides.
-
 Organizational Chart For Medium And Large Size Hotel Training Ppt
Presenting Organizational Chart for Medium and Large Size Hotel. This PPT presentation is thoroughly researched and each slide consists of appropriate content. Designed by PowerPoint specialists, this PPT is fully customizablealter the colors, text, icons, and font size to meet your needs. Compatible with Google Slides and backed by superior customer support. Download today to deliver your presentation confidently.
-
 Luxury Goods Industry Report Charting Global Dimensions Market Size Insights IR SS
This slide focuses on charting global dimensions, providing insights into the market size of the luxury goods industry. The purpose is to offer a comprehensive understanding of the industrys scale, potential growth areas, and key factors influencing market size on a global scale. Present the topic in a bit more detail with this Luxury Goods Industry Report Charting Global Dimensions Market Size Insights IR SS. Use it as a tool for discussion and navigation on Charting Global Dimensions, Luxury Goods Industry, Potential Growth Areas. This template is free to edit as deemed fit for your organization. Therefore download it now.
-
 Food Delivery Business Plan Charting Global Dimensions Market Size Insights BP SS
This slide presents comprehensive insights into the market size of the global food delivery industry. The purpose is to provide a detailed overview of the industry dimensions, highlighting impact and providing a foundation for understanding the dynamics of the food delivery market on a global scale. Deliver an outstanding presentation on the topic using this Food Delivery Business Plan Charting Global Dimensions Market Size Insights BP SS. Dispense information and present a thorough explanation of Pandemic Influence, Tech Advancements, Growing Demand using the slides given. This template can be altered and personalized to fit your needs. It is also available for immediate download. So grab it now.
-
 Charting Global Dimensions Market Size Insights water and wastewater IR SS
This slide focuses on charting global dimensions, providing insights into the market size of the water and wastewater treatment industry. The purpose is to offer a comprehensive understanding of the industrys scale, growth opportunities and, key factors influencing market size on a global scale. Present the topic in a bit more detail with this Charting Global Dimensions Market Size Insights water and wastewater IR SS. Use it as a tool for discussion and navigation on Water And Wastewater, Market Size, 2022 To 2032. This template is free to edit as deemed fit for your organization. Therefore download it now.
-
 Charting Global Dimensions Market Size Insights Fashion And Apparel Industry Report IR SS
This slide focuses on charting global dimensions, providing insights into the market size of the fashion and apparel industry. The purpose is to offer a comprehensive understanding of the industrys scale and potential growth rate influencing market size on a global scale.Deliver an outstanding presentation on the topic using this Charting Global Dimensions Market Size Insights Fashion And Apparel Industry Report IR SS. Dispense information and present a thorough explanation of Market Size, Fastest Growing Market, Largest Market using the slides given. This template can be altered and personalized to fit your needs. It is also available for immediate download. So grab it now.
-
 Brand Comparison Chart With Market Size And Pricing Model
This slide illustrates comparative analysis of brands of XYZ product. It includes their market size, key features of these brands. Present the topic in a bit more detail with this Brand Comparison Chart With Market Size And Pricing Model. Use it as a tool for discussion and navigation on Market Size, Pricing Model, Competitive Pricing. This template is free to edit as deemed fit for your organization. Therefore download it now.
-
 Chart With Duration And Sample Size Clinical Trial Phases
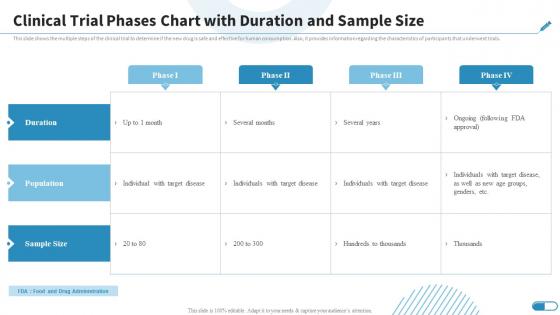
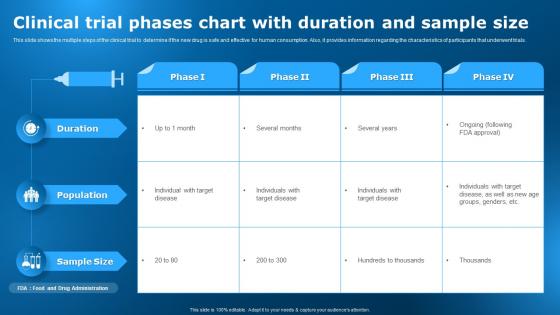
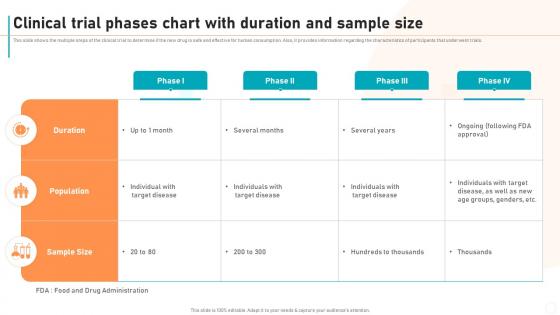
This slide shows the multiple steps of the clinical trial to determine if the new drug is safe and effective for human consumption. Also, it provides information regarding the characteristics of participants that underwent trials. Present the topic in a bit more detail with this Chart With Duration And Sample Size Clinical Trial Phases. Use it as a tool for discussion and navigation on Characteristics, Participants, Duration. This template is free to edit as deemed fit for your organization. Therefore download it now.
-
 Digital Marketing Team Chart For Medium Sized Companies
This slide covers organization chart for digital marketing team for medium scale enterprises. It includes key stakeholders such as director of marketing channels, digital marketing heads, SEO experts, content manager, social media manager, digital marketing analyst, digital channel agencies, etc. Presenting our set of slides with Digital Marketing Team Chart For Medium Sized Companies. This exhibits information on one stage of the process. This is an easy to edit and innovatively designed PowerPoint template. So download immediately and highlight information on Digital Marketing Head, Social Media Manger, Digital Marketing Analyst.
-
 Clinical Trial Phases Chart With Duration And Sample Size Research Design For Clinical Trials
This slide shows the multiple steps of the clinical trial to determine if the new drug is safe and effective for human consumption. Also, it provides information regarding the characteristics of participants that underwent trials. Deliver an outstanding presentation on the topic using this Clinical Trial Phases Chart With Duration And Sample Size Research Design For Clinical Trials. Dispense information and present a thorough explanation of Duration, Population, Sample Size using the slides given. This template can be altered and personalized to fit your needs. It is also available for immediate download. So grab it now.
-
 Clinical Trial Phases Chart With Duration And Sample Size Clinical Research Trial Stages
This slide shows the multiple steps of the clinical trial to determine if the new drug is safe and effective for human consumption. Also, it provides information regarding the characteristics of participants that underwent trials.Present the topic in a bit more detail with this Clinical Trial Phases Chart With Duration And Sample Size Clinical Research Trial Stages. Use it as a tool for discussion and navigation on Population, Duration, Sample Size. This template is free to edit as deemed fit for your organization. Therefore download it now.
-
 New Drug Development Process Clinical Trial Phases Chart With Duration And Sample Size
This slide shows the multiple steps of the clinical trial to determine if the new drug is safe and effective for human consumption. Also, it provides information regarding the characteristics of participants that underwent trials. Present the topic in a bit more detail with this New Drug Development Process Clinical Trial Phases Chart With Duration And Sample Size. Use it as a tool for discussion and navigation on Population, Characteristics, Consumption. This template is free to edit as deemed fit for your organization. Therefore download it now.
-
 Size Chart In Powerpoint And Google Slides Cpb
Presenting Size Chart In Powerpoint And Google Slides Cpb slide which is completely adaptable. The graphics in this PowerPoint slide showcase four stages that will help you succinctly convey the information. In addition, you can alternate the color, font size, font type, and shapes of this PPT layout according to your content. This PPT presentation can be accessed with Google Slides and is available in both standard screen and widescreen aspect ratios. It is also a useful set to elucidate topics like Size Chart. This well structured design can be downloaded in different formats like PDF, JPG, and PNG. So, without any delay, click on the download button now.
-
 Size Scale Chart In Powerpoint And Google Slides Cpb
Presenting Size Scale Chart In Powerpoint And Google Slides Cpb slide which is completely adaptable. The graphics in this PowerPoint slide showcase four stages that will help you succinctly convey the information. In addition, you can alternate the color, font size, font type, and shapes of this PPT layout according to your content. This PPT presentation can be accessed with Google Slides and is available in both standard screen and widescreen aspect ratios. It is also a useful set to elucidate topics like Size Scale Chart. This well-structured design can be downloaded in different formats like PDF, JPG, and PNG. So, without any delay, click on the download button now.
-
 Market size review chart powerpoint presentation
Presenting market size review chart powerpoint presentation. This is a market size review chart powerpoint presentation. This is a two stage process. The stages in this process are in team of users, in team of revenue from customers, we are planning to acquire users first and then paid customer, advertisers, event organizers, target market, mentors.
-
 Market size comparison line chart ppt slide
Presenting market size comparison line chart ppt slide. This is a market size comparison line chart ppt slide. This is a two stage process. The stages in this process are latin america, canada, japan, europe, asia pacific, us, rest of world.
-
 Company market size comparison chart ppt slide
Presenting company market size comparison chart ppt slide. This is a company market size comparison chart ppt slide. This is a two stage process. The stages in this process are business, success, strategy, finance, growth, success.
-
 Market size contains eight options data circular chart
Presenting this set of slides with name - Market Size Contains Eight Options Data Circular Chart. This is a eight stage process. The stages in this process are Market Size, Market Potential, Market Forecast.
-
 Overlapping circles five elements of different size showing pencil and pie chart
Presenting this set of slides with name - Overlapping Circles Five Elements Of Different Size Showing Pencil And Pie Chart. This is a five stage process. The stages in this process are Three Overlapping Circles, Three Interconnected Circle, Venn Diagram.
-
 Overlapping circles four elements of different size showing pencil and pie chart
Presenting this set of slides with name - Overlapping Circles Four Elements Of Different Size Showing Pencil And Pie Chart. This is a four stage process. The stages in this process are Three Overlapping Circles, Three Interconnected Circle, Venn Diagram.
-
 Overlapping circles seven elements of different size showing pencil and pie chart
Presenting this set of slides with name - Overlapping Circles Seven Elements Of Different Size Showing Pencil And Pie Chart. This is a seven stage process. The stages in this process are Three Overlapping Circles, Three Interconnected Circle, Venn Diagram.
-
 Overlapping circles six elements of different size showing pencil and pie chart
Presenting this set of slides with name - Overlapping Circles Six Elements Of Different Size Showing Pencil And Pie Chart. This is a six stage process. The stages in this process are Three Overlapping Circles, Three Interconnected Circle, Venn Diagram.
-
 Overlapping circles three elements of different size showing pencil and pie chart
Presenting this set of slides with name - Overlapping Circles Three Elements Of Different Size Showing Pencil And Pie Chart. This is a three stage process. The stages in this process are Three Overlapping Circles, Three Interconnected Circle, Venn Diagram.
-
 Pie chart icon of product sample size
Presenting this set of slides with name Pie Chart Icon Of Product Sample Size. This is a one stage process. The stages in this process are Pie Chart Icon, Employee Analysis, Financial Analysis. This is a completely editable PowerPoint presentation and is available for immediate download. Download now and impress your audience.
-
 Data driven 3d pie chart shows relative size of data powerpoint slides
We are proud to present our data driven 3d pie chart shows relative size of data powerpoint slides. Let Our Data Driven 3D Pie Chart Shows Relative Size Of Data Powerpoint Slides Power Point Templates Mark The Footprints Of Your Journey. Illustrate How They Will Lead You To Your Desired Destination. Conjure Up Grand Ideas With Our Magical Data Driven 3D Pie Chart Shows Relative Size Of Data Powerpoint Slides Power Point Templates. Leave Everyone Awestruck By The End Of Your Presentation.
-
 Market sizing template expected share ppt powerpoint presentation graph charts
Presenting this set of slides with name Market Sizing Template Expected Share Ppt Powerpoint Presentation Graph Charts. This is a four stage process. The stages in this process are Potential Market Opportunity, Total Addressable Market, Segment Addressable Market, Addressable Market. This is a completely editable PowerPoint presentation and is available for immediate download. Download now and impress your audience.
-
 Infrastructure market size globally chart ppt powerpoint presentation layouts graphics template
Presenting this set of slides with name Infrastructure Market Size Globally Chart Ppt Powerpoint Presentation Layouts Graphics Template. The topics discussed in these slides are Infrastructure Market Size Globally. This is a completely editable PowerPoint presentation and is available for immediate download. Download now and impress your audience.
-
 Market size icon with pie chart and trend line
Presenting our well structured Market Size Icon With Pie Chart And Trend Line. The topics discussed in this slide are Market Size, Icon Pie Chart, Trend Line. This is an instantly available PowerPoint presentation that can be edited conveniently. Download it right away and captivate your audience.
-
 Size Oriented Software Metrics Chart
This slide showcases the size oriented software metrics chart. Its purpose is to derive normal quality and productivity measures. This slide includes project name, effort, people involved and errors detected. Introducing our Size Oriented Software Metrics Chart set of slides. The topics discussed in these slides are Project Name, Metrics Chart, Defects Detected. This is an immediately available PowerPoint presentation that can be conveniently customized. Download it and convince your audience.


