Powerpoint Templates and Google slides for Shipping KPI
Save Your Time and attract your audience with our fully editable PPT Templates and Slides.
-
 Shipping KPI Powerpoint Ppt Template Bundles
If you require a professional template with great design, then this Shipping KPI Powerpoint Ppt Template Bundles is an ideal fit for you. Deploy it to enthrall your audience and increase your presentation threshold with the right graphics, images, and structure. Portray your ideas and vision using fourteen slides included in this complete deck. This template is suitable for expert discussion meetings presenting your views on the topic. With a variety of slides having the same thematic representation, this template can be regarded as a complete package. It employs some of the best design practices, so everything is well-structured. Not only this, it responds to all your needs and requirements by quickly adapting itself to the changes you make. This PPT slideshow is available for immediate download in PNG, JPG, and PDF formats, further enhancing its usability. Grab it by clicking the download button.
-
 Icon Showing E Commerce KPIs For Global Shipping
Introducing our Icon Showing E Commerce KPIs For Global Shipping set of slides. The topics discussed in these slides are Icon Showing E Commerce, Kpis For Global Shipping. This is an immediately available PowerPoint presentation that can be conveniently customized. Download it and convince your audience.
-
 Tracking Shipping Manufacturing KPIs Icon
Presenting our well structured Tracking Shipping Manufacturing KPIs Icon. The topics discussed in this slide are Tracking Shipping Manufacturing. This is an instantly available PowerPoint presentation that can be edited conveniently. Download it right away and captivate your audience.
-
 Inventory kpis dashboard snapshot with order rate and shipping time
Introducing our Inventory KPIS Dashboard Snapshot With Order Rate And Shipping Time set of slides. The topics discussed in these slides are Inventory KPIS Dashboard With Order Rate And Shipping Time. This is an immediately available PowerPoint presentation that can be conveniently customized. Download it and convince your audience.
-
 Inventory kpis dashboard with sales order and shipping backlog
Introducing our Inventory KPIS Dashboard With Sales Order And Shipping Backlog set of slides. The topics discussed in these slides are Sales, Customer, Product. This is an immediately available PowerPoint presentation that can be conveniently customized. Download it and convince your audience.
-
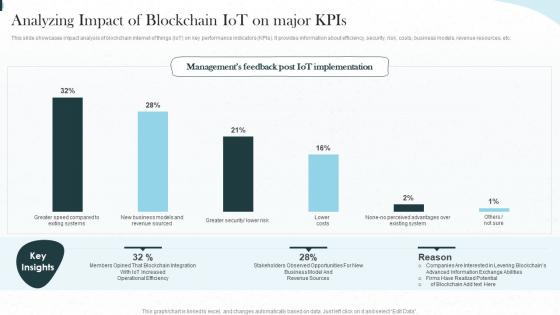 Implementing Iot Architecture In Shipping Business Analyzing Impact Of Blockchain Iot On Major Kpis
This slide showcases impact analysis of blockchain internet of things IoT on key performance indicators KPIs. It provides information about efficiency, security, risk, costs, business models, revenue resources, etc. Present the topic in a bit more detail with this Implementing Iot Architecture In Shipping Business Analyzing Impact Of Blockchain Iot On Major Kpis. Use it as a tool for discussion and navigation on Business, Revenue, Resources. This template is free to edit as deemed fit for your organization. Therefore download it now.
-
 Pareto Analysis Shipping KPI Dashboard
This slide showcases dashboard for analyzing on-time delivery trends. It also includes KPIs such as Pareto analysis and on-time deliveries by shipping organizations Presenting our well-structured Pareto Analysis Shipping KPI Dashboard. The topics discussed in this slide are Pareto Analysis Shipping, KPI Dashboard. This is an instantly available PowerPoint presentation that can be edited conveniently. Download it right away and captivate your audience.
-
 Shipping Delivery KPIs Analysis Dashboard
This template illustrates the KPI dashboard for tracking shipment orders. It also includes shipment analysis based on different KPIs such as ongoing delivery, completed delivery, on time delivery, actual delivery duration, and variance between expected and actual delivery time. Presenting our well-structured Shipping Delivery KPIs Analysis Dashboard. The topics discussed in this slide are Shipping Delivery, KPIS Analysis, Dashboard. This is an instantly available PowerPoint presentation that can be edited conveniently. Download it right away and captivate your audience.
-
 Shipping KPI Dashboard With Vessel Tracking
This slide covers a dashboard for analyzing vessel performance and fleet operations. It also includes KPIs such as the number of vessels operated, return on net assets, percentage of fleet deployed, vessel revenue, etc. Presenting our well-structured Shipping KPI Dashboard With Vessel Tracking. The topics discussed in this slide are Shipping KPI Dashboard, Vessel Tracking. This is an instantly available PowerPoint presentation that can be edited conveniently. Download it right away and captivate your audience.
-
 Shipping KPIs Dashboard For Tracking Shipment Delays
This slide represents a Dashboard for monitoring shipping KPIs and addressing delivery delay issues. It also includes order shipping details such as shipment id, origin states, destination, pay amount, profit, delay hrs. by company and shipper. Introducing our Shipping KPIs Dashboard For Tracking Shipment Delays set of slides. The topics discussed in these slides are Shipping Kpis, Dashboard, Tracking Shipment Delays. This is an immediately available PowerPoint presentation that can be conveniently customized. Download it and convince your audience.
-
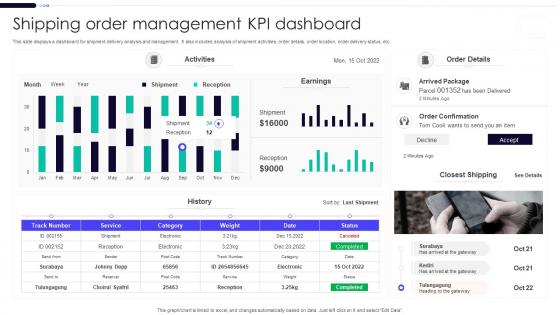 Shipping Order Management KPI Dashboard
This slide displays a dashboard for shipment delivery analysis and management. It also includes analysis of shipment activities, order details, order location, order delivery status, etc. Presenting our well-structured Shipping Order Management KPI Dashboard. The topics discussed in this slide are Shipping Order Management, KPI Dashboard. This is an instantly available PowerPoint presentation that can be edited conveniently. Download it right away and captivate your audience.
-
 Shipping Performance Analysis KPI Dashboard
This slide showcases the performance evaluation dashboard for top shipped items. It also includes shipping KPIs such as number of shipments, ongoing deliveries, complete deliveries, actual delivery duration, etc. Introducing our Shipping Performance Analysis KPI Dashboard set of slides. The topics discussed in these slides are Completed Deliveries, Actual Delivery Duration, On Going Deliveries, Shipments. This is an immediately available PowerPoint presentation that can be conveniently customized. Download it and convince your audience.
-
 KPI Dashboard To Assess Performance Of Drop Shipping Business
This slide covers KPI dashboard to evaluate overall performance of drop shipping business. It involves details such as total sales, ecommerce store sessions, returning customer rate. Introducing our KPI Dashboard To Assess Performance Of Drop Shipping Business set of slides. The topics discussed in these slides are Number Sales, Online Store Sessions, Returning Customer. This is an immediately available PowerPoint presentation that can be conveniently customized. Download it and convince your audience.
-
 Shipping Company Performance Comparison Dashboard With KPIS
This slide showcases shipping performance dashboard that can help to do the comparative assessment of different logistics companies. It also include KPIs such as shipments, completed deliveries, on time deliveries, on going deliveries average delivery duration etc. Presenting our well structured Shipping Company Performance Comparison Dashboard With KPIS. The topics discussed in this slide are Shipment Performance, Shipping Company, Performance Comparison. This is an instantly available PowerPoint presentation that can be edited conveniently. Download it right away and captivate your audience.
-
 Supply chain kpi for cycle cash time on time ship rate fill rate powerpoint slide
Presenting supply chain kpi for cycle cash time on time ship rate fill rate powerpoint slide. This presentation slide shows three Key Performance Indicators or KPIs in a Dashboard style design. The first KPI that can be shown is Cash To Cash Cycle Time. The second KPI is On Time Ship Rate and the third is Fill Rate. These KPI Powerpoint graphics are all data driven, and the shape automatically adjusts according to your data. Just right click on the KPI graphic, enter the right value and the shape will adjust automatically. Make a visual impact with our KPI slides.
-
 Carriage kpi for throughput damages olf undamaged goods after shipping ppt slide
Presenting carriage kpi for throughput damages olf undamaged goods after shipping ppt slide. This presentation slide shows three Key Performance Indicators or KPIs in a Dashboard style design. The first KPI that can be shown is Damages as percentage of Throughput. The second KPI is Optimize Load Fulfilment OLF percentage and the third is percentage of Undamaged Goods After Shipping Transportation. These KPI Powerpoint graphics are all data driven, and the shape automatically adjusts according to your data. Just right click on the KPI graphic, enter the right value and the shape will adjust automatically. Make a visual impact with our KPI slides.
-
 Kpi for ship maintenance time injured passengers handling operations powerpoint slide
Presenting kpi for ship maintenance time injured passengers handling operations powerpoint slide. This presentation slide shows two Key Performance Indicators or KPIs in a Dashboard style design. The first KPI that can be shown is Time of Ship Maintenance Vs Charter Time. The second KPI is percentage of Injured Passengers During Passenger Handling Operations. These KPI Powerpoint graphics are all data driven, and the shape automatically adjusts according to your data. Just right click on the KPI graphic, enter the right value and the shape will adjust automatically. Make a visual impact with our KPI slides.
-
 Kpi for shipping solutions lost cargo ratio employee non employee costs ppt slide
Presenting kpi for shipping solutions lost cargo ratio employee non employee costs ppt slide. This presentation slide shows three Key Performance Indicators or KPIs in a Dashboard style design. The first KPI that can be shown is percentage of Customized Shipping Solutions. The second KPI is percentage of Lost or Damaged Cargo During Sea Voyage and the third is Ratio Employee Costs Versus Non Employee Costs Per Ship. These KPI Powerpoint graphics are all data driven, and the shape automatically adjusts according to your data. Just right click on the KPI graphic, enter the right value and the shape will adjust automatically. Make a visual impact with our KPI slides.
-
 Ship kpi for average corrective preventive maintenance time powerpoint slide
Presenting ship kpi for average corrective preventive maintenance time powerpoint slide. This presentation slide shows three Key Performance Indicators or KPIs in a Dashboard style design. The first KPI that can be shown is Average Corrective Maintenance Time Per Ship. The second KPI is Average Preventive Maintenance Time Per Ship and the third is Ratio Corrective Versus Preventive Maintenance Time Per Ship. These KPI Powerpoint graphics are all data driven, and the shape automatically adjusts according to your data. Just right click on the KPI graphic, enter the right value and the shape will adjust automatically. Make a visual impact with our KPI slides.
-
 Ship kpi for injured passengers new cadets assigned to vessels ppt slide
Presenting ship kpi for injured passengers new cadets assigned to vessels ppt slide. This presentation slide shows two Key Performance Indicators or KPIs in a Dashboard style design. The first KPI that can be shown is percentage of Injured Passengers During Sea Voyage. The second KPI is percentage of New Cadets Assigned to Vessels. These KPI Powerpoint graphics are all data driven, and the shape automatically adjusts according to your data. Just right click on the KPI graphic, enter the right value and the shape will adjust automatically. Make a visual impact with our KPI slides.
-
 Ship kpi for turnaround time voyage deviation cargo damaged presentation slide
Presenting ship kpi for turnaround time voyage deviation cargo damaged presentation slide. This presentation slide shows three Key Performance Indicators or KPIs in a Dashboard style design. The first KPI that can be shown is Turnaround Time. The second KPI is percentage of Voyage Deviation and the third is percentage of Cargo Damaged or Lost During Cargo Operations. These KPI Powerpoint graphics are all data driven, and the shape automatically adjusts according to your data. Just right click on the KPI graphic, enter the right value and the shape will adjust automatically. Make a visual impact with our KPI slides.
-
 Shipping kpi for empty miles on time pickups freight bill accuracy powerpoint slide
Presenting shipping kpi for empty miles on time pickups freight bill accuracy powerpoint slide. This presentation slide shows three Key Performance Indicators or KPIs in a Dashboard style design. The first KPI that can be shown is Empty Miles. The second KPI is on Time Pickups and the third is Freight Bill Accuracy. These KPI Powerpoint graphics are all data driven, and the shape automatically adjusts according to your data. Just right click on the KPI graphic, enter the right value and the shape will adjust automatically. Make a visual impact with our KPI slides.
-
 Shipping kpi for maintenance costs time frequency of docking ppt slide
Presenting shipping kpi for maintenance costs time frequency of docking ppt slide. This presentation slide shows three Key Performance Indicators or KPIs in a Dashboard style design. The first KPI that can be shown is Average Maintenance Costs Per Ship. The second KPI is Average Maintenance Time Per Ship and the third is Frequency of Docking. These KPI Powerpoint graphics are all data driven, and the shape automatically adjusts according to your data. Just right click on the KPI graphic, enter the right value and the shape will adjust automatically. Make a visual impact with our KPI slides.
-
 Freight cost kpi for unit shipped damaged items pick up ppt slide
Presenting freight cost kpi for unit shipped damaged items pick up ppt slide. This presentation slide shows three Key Performance Indicators or KPIs in a Dashboard style design. The first KPI that can be shown is Freight Cost Per Unit Shipped. The second KPI is percentage of Orders Delivered with Damaged Products Items and the third is on Time Delivery and Pickup Load, Stop and Shipment. These KPI Powerpoint graphics are all data driven, and the shape automatically adjusts according to your data. Just right click on the KPI graphic, enter the right value and the shape will adjust automatically. Make a visual impact with our KPI slides.
-
 Shipment kpi for transportation cost shipped units lead time ppt slide
Presenting shipment kpi for transportation cost shipped units lead time ppt slide. This presentation slide shows three Key Performance Indicators or KPIs in a Dashboard style design. The first KPI that can be shown is Total Outbound Transportation Cost. The second KPI is Total Number of Outbound Transportation Kilograms and the third is Shipment Lead Time Accuracy. These KPI Powerpoint graphics are all data driven, and the shape automatically adjusts according to your data. Just right click on the KPI graphic, enter the right value and the shape will adjust automatically. Make a visual impact with our KPI slides.
-
 Vendor kpi dashboard showing order detail inventory and orders to ship today
Presenting this set of slides with name - Vendor Kpi Dashboard Showing Order Detail Inventory And Orders To Ship Today. This is a four stage process. The stages in this process are Vendor, Supplier, Retailer.
-
 Transportation kpi dashboard showing shipping revenue and outbound shipping costs
Presenting transportation KPI dashboard showing shipping revenue and outbound shipping costs PPT slide. Simple data input like company logo, name or trademark. User can edit the data in linked excel sheet and graphs and charts gets customized accordingly .This PPT slide offers you plenty of space to put in titles and sub titles. High resolution based presentation layout, does not change the image even after resizing. This presentation icon is data driven and template can be downloaded via excel file to incorporate data.
-
 Analyzing Impact Of Iot On Major Logistics Kpis Enabling Smart Shipping And Logistics Through Iot
The following slide showcases impact analysis of IoT on major logistics key performance indicators KPIs. It provides information about shipping time, order accuracy, average customer satisfaction rate, lead time, capacity utilization, etc. Present the topic in a bit more detail with this Analyzing Impact Of Iot On Major Logistics Kpis Enabling Smart Shipping And Logistics Through Iot. Use it as a tool for discussion and navigation on Analyzing, Management, Utilization. This template is free to edit as deemed fit for your organization. Therefore download it now.
-
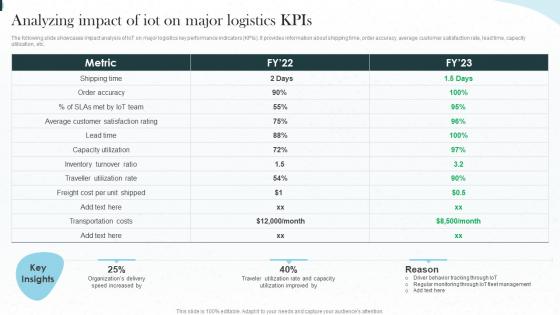 F591 Implementing Iot Architecture In Shipping Business Analyzing Impact Of Iot On Major Logistics Kpis
The following slide showcases impact analysis of IoT on major logistics key performance indicators KPIs. It provides information about shipping time, order accuracy, average customer satisfaction rate, lead time, capacity utilization, etc. Deliver an outstanding presentation on the topic using this F591 Implementing Iot Architecture In Shipping Business Analyzing Impact Of Iot On Major Logistics Kpis. Dispense information and present a thorough explanation of Analyzing, Performance, Indicators using the slides given. This template can be altered and personalized to fit your needs. It is also available for immediate download. So grab it now.
-
 Monthly Shipping And Inventory KPI Tracker
This slide displays the KPI tracker for identifying the shipment, inventory, and fleet maintenance status. It also includes KPIs such as on time delivery, on-time departure, inventory age, inventory cycle, etc. Introducing our Monthly Shipping And Inventory KPI Tracker set of slides. The topics discussed in these slides are Shipping, Inventory, Fleet Maintenance. This is an immediately available PowerPoint presentation that can be conveniently customized. Download it and convince your audience.
-
 On Time Delivery Shipping KPI Icon
Presenting our well-structured On Time Delivery Shipping KPI Icon. The topics discussed in this slide are On Time Delivery, Shipping KPI, Icon. This is an instantly available PowerPoint presentation that can be edited conveniently. Download it right away and captivate your audience.
-
 On Time Delivery Shipping KPI Report With Process Flowchart
This slide displays the order delivery chart for tracking average delivery duration and reasons for shipment delays. It also includes order details such as order ID, date of the order, delivery date, and key highlights of the delivery process. Introducing our On Time Delivery Shipping KPI Report With Process Flowchart set of slides. The topics discussed in these slides are Order Received, Order Accepted, Begin Production, Production Process, Dispatched. This is an immediately available PowerPoint presentation that can be conveniently customized. Download it and convince your audience.
-
 Primary And Secondary Shipping KPI Profile
This slide covers the KPI profile for defining measures to evaluate KPI performance. It also includes the details for enlisted KPIs such as ID, name, value, unit and rating. Introducing our Primary And Secondary Shipping KPI Profile set of slides. The topics discussed in these slides are Primary Secondary Shipping, KPI Profile. This is an immediately available PowerPoint presentation that can be conveniently customized. Download it and convince your audience.
-
 Shipping Error Rate KPI Tracker
This slide illustrates an order tracker to determine shipment delivery rate error. It also includes the details such as order id, shipping date, delivery status, etc. Introducing our Shipping Error Rate KPI Tracker set of slides. The topics discussed in these slides are Shipping Error Rate, KPI Tracker. This is an immediately available PowerPoint presentation that can be conveniently customized. Download it and convince your audience.
-
 Shipping KPI Icon For Tracking Order Delivery Delays
Introducing our premium set of slides with Shipping KPI Icon For Tracking Order Delivery Delays. Elucidate the three stages and present information using this PPT slide. This is a completely adaptable PowerPoint template design that can be used to interpret topics like Shipping KPI, Icon, Tracking, Order Delivery Delays. So download instantly and tailor it with your information.
-
 Cycle time kpi for pick to ship supplier delivery ppt slide
Presenting cycle time kpi for pick to ship supplier delivery ppt slide. This presentation slide shows Two Key Performance Indicators or KPIs in a Dashboard style design. The first KPI that can be shown is Customer Order Pick to Ship Cycle Time. The second KPI is Supplier Delivery Dock to Stock Cycle Time. These KPI Powerpoint graphics are all data driven, and the shape automatically adjusts according to your data. Just right click on the KPI graphic, enter the right value and the shape will adjust automatically. Make a visual impact with our KPI slides.
-
 Cargo kpi for direct cost corrective preventive maintenance per ship powerpoint slide
Presenting cargo kpi for direct cost corrective preventive maintenance per ship powerpoint slide. This presentation slide shows three Key Performance Indicators or KPIs in a Dashboard style design. The first KPI that can be shown is Average Direct Costs Per Ship. The second KPI is Average Corrective Maintenance Costs Per Ship and the third is Average Preventive Maintenance Costs Per Ship. These KPI Powerpoint graphics are all data driven, and the shape automatically adjusts according to your data. Just right click on the KPI graphic, enter the right value and the shape will adjust automatically. Make a visual impact with our KPI slides.
-
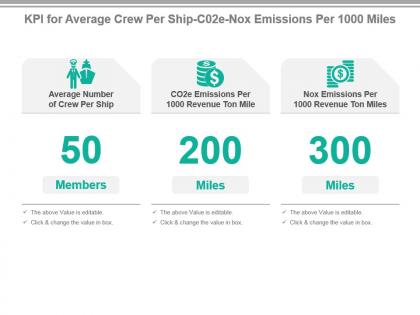 Kpi for average crew per ship c02e nox emissions per 1000 miles ppt slide
Presenting kpi for average crew per ship c02e nox emissions per 1000 miles ppt slide. This presentation slide shows three Key Performance Indicators or KPIs in a Dashboard style design. The first KPI that can be shown is Average Number of Crew Per Ship. The second KPI is CO2e Emissions Per 1000 Revenue Ton Mile and the third is Nox Emissions Per 1000 Revenue Ton Miles. These KPI Powerpoint graphics are all data driven, and the shape automatically adjusts according to your data. Just right click on the KPI graphic, enter the right value and the shape will adjust automatically. Make a visual impact with our KPI slides.
-
 Kpi for profit total costs fixed costs per ship ppt slide
Presenting kpi for profit total costs fixed costs per ship ppt slide. This presentation slide shows three Key Performance Indicators or KPIs in a Dashboard style design. The first KPI that can be shown is Profit Per Ship. The second KPI is Average Total Costs Per Ship and the third is Average Fixed Costs Per Ship. These KPI Powerpoint graphics are all data driven, and the shape automatically adjusts according to your data. Just right click on the KPI graphic, enter the right value and the shape will adjust automatically. Make a visual impact with our KPI slides.
-
 Shipping kpi for variable employee non employee costs per ship presentation slide
Presenting shipping kpi for variable employee non employee costs per ship presentation slide. This presentation slide shows three Key Performance Indicators or KPIs in a Dashboard style design. The first KPI that can be shown is Average Variable Costs Per Ship. The second KPI is Average Employee Costs Per Ship and the third is Average Non Employee Costs Per Ship. These KPI Powerpoint graphics are all data driven, and the shape automatically adjusts according to your data. Just right click on the KPI graphic, enter the right value and the shape will adjust automatically. Make a visual impact with our KPI slides.
-
 Warehouse kpis shipping receiving storage order picking accuracy
Presenting this set of slides with name - Warehouse Kpis Shipping Receiving Storage Order Picking Accuracy. This is a four stage process. The stages in this process are Warehouse Kpi, Warehouse Dashboard, Warehouse Metrics.


