Powerpoint Templates and Google slides for Segment Statistics
Save Your Time and attract your audience with our fully editable PPT Templates and Slides.
-
 Four stage funnel revenue success analysis segment statistics plan
Deliver a lucid presentation by utilizing this Four Stage Funnel Revenue Success Analysis Segment Statistics Plan. Use it to present an overview of the topic with the right visuals, themes, shapes, and graphics. This is an expertly designed complete deck that reinforces positive thoughts and actions. Use it to provide visual cues to your audience and help them make informed decisions. A wide variety of discussion topics can be covered with this creative bundle such as Four Stage Funnel, Revenue, Success, Analysis, Segment. All the twelve slides are available for immediate download and use. They can be edited and modified to add a personal touch to the presentation. This helps in creating a unique presentation every time. Not only that, with a host of editable features, this presentation can be used by any industry or business vertical depending on their needs and requirements. The compatibility with Google Slides is another feature to look out for in the PPT slideshow.
-
 Statistics Highlighting IoT Agriculture Market Segment
This template highlights the market segments of smart farming. The purpose of this slide is to measure the growth rate of the upcoming year using IoT technology to enhance productivity, quality , etc.Introducing our Statistics Highlighting IoT Agriculture Market Segment set of slides. The topics discussed in these slides are Utilizing Smart, Approaches Save, Smart Farming. This is an immediately available PowerPoint presentation that can be conveniently customized. Download it and convince your audience.
-
 Statistics Highlight Gerontechnology In Various Segments
The slide shows statistics on the use of gerontechnology in various segments, with the highest adoption in housing and living technology. Reasons for growth in communication technology to enable remote consultation and health monitoring.Presenting our well structured Statistics Highlight Gerontechnology In Various Segments. The topics discussed in this slide are Health Monitoring, Facilitating Social Interactions, Communication Technology. This is an instantly available PowerPoint presentation that can be edited conveniently. Download it right away and captivate your audience.
-
 Statistics Highlighting Genomics Market Segmentation
The purpose of this slide is to provide valuable insights to communicate to stakeholders about diverse landscape of genomics industry. It covers elements such as designation, region, respondent, etc. Introducing our Statistics Highlighting Genomics Market Segmentation set of slides. The topics discussed in these slides are Biological Sciences, Eurofins Scientific, Market Segmentation This is an immediately available PowerPoint presentation that can be conveniently customized. Download it and convince your audience.
-
 Brand Development Guide Segment Wise Revenue Generation Statistics
Following slide shows segment wise revenue generation statistics. Segments covered are processed food, beverages, personal care, hair care and baby care. Deliver an outstanding presentation on the topic using this Brand Development Guide Segment Wise Revenue Generation Statistics. Dispense information and present a thorough explanation of Personal Care, Beverages, Processed Food, Revenue Generation, Statistics using the slides given. This template can be altered and personalized to fit your needs. It is also available for immediate download. So grab it now.
-
 Segment wise revenue generation statistics effective brand building strategy
Following slide shows segment wise revenue generation statistics. Segments covered are processed food, beverages, personal care, hair care and baby care. Deliver an outstanding presentation on the topic using this Segment Wise Revenue Generation Statistics Effective Brand Building Strategy. Dispense information and present a thorough explanation of Segment Wise Revenue Generation Statistics using the slides given. This template can be altered and personalized to fit your needs. It is also available for immediate download. So grab it now.
-
 Key statistics about sales deals improving planning segmentation ppt infographics
Mentioned slide displays keys statistics about companys sales deals. Statistics covered are related to qualified leads, lead generation and conversion. Present the topic in a bit more detail with this Key Statistics About Sales Deals Improving Planning Segmentation Ppt Infographics. Use it as a tool for discussion and navigation on Key Statistics About Sales Deals. This template is free to edit as deemed fit for your organization. Therefore download it now.
-
 Brand Strategy Framework Segment Wise Revenue Generation Statistics
Following slide shows segment wise revenue generation statistics. Segments covered are processed food, beverages, personal care, hair care and baby care. Present the topic in a bit more detail with this Brand Strategy Framework Segment Wise Revenue Generation Statistics. Use it as a tool for discussion and navigation on Segment Wise Revenue Generation Statistics. This template is free to edit as deemed fit for your organization. Therefore download it now.
-
 Segmentation Infographic With Key Statistics Marketing Best Practice Tools And Templates
Mentioned slide displays segmentation infographic along with key statistics. Firms can utilize this slide to segment their potential target customers. Present the topic in a bit more detail with this Segmentation Infographic With Key Statistics Marketing Best Practice Tools And Templates. Use it as a tool for discussion and navigation on Segmentation Infographic With Key Statistics. This template is free to edit as deemed fit for your organization. Therefore download it now.
-
 Key Statistics Showing RPA Management In Different Segments
This template shows the Key statistics illustrating RPA management in various segments. The purpose of this slide to bifurcated on the segments for easy evaluation . It includes major such as company, designation, geography, etc. Introducing our Key Statistics Showing RPA Management In Different Segments set of slides. The topics discussed in these slides are By Company Type, By Designation, By Geography. This is an immediately available PowerPoint presentation that can be conveniently customized. Download it and convince your audience.
-
 Customer Segmentation Key Statistics Highlights Developing Marketing And Promotional MKT SS V
This slide presents statistics showing impact of appropriate customer segmentation and profiling on organization. It highlights information about customer churn rate, sales revenue, customer experience, targeting and positioning, recurring revenue, distribution channel, price optimization, brand awareness, etc. Present the topic in a bit more detail with this Customer Segmentation Key Statistics Highlights Developing Marketing And Promotional MKT SS V. Use it as a tool for discussion and navigation on Price Optimization, Brand Awareness, Customer Experience. This template is free to edit as deemed fit for your organization. Therefore download it now.
-
 Data Driven Customer Segmentation Statistics With Action Plan
Following slide brings forth the major data driven statistics to be used by managers for effective segmentation and targeting the audience. The statistics are related to return on investment, click through rate, sales, customer purchase rate and brand message. Presenting our set of slides with name Data Driven Customer Segmentation Statistics With Action Plan. This exhibits information on five stages of the process. This is an easy to edit and innovatively designed PowerPoint template. So download immediately and highlight information on Return On Investment, Customer Purchase Rate, Brand Message.
-
 Customer Segmentation Key Statistics Highlights Target Audience Analysis Guide To Develop MKT SS V
This slide presents statistics showing impact of appropriate customer segmentation and profiling on organization. It highlights information about customer churn rate, sales revenue, customer experience, targeting and positioning, recurring revenue, distribution channel, price optimization, brand awareness, etc. Deliver an outstanding presentation on the topic using this Customer Segmentation Key Statistics Highlights Target Audience Analysis Guide To Develop MKT SS V. Dispense information and present a thorough explanation of Reduction In Customer Churn Rate, Better Price Optimization using the slides given. This template can be altered and personalized to fit your needs. It is also available for immediate download. So grab it now.
-
 Guide For User Segmentation Customer Segmentation Key Statistics Highlights MKT SS V
This slide presents statistics showing impact of appropriate customer segmentation and profiling on organization. It highlights information about customer churn rate, sales revenue, customer experience, targeting and positioning, recurring revenue, distribution channel, price optimization, brand awareness, etc. Introducing Guide For User Segmentation Customer Segmentation Key Statistics Highlights MKT SS V to increase your presentation threshold. Encompassed with nine stages, this template is a great option to educate and entice your audience. Dispence information on Reduction In Customer, Targeting And Positioning, Increase In Sales Revenue, using this template. Grab it now to reap its full benefits.
-
 Target Market Grouping Customer Segmentation Key Statistics Highlights MKT SS V
This slide presents statistics showing impact of appropriate customer segmentation and profiling on organization. It highlights information about customer churn rate, sales revenue, customer experience, targeting and positioning, recurring revenue, distribution channel, price optimization, brand awareness, etc. Introducing Target Market Grouping Customer Segmentation Key Statistics Highlights MKT SS V to increase your presentation threshold. Encompassed with nine stages, this template is a great option to educate and entice your audience. Dispence information on Reduction Customer Churn Rate, Increase In Sales Revenue, using this template. Grab it now to reap its full benefits.
-
 Customer Segmentation Key Statistics Highlights MKT SS V
This slide presents statistics showing impact of appropriate customer segmentation and profiling on organization. It highlights information about customer churn rate, sales revenue, customer experience, targeting and positioning, recurring revenue, distribution channel, price optimization, brand awareness, etc. Increase audience engagement and knowledge by dispensing information using Customer Segmentation Key Statistics Highlights MKT SS V This template helps you present information on Nine stages. You can also present information on Churn Rate, Price Optimization, Recurring Revenue using this PPT design. This layout is completely editable so personaize it now to meet your audiences expectations.
-
 Customer Segmentation Key Statistics Highlights Strategic Guide For Market MKT SS V
This slide presents statistics showing impact of appropriate customer segmentation and profiling on organization. It highlights information about customer churn rate, sales revenue, customer experience, targeting positioning, recurring revenue, distribution channel, price optimization, brand awareness, etc.Increase audience engagement and knowledge by dispensing information using Customer Segmentation Key Statistics Highlights Strategic Guide For Market MKT SS V. This template helps you present information on one stage. You can also present information on Reduction Customer, Better Price Optimization, Increase Recurring Revenue using this PPT design. This layout is completely editable so personaize it now to meet your audiences expectations.
-
 Statistical Brief For Social Media Consumer Segments
This slide showcases statistics regarding social media consumer segments which helps in tracking social media adoption rate. It provides information regarding no. of active users, daily time spent, social media platforms, male users, female users etc. Presenting our set of slides with Statistical Brief For Social Media Consumer Segments. This exhibits information on ten stages of the process. This is an easy to edit and innovatively designed PowerPoint template. So download immediately and highlight information on Quarterly Change, Social Media Users, Platforms Used.
-
 Population demographics statistical segmentation and analysis
Presenting this set of slides with name - Population Demographics Statistical Segmentation And Analysis. This is a five stage process. The stages in this process are Population, Demographics, People Growth.
-
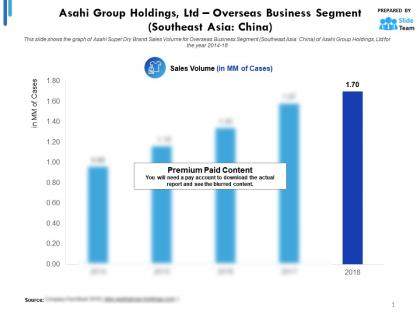 Asahi group holdings ltd statistic 1 overseas business segment southeast asia china
This is a professionally designed visual chart for Asahi Group Holdings Ltd Statistic 1 Overseas Business Segment Southeast Asia China. This is part of our Data and Statistics products selection, and you will need a Paid account to download the actual report with accurate data and sources. Downloaded report will contain the editable graph with accurate data, an excel table with the actual data, the exact source of the data and the release date. This slide shows the graph of Asahi Super Dry Brand Sales Volume for Overseas Business Segment Southeast Asia, China of Asahi Group Holdings, Ltd for the year 2014 to 18. Download it immediately and use it for your business.
-
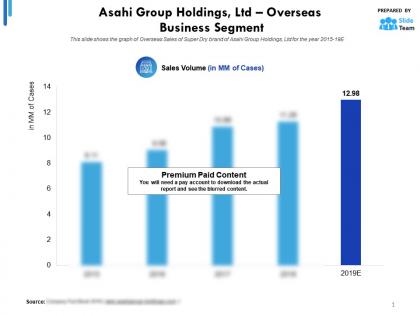 Asahi group holdings ltd statistic 1 overseas business segment
This is a professionally designed visual chart for Asahi Group Holdings Ltd Statistic 1 Overseas Business Segment. This is part of our Data and Statistics products selection, and you will need a Paid account to download the actual report with accurate data and sources. Downloaded report will contain the editable graph with accurate data, an excel table with the actual data, the exact source of the data and the release date. This slide shows the graph of Overseas Sales of Super Dry brand of Asahi Group Holdings, Ltd for the year 2015 to 19E. Download it immediately and use it for your business.
-
 Asahi group holdings ltd statistic 1 alcohol beverages business segment
This is a professionally designed visual chart for Asahi Group Holdings Ltd Statistic 1 Alcohol Beverages Business Segment. This is part of our Data and Statistics products selection, and you will need a Paid account to download the actual report with accurate data and sources. Downloaded report will contain the editable graph with accurate data, an excel table with the actual data, the exact source of the data and the release date. This slide provides a graph of revenue split of Alcohol Beverages Business Segment by container type bottle, can, keg of Asahi Group Holdings, Ltd for the years 2014 to 18. Download it immediately and use it for your business.
-
 Asahi group holdings ltd statistic 1 food business segment
This is a professionally designed visual chart for Asahi Group Holdings Ltd Statistic 1 Food Business Segment. This is part of our Data and Statistics products selection, and you will need a Paid account to download the actual report with accurate data and sources. Downloaded report will contain the editable graph with accurate data, an excel table with the actual data, the exact source of the data and the release date. This slide provides the graph of market share candy tablet market, baby food market, instant miso soup of Asahi Group Holdings, Ltd in Japanese market for the year 2018. Download it immediately and use it for your business.
-
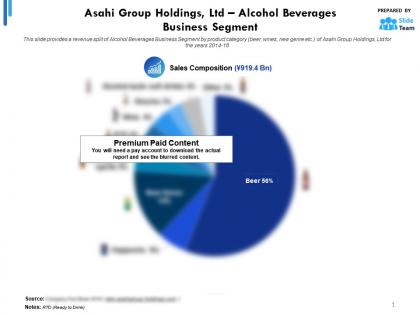 Asahi group holdings ltd statistic 2 alcohol beverages business segment
This is a professionally designed visual chart for Asahi Group Holdings Ltd Statistic 2 Alcohol Beverages Business Segment. This is part of our Data and Statistics products selection, and you will need a Paid account to download the actual report with accurate data and sources. Downloaded report will contain the editable graph with accurate data, an excel table with the actual data, the exact source of the data and the release date. This slide provides a revenue split of Alcohol Beverages Business Segment by product category beer, wines, new genre etc. of Asahi Group Holdings, Ltd for the years 2014 to 18. Download it immediately and use it for your business.
-
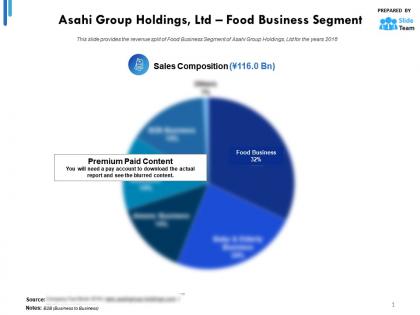 Asahi group holdings ltd statistic 2 food business segment
This is a professionally designed visual chart for Asahi Group Holdings Ltd Statistic 2 Food Business Segment. This is part of our Data and Statistics products selection, and you will need a Paid account to download the actual report with accurate data and sources. Downloaded report will contain the editable graph with accurate data, an excel table with the actual data, the exact source of the data and the release date. Asahi Group Holdings Ltd Statistic 3 Food Business Segment This slide provides the revenue split of Food Business Segment of Asahi Group Holdings, Ltd for the years 2018. Download it immediately and use it for your business.
-
 Asahi group holdings ltd statistic 3 alcohol beverages business segment
This is a professionally designed visual chart for Asahi Group Holdings Ltd Statistic 3 Alcohol Beverages Business Segment. This is part of our Data and Statistics products selection, and you will need a Paid account to download the actual report with accurate data and sources. Downloaded report will contain the editable graph with accurate data, an excel table with the actual data, the exact source of the data and the release date. This slide provides a graph of revenue in JPY Bn and core operating profit margin of Alcohol Beverages Business Segment of Asahi Group Holdings, Ltd for the years 2014 to 18. Download it immediately and use it for your business.
-
 Asahi group holdings ltd statistic 3 food business segment
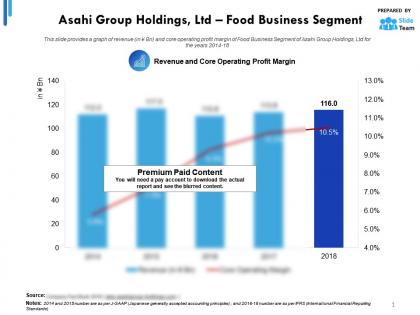
This is a professionally designed visual chart for Asahi Group Holdings Ltd Statistic 3 Food Business Segment. This is part of our Data and Statistics products selection, and you will need a Paid account to download the actual report with accurate data and sources. Downloaded report will contain the editable graph with accurate data, an excel table with the actual data, the exact source of the data and the release date. This slide provides a graph of revenue in JPY Bn and core operating profit margin of Food Business Segment of Asahi Group Holdings, Ltd for the years 2014 to 18. Download it immediately and use it for your business.
-
 Asahi group holdings ltd statistic 1 soft drinks business segment
This is a professionally designed visual chart for Asahi Group Holdings Ltd Statistic 1 Soft Drinks Business Segment. This is part of our Data and Statistics products selection, and you will need a Paid account to download the actual report with accurate data and sources. Downloaded report will contain the editable graph with accurate data, an excel table with the actual data, the exact source of the data and the release date. This slide provides a sales volume of Soft Drinks Business Segment by marketing channel vending machines, Convenience stores, supermarkets etc. of Asahi Group Holdings, Ltd for the years 2014 to 18. Download it immediately and use it for your business.
-
 Asahi group holdings ltd statistic 2 soft drinks business segment
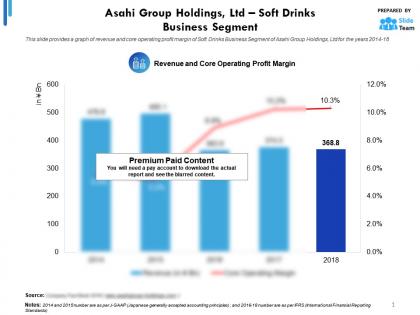
This is a professionally designed visual chart for Asahi Group Holdings Ltd Statistic 2 Soft Drinks Business Segment. This is part of our Data and Statistics products selection, and you will need a Paid account to download the actual report with accurate data and sources. Downloaded report will contain the editable graph with accurate data, an excel table with the actual data, the exact source of the data and the release date. This slide provides a graph of revenue and core operating profit margin of Soft Drinks Business Segment of Asahi Group Holdings, Ltd for the years 2014 to 18. Download it immediately and use it for your business.
-
 Asahi group holdings ltd statistic 3 soft drinks business segment
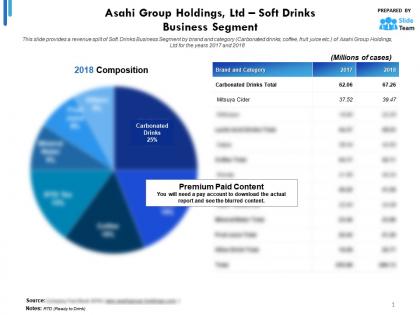
This is a professionally designed visual chart for Asahi Group Holdings Ltd Statistic 3 Soft Drinks Business Segment. This is part of our Data and Statistics products selection, and you will need a Paid account to download the actual report with accurate data and sources. Downloaded report will contain the editable graph with accurate data, an excel table with the actual data, the exact source of the data and the release date. This slide provides a revenue split of Soft Drinks Business Segment by brand and category Carbonated drinks, coffee, fruit juice etc. of Asahi Group Holdings, Ltd for the years 2017 to 2018. Download it immediately and use it for your business.
-
 Statistics ppt template with demographics market segment
Presenting this set of slides with name Statistics PPT Template With Demographics Market Segment. The topics discussed in these slide is Statistics PPT Template With Demographics Market Segment. This is a completely editable PowerPoint presentation and is available for immediate download. Download now and impress your audience.
-
 Key industry statistics identification target business customers with segmentation process
This slide shows the key statistics of IT industry. It includes global market value, market share CAGR growth and industry contribution to GDP. Introducing Key Industry Statistics Identification Target Business Customers With Segmentation Process to increase your presentation threshold. Encompassed with four stages, this template is a great option to educate and entice your audience. Dispence information on Key Industry Statistics, using this template. Grab it now to reap its full benefits.
-
 Key industry statistics segmentation approaches ppt rules
This slide shows the key statistics of IT industry. It includes global market value, market share CAGR growth and industry contribution to GDP.Increase audience engagement and knowledge by dispensing information using Key Industry Statistics Segmentation Approaches Ppt Rules. This template helps you present information on four stages. You can also present information on Global Market Value, Industry Contribution, Largest Regional Market using this PPT design. This
-
 Key statistics about sales deals marketing planning and segmentation strategy
Mentioned slide displays keys statistics about companys sales deals. Statistics covered are related to qualified leads, lead generation and conversion. Present the topic in a bit more detail with this Key Statistics About Sales Deals Marketing Planning And Segmentation Strategy. Use it as a tool for discussion and navigation on Key Statistics About Sales Deals. This template is free to edit as deemed fit for your organization. Therefore download it now.
-
 Key industry statistics b2b customer segmentation approaches ppt download
This slide shows the key statistics of IT industry. It includes global market value, market share CAGR growth and industry contribution to GDP. Increase audience engagement and knowledge by dispensing information using Key Industry Statistics B2B Customer Segmentation Approaches Ppt Download. This template helps you present information on four stages. You can also present information on Key Industry Statistics using this PPT design. This layout is completely editable so personaize it now to meet your audiences expectations.
-
 Launching A New Brand In The Market Segment Wise Revenue Generation Statistics
Following slide shows segment wise revenue generation statistics. Segments covered are processed food, beverages, personal care, hair care and baby care. Present the topic in a bit more detail with this Launching A New Brand In The Market Segment Wise Revenue Generation Statistics. Use it as a tool for discussion and navigation on Segment Wise Revenue Generation Statistics. This template is free to edit as deemed fit for your organization. Therefore download it now.
-
 Market segmentation and statistics assessment icon
Introducing our premium set of slides with Market Segmentation And Statistics Assessment Icon. Elucidate the one stages and present information using this PPT slide. This is a completely adaptable PowerPoint template design that can be used to interpret topics like Market Segmentation And Statistics Assessment Icon. So download instantly and tailor it with your information.
-
 Segment wise revenue generation statistics building effective brand strategy attract customers
Following slide shows segment wise revenue generation statistics. Segments covered are processed food, beverages, personal care, hair care and baby care.Deliver an outstanding presentation on the topic using this Segment Wise Revenue Generation Statistics Building Effective Brand Strategy Attract Customers. Dispense information and present a thorough explanation of Segment Wise Revenue Generation Statistics using the slides given. This template can be altered and personalized to fit your needs. It is also available for immediate download. So grab it now.


