Powerpoint Templates and Google slides for Sales Dashboards
Save Your Time and attract your audience with our fully editable PPT Templates and Slides.
-
 Marketing Promotion Dashboard To Evaluate Sales Associate Performance
Introducing our Marketing Promotion Dashboard To Evaluate Sales Associate Performance set of slides. The topics discussed in these slides are Sales Associate Performance, Targets. This is an immediately available PowerPoint presentation that can be conveniently customized. Download it and convince your audience.
-
 Promotion Dashboard With Monthly Organic And Paid Search Sales
Presenting our well structured Promotion Dashboard With Monthly Organic And Paid Search Sales. The topics discussed in this slide are Session Vs Sales, Marketing Channels Sales. This is an instantly available PowerPoint presentation that can be edited conveniently. Download it right away and captivate your audience.
-
 Retail Store Annual Sales Dashboard
This slide shows the retail store annual dashboard which includes sales revenue, total customers average transaction value, average units per customer, sales by division top five articles by sold items bar chart, total customer and visitors line chart, sales by city, average price and unit per transaction line chart etc. Introducing our Retail Store Annual Sales Dashboard set of slides. The topics discussed in these slides are Sales Revenue, Customers, Avg Transaction Value. This is an immediately available PowerPoint presentation that can be conveniently customized. Download it and convince your audience.
-
 Retail Store Dashboard With Sales By Demographics
This slide showcases a KPI dashboard for tracking retail store sales. It includes sales analysis KPIs such as global sales, daily average sales, the value of customer transactions, average units by customers, sales by category, sales by geography, etc. Presenting our well structured Retail Store Dashboard With Sales By Demographics. The topics discussed in this slide are Sales By Geography, Conversion Rate, Basket Value. This is an instantly available PowerPoint presentation that can be edited conveniently. Download it right away and captivate your audience.
-
 Retail Store Dashboard Snapshot With Sales Kpis
This slide covers a metrics dashboard for tracking retail store sales. It includes KPIs such as sales square foot per location, net profit, revues, shrinkage, customer retention rate, etc. Introducing our Retail Store Dashboard Snapshot With Sales Kpis set of slides. The topics discussed in these slides are Revenues, Net Profit, Customer Retention Rate. This is an immediately available PowerPoint presentation that can be conveniently customized. Download it and convince your audience.
-
 Organizational Performance Dashboard With Weekly Sales Revenue
This slide showcases the dashboard of financial organizational performance. It include average revenue per unit, customer lifetime value etc. Presenting our well structured Organizational Performance Dashboard With Weekly Sales Revenue. The topics discussed in this slide are Customer, Sales Revenue, Average. This is an instantly available PowerPoint presentation that can be edited conveniently. Download it right away and captivate your audience.
-
 Product Marketing Dashboard Depicting Sales Organization Campaign Performance
This slide represents marketing dashboard for tracking campaign performance showcasing total expenditure, total impression, total clicks, total acquisitions, cost per acquisitions etc. Introducing our Product Marketing Dashboard Depicting Sales Organization Campaign Performance set of slides. The topics discussed in these slides are Product Marketing Dashboard Depicting Sales Organization Campaign Performance. This is an immediately available PowerPoint presentation that can be conveniently customized. Download it and convince your audience.
-
 Sales Organization Dashboard For Product Marketing
This slide represents the sales dashboard for product marketing illustrating metrics such as number of sales, total revenue, profit, cost, sales revenue, cost breakdown, accumulated revenue, etc. Presenting our well structured Sales Organization Dashboard For Product Marketing. The topics discussed in this slide are Sales, Revenue, Profit. This is an instantly available PowerPoint presentation that can be edited conveniently. Download it right away and captivate your audience.
-
 Bpo Call Center Dashboard For Telemarketing Sales
This slide shows the BPO call center dashboard for telemarketing sales and covers elements such as number of items sold, total value, top 3 sales, total value week, month and year etc. Presenting our well-structured Bpo Call Center Dashboard For Telemarketing Sales. The topics discussed in this slide are BPO Call Center Dashboard For Telemarketing Sales. This is an instantly available PowerPoint presentation that can be edited conveniently. Download it right away and captivate your audience.
-
 Customer Support Kpi Dashboard For Evaluating Sales Bpo Performance
This slide illustrates the customer support KPI dashboard for measuring sales BPO performance and covers elements such as total calls, average answer speed, abandon rate etc. it also provides information about the agents name, overall satisfaction score etc. Introducing our Customer Support Kpi Dashboard For Evaluating Sales Bpo Performance set of slides. The topics discussed in these slides are Performance, Dashboard, Evaluating. This is an immediately available PowerPoint presentation that can be conveniently customized. Download it and convince your audience.
-
 Implementing Transformation Restructure Accounting Sales And Profit Margin Analysis Dashboard
Present the topic in a bit more detail with this Implementing Transformation Restructure Accounting Sales And Profit Margin Analysis Dashboard. Use it as a tool for discussion and navigation on Sales And Profit Margin Analysis Dashboard. This template is free to edit as deemed fit for your organization. Therefore download it now.
-
 Dashboard Sales Trend Slide For Annual Earnings Per Share Infographic Template
This is our Dashboard Sales Trend Slide For Annual Earnings Per Share Infographic Template designed in PowerPoint, however, you can also access it in Google Slides. It comes in two aspect ratios standard and widescreen, with fully-editable visual content.
-
 Automating Sales Processes To Improve Revenues Dashboard Depicting Sales KPIs To Track Current
This slide shows the dashboard that depicts sales KPIs to track current status which involves won and lost opportunities, revenues and pipeline by territory, sales by different products, etc. Deliver an outstanding presentation on the topic using this Automating Sales Processes To Improve Revenues Dashboard Depicting Sales KPIs To Track Current. Dispense information and present a thorough explanation of Won Opportunities, Estimated, Revenue By Territory, Total Opportunities, Pipeline By Employee using the slides given. This template can be altered and personalized to fit your needs. It is also available for immediate download. So grab it now.
-
 Bant Lead Qualification Framework Sales Dashboard With Lead Conversional And Lead Opportunity
The following slide displays the key metrics for the sales as it highlights the lead conversion ratio , opportunists, proposal sent and key performing employees. Present the topic in a bit more detail with this Bant Lead Qualification Framework Sales Dashboard With Lead Conversional And Lead Opportunity. Use it as a tool for discussion and navigation on Converted Leads Last 30 Days, Lead Conversion Ratio, Negotiation, Employee. This template is free to edit as deemed fit for your organization. Therefore download it now.
-
 Annual Sales Team Performance And Coordination Dashboard
This slide signifies the dashboard on sales team performance and coordination. It includes total revenue generated, employee performance pie chart, Products sold and income by customer location. Introducing our Annual Sales Team Performance And Coordination Dashboard set of slides. The topics discussed in these slides are Planning, Reporting, customizations. This is an immediately available PowerPoint presentation that can be conveniently customized. Download it and convince your audience.
-
 Sales Dashboard With Lead Conversional And Lead Opportunity Qualification Process And Criteria
The following slide displays the key metrics for the sales as it highlights the lead conversion ratio , opportunists, proposal sent and key performing employees. Deliver an outstanding presentation on the topic using this Sales Dashboard With Lead Conversional And Lead Opportunity Qualification Process And Criteria. Dispense information and present a thorough explanation of Dashboard, Conversional, Opportunity using the slides given. This template can be altered and personalized to fit your needs. It is also available for immediate download. So grab it now.
-
 Dashboard To Track Sales Revenue Growth And New Customer Acquisition
Introducing our Dashboard To Track Sales Revenue Growth And New Customer Acquisition set of slides. The topics discussed in these slides are Sales Revenue, Customer. This is an immediately available PowerPoint presentation that can be conveniently customized. Download it and convince your audience.
-
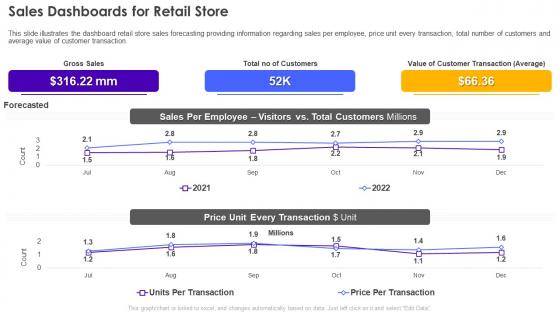 Sales Dashboards For Retail Store Retail Store Operations Performance Assessment
This slide illustrates the dashboard retail store sales forecasting providing information regarding sales per employee, price unit every transaction, total number of customers and average value of customer transaction. Present the topic in a bit more detail with this Sales Dashboards For Retail Store Retail Store Operations Performance Assessment. Use it as a tool for discussion and navigation on Dashboards, Customer, Transaction. This template is free to edit as deemed fit for your organization. Therefore download it now.
-
 Pharma Clinical Dashboard To Analyze Sales Strategy Performance
The following slide delineates a comprehensive clinical dashboard which can be used by the pharma company to measure its sales strategy performance. The KPIs covered in the slide are top sales producers, sales channels, volume by product, etc. Introducing our Pharma Clinical Dashboard To Analyze Sales Strategy Performance set of slides. The topics discussed in these slides are Pharma Clinical, Dashboard, Analyze, Sales Strategy Performance. This is an immediately available PowerPoint presentation that can be conveniently customized. Download it and convince your audience.
-
 Dashboard To Analyse Sales Post Global Expansion Strategy For Target Market Assessment
This slide showcase dashboard that can help organization track sales after global expansion. Its key components are sales target, target achievement, sales by channel, inventory days outstanding, sales growth, gross profit, gross profit margin etc. Deliver an outstanding presentation on the topic using this Dashboard To Analyse Sales Post Global Expansion Strategy For Target Market Assessment. Dispense information and present a thorough explanation of Sales, Target Achievement, Gross Profit using the slides given. This template can be altered and personalized to fit your needs. It is also available for immediate download. So grab it now.
-
 KPI Dashboard To Monitor Sales Opportunities Strategic Marketing Plan To Increase
Mentioned slide shows the KPI dashboard that can be used to track win and lost sales opportunities. It includes metrics namely won opportunities, lost opportunities, pipeline by territory, total opportunities. Present the topic in a bit more detail with this KPI Dashboard To Monitor Sales Opportunities Strategic Marketing Plan To Increase. Use it as a tool for discussion and navigation on KPI Dashboard, Sales Opportunities, Revenue. This template is free to edit as deemed fit for your organization. Therefore download it now.
-
 Sales Timeline And Performance Management Dashboard
The slide highlight the sales timeline and performance management dashboard illustrating regional market share, sales timeline, regional margin and category margin. Introducing our Sales Timeline And Performance Management Dashboard set of slides. The topics discussed in these slides are Regional Market Share, Sales Timeline, Regional Margin. This is an immediately available PowerPoint presentation that can be conveniently customized. Download it and convince your audience.
-
 Brand Promotion Metric Dashboard For Performance Evaluation Develop Promotion Plan To Boost Sales Growth
This slide represents brand promotion dashboard. It includes sales quantity, return quantity, cost of goods, return amount etc. Present the topic in a bit more detail with this Brand Promotion Metric Dashboard For Performance Evaluation Develop Promotion Plan To Boost Sales Growth. Use it as a tool for discussion and navigation on Performance, Evaluation, Dashboard. This template is free to edit as deemed fit for your organization. Therefore download it now
-
 Email Promotion Campaign Dashboard For Performance Evaluation Develop Promotion Plan To Boost Sales Growth
This slide represents website promotion dashboard. It covers total visits, average session duration, bounce rate, page views etc. Present the topic in a bit more detail with this Email Promotion Campaign Dashboard For Performance Evaluation Develop Promotion Plan To Boost Sales Growth Use it as a tool for discussion and navigation on Dashboard, Performance, Evaluation. This template is free to edit as deemed fit for your organization. Therefore download it now
-
 Website Promotion Dashboard Highlighting Advertisement Develop Promotion Plan To Boost Sales Growth
This slide represents website promotion dashboard. It covers total visits, average session duration, bounce rate, page views etc. Present the topic in a bit more detail with this Website Promotion Dashboard Highlighting Advertisement Develop Promotion Plan To Boost Sales Growth. Use it as a tool for discussion and navigation on Advertisement, Performance, Dashboard. This template is free to edit as deemed fit for your organization. Therefore download it now
-
 Crm Dashboard For Tracking Sales Pipeline Crm Platform Implementation Plan
This slide covers the CRM KPI dashboard for monitoring lead status in the sales funnel. It includes metrics such as open pipeline value, open pipeline by product package, pipeline value forecast, etc. Present the topic in a bit more detail with this Crm Dashboard For Tracking Sales Pipeline Crm Platform Implementation Plan. Use it as a tool for discussion and navigation on Dashboard, Pipeline, Monitoring. This template is free to edit as deemed fit for your organization. Therefore download it now.
-
 CRM Lifecycle Analytics Dashboard With Sales Record
This slide signifies the customer relationship management analytics dashboard. It covers information about sales record by different representative, total products sold, sales by different month, etc. Introducing our CRM Lifecycle Analytics Dashboard With Sales Record set of slides. The topics discussed in these slides are CRM Lifecycle Analytics, Dashboard, Sales Record. This is an immediately available PowerPoint presentation that can be conveniently customized. Download it and convince your audience.
-
 Crm Dashboard For Tracking Sales Pipeline Customer Relationship Management System
This slide covers the CRM KPI dashboard for monitoring lead status in the sales funnel. It includes metrics such as open pipeline value, open pipeline by product package, pipeline value forecast, etc. Present the topic in a bit more detail with this Crm Dashboard For Tracking Sales Pipeline Customer Relationship Management System. Use it as a tool for discussion and navigation on Dashboard, Pipeline, Monitoring. This template is free to edit as deemed fit for your organization. Therefore download it now
-
 Dashboard Depicting Sales Kpis To Track Current Status Sales Process Automation To Improve Sales
This slide shows the dashboard that depicts sales KPIs to track current status which involves won and lost opportunities, revenues and pipeline by territory, sales by different products, etc. Deliver an outstanding presentation on the topic using this Dashboard Depicting Sales Kpis To Track Current Status Sales Process Automation To Improve Sales. Dispense information and present a thorough explanation of Dashboard, Opportunities, Products using the slides given. This template can be altered and personalized to fit your needs. It is also available for immediate download. So grab it now.
-
 Marketing Plan To Boost Real Estate Dashboard To Monitor Sales Team Performance
Mentioned provide illustrates real estate dashboard for monitoring salesperson performance. KPIs covered in the dashboard are deal count, deal totals, deal count leader boards and total active deal price. Deliver an outstanding presentation on the topic using this Marketing Plan To Boost Real Estate Dashboard To Monitor Sales Team Performance. Dispense information and present a thorough explanation of Active Deal Count, Total Active, Deal Price, House Net using the slides given. This template can be altered and personalized to fit your needs. It is also available for immediate download. So grab it now.
-
 Dashboard Depicting Product Sales KPIS Creating Competitive Sales Strategy
This slide shows the dashboard that depicts product sales metrics which focuses on revenue generated from top products, incremental sales by campaign, cost of goods sold, etc. Deliver an outstanding presentation on the topic using this Dashboard Depicting Product Sales KPIS Creating Competitive Sales Strategy. Dispense information and present a thorough explanation of Products In Revenue, In Store Purchases, Incremental Sales using the slides given. This template can be altered and personalized to fit your needs. It is also available for immediate download. So grab it now.
-
 Crm Dashboard For Tracking Sales Pipeline Crm Software Deployment Guide
This slide covers the CRM KPI dashboard for monitoring lead status in the sales funnel. It includes metrics such as open pipeline value, open pipeline by product package, pipeline value forecast, etc. Present the topic in a bit more detail with this Crm Dashboard For Tracking Sales Pipeline Crm Software Deployment Guide. Use it as a tool for discussion and navigation on Dashboard, Monitoring, Pipeline. This template is free to edit as deemed fit for your organization. Therefore download it now.
-
 Sales Performance Assessment Dashboard Post Strategy Implementation
The following slide highlights the annual sales performance of a company to comprehend strategy implementation. It includes KPIs such as new added customers, revenue, profit, average sales revenue, customer lifetime value etc. Introducing our Sales Performance Assessment Dashboard Post Strategy Implementation set of slides. The topics discussed in these slides are Customer Acquisition Cost, Customer Life Time, Sales Revenue. This is an immediately available PowerPoint presentation that can be conveniently customized. Download it and convince your audience.
-
 Sales Dashboard With Lead Conversional And Lead Opportunity Sales Qualification Scoring Model
The following slide displays the key metrics for the sales as it highlights the lead conversion ratio , opportunists, proposal sent and key performing employees Present the topic in a bit more detail with this Sales Dashboard With Lead Conversional And Lead Opportunity Sales Qualification Scoring Model. Use it as a tool for discussion and navigation on Dashboard, Conversional, Opportunity. This template is free to edit as deemed fit for your organization. Therefore download it now.
-
 CRM Implementation Dashboard With Customer Satisfaction Sales CRM Cloud Implementation
This slide illustrates the issues that trigger poor relationship with customers which includes no real time support, no innovative product launched, bad after sale service and lack of engagement. Present the topic in a bit more detail with this Sales CRM Cloud Implementation Poor Relationship With Customers Ppt Slides Picture. Use it as a tool for discussion and navigation on Weak Relationship Building, Poor Customer Service, Product Launched. This template is free to edit as deemed fit for your organization. Therefore download it now.
-
 Sales CRM Cloud Implementation CRM Implementation Dashboard With Sales Pipeline
This slide illustrates the issues that trigger poor relationship with customers which includes no real time support, no innovative product launched, bad after sale service and lack of engagement. Present the topic in a bit more detail with this Sales CRM Cloud Implementation Poor Relationship With Customers Ppt Slides Picture. Use it as a tool for discussion and navigation on Weak Relationship Building, Poor Customer Service, Product Launched. This template is free to edit as deemed fit for your organization. Therefore download it now.
-
 Online Marketing Dashboard To Improve Sales
This slide covers online marketing dashboard to improve sales. It involves details such as web performance, conversion funnel, revenue this month, traffic sources and number of followers on social media. Introducing our Online Marketing Dashboard To Improve Sales set of slides. The topics discussed in these slides are Social Media, Revenue, Cost per Conversion, Web Performance. This is an immediately available PowerPoint presentation that can be conveniently customized. Download it and convince your audience.
-
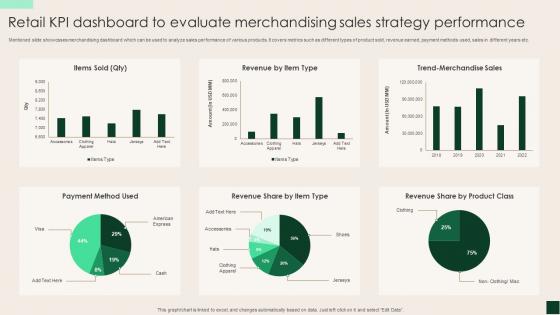 Retail KPI Dashboard To Evaluate Merchandising Sales Strategy Performance
Mentioned slide showcases merchandising dashboard which can be used to analyze sales performance of various products. It covers metrics such as different types of product sold, revenue earned, payment methods used, sales in different years etc. Introducing our Retail KPI Dashboard To Evaluate Merchandising Sales Strategy Performance set of slides. The topics discussed in these slides are Retail KPI, Dashboard, Merchandising, Sales Strategy, Performance. This is an immediately available PowerPoint presentation that can be conveniently customized. Download it and convince your audience.
-
 Digital Marketing Dashboard For Organic Growth Playbook Internal Sales Growth Strategy Playbook
Deliver an outstanding presentation on the topic using this Digital Marketing Dashboard For Organic Growth Playbook Internal Sales Growth Strategy Playbook. Dispense information and present a thorough explanation of Marketing, Dashboard, Growth using the slides given. This template can be altered and personalized to fit your needs. It is also available for immediate download. So grab it now.
-
 Product Planning Process Dashboard Depicting Sales And Customer Analytics
This slide focuses on dashboard that depicts sales and customer analytics which covers sales revenue, average transaction rate, out of stock items, sales by division, monthly visitors, etc. Present the topic in a bit more detail with this Product Planning Process Dashboard Depicting Sales And Customer Analytics. Use it as a tool for discussion and navigation on Sales Revenue, Total Customers, Stock Items. This template is free to edit as deemed fit for your organization. Therefore download it now.
-
 Company Marketing Dashboard Report With Closed Sales
This graph or chart is linked to excel, and changes automatically based on data. Just left click on it and select Edit Data. Introducing our Company Marketing Dashboard Report With Closed Sales set of slides. The topics discussed in these slides are Closed Sales, Median Sales Price, Homes For Sale. This is an immediately available PowerPoint presentation that can be conveniently customized. Download it and convince your audience.
-
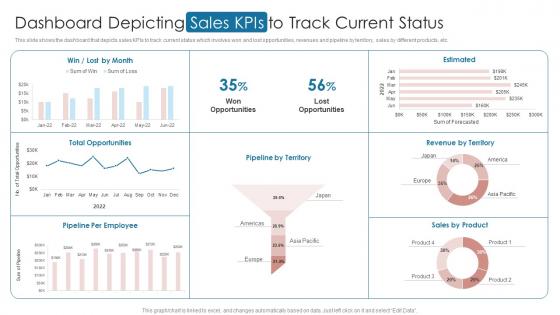 Dashboard Depicting Sales Kpis To Track Current Status Digital Automation To Streamline Sales Operations
This slide shows the dashboard that depicts sales KPIs to track current status which involves won and lost opportunities, revenues and pipeline by territory, sales by different products, etc. Present the topic in a bit more detail with this Dashboard Depicting Sales Kpis To Track Current Status Digital Automation To Streamline Sales Operations. Use it as a tool for discussion and navigation on Dashboard, Opportunities, Revenues. This template is free to edit as deemed fit for your organization. Therefore download it now.
-
 CRM Implementation Dashboard With Sales Pipeline Customer Relationship Management Deployment Strategy
The following slide showcases the CRM dashboard which includes leads, deals, sales revenue, revenue by products, total leads by source, total leads by status and lead distribution.Deliver an outstanding presentation on the topic using this CRM Implementation Dashboard With Sales Pipeline Customer Relationship Management Deployment Strategy Dispense information and present a thorough explanation of Sales Revenue, Sales Pipeline, Revenue Products using the slides given. This template can be altered and personalized to fit your needs. It is also available for immediate download. So grab it now.
-
 CRM Performance Metrics Dashboard Showing Sales In Real Estate Company
This slide represents the dashboard showing the sales performance of a real estate company. It includes details related top 5 agents US sales, sales vs target per agent, top 5 banks-sold units, sales by top 5 agencies and top 10 projects. Introducing our CRM Performance Metrics Dashboard Showing Sales In Real Estate Company set of slides. The topics discussed in these slides are Sales, Target, Projects. This is an immediately available PowerPoint presentation that can be conveniently customized. Download it and convince your audience.
-
 F368 Crm Implementation Dashboard With Sales Pipeline And Revenue By Products Crm Software Implementation
The following slide showcases the CRM dashboard which includes leads, deals, sales revenue, revenue by products, total leads by source, total leads by status and lead distribution. Present the topic in a bit more detail with this F368 Crm Implementation Dashboard With Sales Pipeline And Revenue By Products Crm Software Implementation. Use it as a tool for discussion and navigation on Implementation, Dashboard, Revenue. This template is free to edit as deemed fit for your organization. Therefore download it now.
-
 B2B Sales Best Practices Playbook B2B Prospects Performance Measurement Dashboard
This slide provides information regarding B2B performance tracking dashboard to measure leads, MQL, SQL, customers, revenue goals, total media spend. Present the topic in a bit more detail with this B2B Sales Best Practices Playbook B2B Prospects Performance Measurement Dashboard. Use it as a tool for discussion and navigation on Revenue Goal, Cost Per Lead, Customers. This template is free to edit as deemed fit for your organization. Therefore download it now.
-
 B2B Sales Best Practices Playbook B2B Sales Representatives Performance Tracking Dashboard
This slide provides information regarding B2B sales representatives performance tracking dashboard to measure leads by region, revenue breakdown, top performers by leads, revenues, etc. Deliver an outstanding presentation on the topic using this B2B Sales Best Practices Playbook B2B Sales Representatives Performance Tracking Dashboard. Dispense information and present a thorough explanation of Sales, Revenue, Revenue using the slides given. This template can be altered and personalized to fit your needs. It is also available for immediate download. So grab it now.
-
 B2B Sales Best Practices Playbook Sales Management Activities Tracking Dashboard
Present the topic in a bit more detail with this B2B Sales Best Practices Playbook Sales Management Activities Tracking Dashboard. Use it as a tool for discussion and navigation on Closed Business, Sales Pipeline, Growth. This template is free to edit as deemed fit for your organization. Therefore download it now.
-
 Data Science Dashboard Snapshot To Monitor Store Sales Performance
This slide covers dashboard depicting sales performance report of a store. It includes elements such as total sales, profit, orders, profit margin, products count, sales by segments, top customers, product category sales, etc. Introducing our Data Science Dashboard Snapshot To Monitor Store Sales Performance set of slides. The topics discussed in these slides are Data Science Dashboard, Monitor Store, Sales Performance. This is an immediately available PowerPoint presentation that can be conveniently customized. Download it and convince your audience.
-
 Crm Dashboard For Tracking Sales Pipeline Crm Implementation Process Ppt Show Portrait
This slide covers the CRM KPI dashboard for monitoring lead status in the sales funnel. It includes metrics such as open pipeline value, open pipeline by product package, pipeline value forecast, etc. Present the topic in a bit more detail with this Crm Dashboard For Tracking Sales Pipeline Crm Implementation Process Ppt Show Portrait. Use it as a tool for discussion and navigation on Dashboard, Product, Forecast. This template is free to edit as deemed fit for your organization. Therefore download it now.
-
 B2b Prospects Performance Measurement Dashboard B2b Sales Representatives Guidelines Playbook
This slide provides information regarding B2B performance tracking dashboard to measure leads, MQL, SQL, customers, revenue goals, total media spend. Deliver an outstanding presentation on the topic using this B2b Prospects Performance Measurement Dashboard B2b Sales Representatives Guidelines Playbook. Dispense information and present a thorough explanation of Performance, Measurement, Dashboard using the slides given. This template can be altered and personalized to fit your needs. It is also available for immediate download. So grab it now.
-
 B2b Sales Representatives Guidelines Playbook B2b Sales Representatives Performance Tracking Dashboard
This slide provides information regarding B2B sales representatives performance tracking dashboard to measure leads by region, revenue breakdown, top performers by leads, revenues, etc. Present the topic in a bit more detail with this B2b Sales Representatives Guidelines Playbook B2b Sales Representatives Performance Tracking Dashboard. Use it as a tool for discussion and navigation on Representatives, Performance, Dashboard. This template is free to edit as deemed fit for your organization. Therefore download it now.
-
 Sales Management Activities Tracking Dashboard B2b Sales Representatives Guidelines Playbook
This slide provides information regarding sales management activities tracking dashboard to measure closed business, sales pipeline, sales activity by sales rep, month over month growth, forecast by month, etc. Present the topic in a bit more detail with this Sales Management Activities Tracking Dashboard B2b Sales Representatives Guidelines Playbook. Use it as a tool for discussion and navigation on Management, Dashboard, Information. This template is free to edit as deemed fit for your organization. Therefore download it now.
-
 Monthly Sales Report Dashboard Snapshot With Churn Rate
The following slide highlights the monthly sales report dashboard snapshot with churn rate. It showcases details for current month sales, total revenue, current month profit, current month cost, sales revenue, current month expense, revenue churn rate and accumulated revenue. Presenting our well structured Monthly Sales Report Dashboard With Churn Rate. The topics discussed in this slide are Current Month Sales, Total Revenue, Current Month Expense. This is an instantly available PowerPoint presentation that can be edited conveniently. Download it right away and captivate your audience.
-
 Dashboard Depicting Sales And Customer Analytics Retail Merchandising Plan
This slide focuses on dashboard that depicts sales and customer analytics which covers sales revenue, average transaction rate, out of stock items, sales by division, monthly visitors, etc. Deliver an outstanding presentation on the topic using this Dashboard Depicting Sales And Customer Analytics Retail Merchandising Plan. Dispense information and present a thorough explanation of Total Customers, Transaction Price, Sales Revenue using the slides given. This template can be altered and personalized to fit your needs. It is also available for immediate download. So grab it now.
-
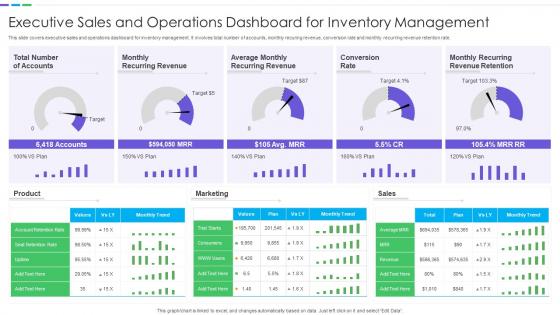 Executive Sales And Operations Dashboard Snapshot For Inventory Management
This slide covers executive sales and operations dashboard snapshot for inventory management. It involves total number of accounts, monthly recuring revenue, conversion rate and monthly recurring revenue retention rate. Introducing our Executive Sales And Operations Dashboard For Inventory Management set of slides. The topics discussed in these slides are Monthly Recurring Revenue, Conversion Rate, Recurring Revenue Retention. This is an immediately available PowerPoint presentation that can be conveniently customized. Download it and convince your audience.
-
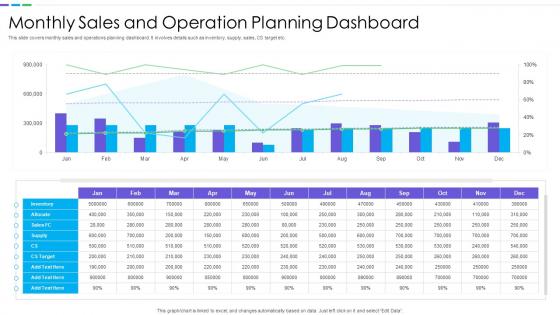 Monthly Sales And Operation Planning Dashboard
This slide covers monthly sales and operations planning dashboard. It involves details such as inventory, supply, sales, CS target etc. Presenting our well structured Monthly Sales And Operation Planning Dashboard. The topics discussed in this slide are Monthly Sales, Operation Planning, Dashboard. This is an instantly available PowerPoint presentation that can be edited conveniently. Download it right away and captivate your audience.
-
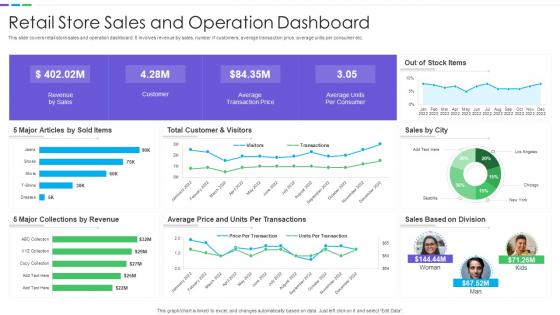 Retail Store Sales And Operation Dashboard
This slide covers retail store sales and operation dashboard. It involves revenue by sales, number if customers, average transaction price, average units per consumer etc. Introducing our Retail Store Sales And Operation Dashboard set of slides. The topics discussed in these slides are Retail Store Sales, Operation Dashboard. This is an immediately available PowerPoint presentation that can be conveniently customized. Download it and convince your audience.
-
 Sales And Operation Dashboard For Performance Management
This slide covers sales and operation dashboard for performance management. It involves details such as number of new buyers, sales revenue, average revenue per unit etc. Presenting our well structured Sales And Operation Dashboard For Performance Management. The topics discussed in this slide are Customer Lifetime Value, Customer Acquisition Cost, Average Revenue Per Unit. This is an instantly available PowerPoint presentation that can be edited conveniently. Download it right away and captivate your audience.
-
 Sales And Operation Dashboard To Analyze Performance
This slide covers sales and operation dashboard to analyze performance. It involves sales, revenue, profit, sale size and monthly productivity. Introducing our Sales And Operation Dashboard To Analyze Performance set of slides. The topics discussed in these slides are Sales, Revenue, Profit. This is an immediately available PowerPoint presentation that can be conveniently customized. Download it and convince your audience.


