Powerpoint Templates and Google slides for Project Completion Rate
Save Your Time and attract your audience with our fully editable PPT Templates and Slides.
-
 Optimizing Project Success Rate Through Effective Project Resources Management Complete Deck
Ditch the Dull templates and opt for our engaging Optimizing Project Success Rate Through Effective Project Resources Management Complete Deck deck to attract your audience. Our visually striking design effortlessly combines creativity with functionality, ensuring your content shines through. Compatible with Microsoft versions and Google Slides, it offers seamless integration of presentation. Save time and effort with our pre-designed PPT layout, while still having the freedom to customize fonts, colors, and everything you ask for. With the ability to download in various formats like JPG, JPEG, and PNG, sharing your slides has never been easier. From boardroom meetings to client pitches, this deck can be the secret weapon to leaving a lasting impression.
-
 Task Completion Rate For Project Accomplishment
The purpose of this slide is to emphasize how the task completion rate for project accomplishment serves as a vital metric, allowing us to assess project efficiency and identify bottlenecks by tracking completed tasks against the overall project plan. Introducing our Task Completion Rate For Project Accomplishment set of slides. The topics discussed in these slides are Task Completion Rate, Project Accomplishment Serves, Vital Metric, Tracking Completed. This is an immediately available PowerPoint presentation that can be conveniently customized. Download it and convince your audience.
-
 Declining Graph Of Task Completion Rate Mastering Digital Project PM SS V
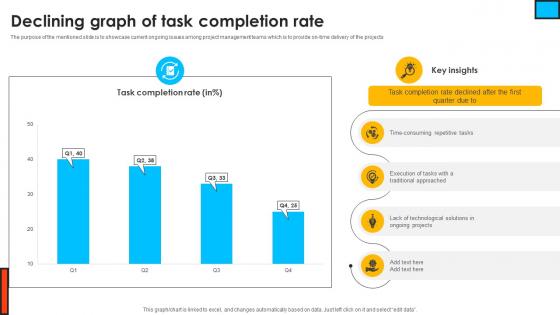
The purpose of the mentioned slide is to showcase current ongoing issues among project management teams which is to provide on-time delivery of the projects Present the topic in a bit more detail with this Declining Graph Of Task Completion Rate Mastering Digital Project PM SS V Use it as a tool for discussion and navigation on Task Completion, Declining Graph This template is free to edit as deemed fit for your organization. Therefore download it now.
-
 Declining Graph Of Task Completion Rate Digital Project Management Navigation PM SS V
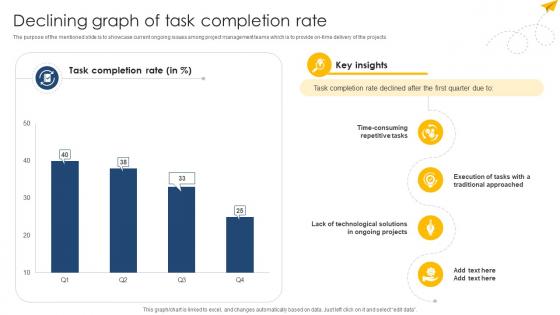
The purpose of the mentioned slide is to showcase current ongoing issues among project management teams which is to provide on time delivery of the projects Present the topic in a bit more detail with this Declining Graph Of Task Completion Rate Digital Project Management Navigation PM SS V Use it as a tool for discussion and navigation on Technological Solutions, Traditional Approached, Repetitive Tasks This template is free to edit as deemed fit for your organization. Therefore download it now.
-
 Efficiency In Digital Project Declining Graph Of Task Completion Rate
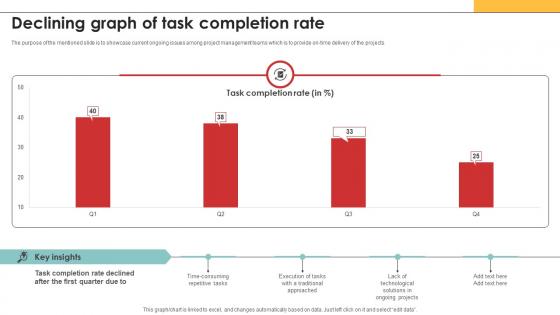
The purpose of the mentioned slide is to showcase current ongoing issues among project management teams which is to provide on-time delivery of the projects. Deliver an outstanding presentation on the topic using this Efficiency In Digital Project Declining Graph Of Task Completion Rate. Dispense information and present a thorough explanation of Time-Consuming Repetitive Tasks, Lack Of Technological, Execution Of Tasks using the slides given. This template can be altered and personalized to fit your needs. It is also available for immediate download. So grab it now.
-
 Declining Graph Of Task Completion Rate Navigating The Digital Project Management PM SS
The purpose of the mentioned slide is to showcase current ongoing issues among project management teams which is to provide on-time delivery of the projects. Present the topic in a bit more detail with this Declining Graph Of Task Completion Rate Navigating The Digital Project Management PM SS. Use it as a tool for discussion and navigation on Declining Graph, Task Completion Rate. This template is free to edit as deemed fit for your organization. Therefore download it now.
-
 Defining The Success Rate Of Projects Undertaken And Completed Using Agile Software
Mentioned slide portrays organizations success rate of project undertaken and completed over the last two years. Here the graph indicates that success rate gets declined to 58 percent in 2022. Deliver an outstanding presentation on the topic using this Defining The Success Rate Of Projects Undertaken And Completed Using Agile Software. Dispense information and present a thorough explanation of Success Rate, IT Projects, Project Success Rate Percent, 2021, 2022 using the slides given. This template can be altered and personalized to fit your needs. It is also available for immediate download. So grab it now.
-
 How does agile save you money it defining the success rate of projects undertaken and completed
Mentioned slide portrays organizations success rate of project undertaken and completed over the last two years. Here the graph indicates that success rate gets declined to 58 percent in 2020. Present the topic in a bit more detail with this How Does Agile Save You Money It Defining The Success Rate Of Projects Undertaken And Completed. Use it as a tool for discussion and navigation on Defining The Success Rate Of Projects Undertaken And Completed. This template is free to edit as deemed fit for your organization. Therefore download it now.
-
 Agile Qa Model It The Success Rate Of Projects Completed Since 2022
Mentioned slide portrays companys project success rate undertaken and covered over the last two years. Here the graph indicates that success rate gets declined to 56 percent in 2022. Deliver an outstanding presentation on the topic using this Agile Qa Model It The Success Rate Of Projects Completed Since 2022. Dispense information and present a thorough explanation of Defining The Success Rate Of Projects Completed Since 2022 using the slides given. This template can be altered and personalized to fit your needs. It is also available for immediate download. So grab it now.
-
 Success Rate Of Waterfall And Agile Project Management Approach Complete Guide Deploying Waterfall
This slide showcases the success rate of waterfall and agile methodology for project management. It presents the project success, failure and challenged percentage in waterfall and agile model approach. Deliver an outstanding presentation on the topic using this Success Rate Of Waterfall And Agile Project Management Approach Complete Guide Deploying Waterfall. Dispense information and present a thorough explanation of Success Rate Of Waterfall, Agile Project, Management Approach using the slides given. This template can be altered and personalized to fit your needs. It is also available for immediate download. So grab it now.
-
 Waterfall And Agile Model Failure Rate By Project Size Complete Guide Deploying Waterfall Management
This slide showcases the rate of failure of waterfall and agile model approach in project management by its size. It compares waterfall and agile model in small, medium and large project size. Present the topic in a bit more detail with this Waterfall And Agile Model Failure Rate By Project Size Complete Guide Deploying Waterfall Management. Use it as a tool for discussion and navigation on Waterfall, Agile Model Failure, Rate By Project Size. This template is free to edit as deemed fit for your organization. Therefore download it now.
-
 How does agile save you money it analyzing current otd rate of projects undertaken and completed
Following slide provides information about the on time delivery rate of the projects completed by the organization. Here the stats indicates that OTD rate of projects completed in H1 of 2020 was 75 percent. Present the topic in a bit more detail with this How Does Agile Save You Money It Analyzing Current OTD Rate Of Projects Undertaken And Completed. Use it as a tool for discussion and navigation on Analyzing Current OTD Rate Of Projects Undertaken And Completed. This template is free to edit as deemed fit for your organization. Therefore download it now.
-
 Defining the success rate of projects completed since 2021 agile software quality assurance model it
Mentioned slide portrays companys project success rate undertaken and covered over the last two years. Here the graph indicates that success rate gets declined to 56 percent in 2022. Present the topic in a bit more detail with this Defining The Success Rate Of Projects Completed Since 2021 Agile Software Quality Assurance Model IT. Use it as a tool for discussion and navigation on Defining The Success Rate Of Projects Completed Since 2021. This template is free to edit as deemed fit for your organization. Therefore download it now.


