Powerpoint Templates and Google slides for Pie Chart Showing
Save Your Time and attract your audience with our fully editable PPT Templates and Slides.
-
 Arrow symbol pie circle showing circular flow in process chart 7 stages powerpoint templates 0712
Manage your outline structure with this arrow pointing circle diagram
-
 Pie Chart Showing Current Production Efficiencies Building Comprehensive Plan Strategy And Operations MKT SS V
Deliver an outstanding presentation on the topic using this Pie Chart Showing Current Production Efficiencies Building Comprehensive Plan Strategy And Operations MKT SS V. Dispense information and present a thorough explanation of Pie Chart Showing, Current Production Efficiencies using the slides given. This template can be altered and personalized to fit your needs. It is also available for immediate download. So grab it now.
-
 Pie Chart Showing Current Production Strategic Operations Management Techniques To Reduce Strategy SS V
Present the topic in a bit more detail with this Pie Chart Showing Current Production Strategic Operations Management Techniques To Reduce Strategy SS V. Use it as a tool for discussion and navigation on Showing Current, Production Efficiencies. This template is free to edit as deemed fit for your organization. Therefore download it now.
-
 Pie Chart Showing Current Production Efficiencies Effective Guide To Reduce Costs Strategy SS V
Deliver an outstanding presentation on the topic using this Pie Chart Showing Current Production Efficiencies Effective Guide To Reduce Costs Strategy SS V. Dispense information and present a thorough explanation of Current, Production, Efficiencies using the slides given. This template can be altered and personalized to fit your needs. It is also available for immediate download. So grab it now.
-
 Pie Chart Showing Current Production Efficiencies Boosting Production Efficiency With Operations MKT SS V
Present the topic in a bit more detail with this Pie Chart Showing Current Production Efficiencies Boosting Production Efficiency With Operations MKT SS V. Use it as a tool for discussion and navigation on Production Unit. This template is free to edit as deemed fit for your organization. Therefore download it now.
-
 Flow of circular procedure 6 stages shown by circling arrows and pie chart powerpoint templates 0712
This PowerPoint slide is a 3D Circular Flows Chart Diagram.This chart is an effective way of displaying information you can edit text, color, shade and style as per you need
-
 Activity Based Budgeting Icon Showcasing Pie Chart
Introducing our Activity Based Budgeting Icon Showcasing Pie Chart set of slides. The topics discussed in these slides are Activity Based Budgeting, Icon Showcasing Pie Chart. This is an immediately available PowerPoint presentation that can be conveniently customized. Download it and convince your audience.
-
 4 sources shown by circle pie chart split up powerpoint diagram templates graphics 712
These high quality, editable pre-designed 4 sources shown by circle pie chart split up powerpoint diagram templates graphics 712 powerpoint slides and powerpoint templates have been carefully created by our professional team to help you impress your audience. Each graphic in every powerpoint slide is vector based and is 100% editable in powerpoint.
-
 Equity Crowdfunding Pie Chart Showing Global Investment Landscape
This slide illustrates equity crowdfunding pie chart which highlights investment landscape and market share throughout the globe. This data can be referred by those businesses which can target big names in these countries to ask for pitch fundraising events for their mutual benefit in near future. Introducing our Equity Crowdfunding Pie Chart Showing Global Investment Landscape set of slides. The topics discussed in these slides are Market Share, Investment Giants, Equity Crowdfunding. This is an immediately available PowerPoint presentation that can be conveniently customized. Download it and convince your audience.
-
 Editable Pie Chart Showing Insurance Companies Market Share
Presenting our well structured Editable Pie Chart Showing Insurance Companies Market Share. The topics discussed in this slide are Editable Pie Chart Showing Insurance Companies Market Share. This is an instantly available PowerPoint presentation that can be edited conveniently. Download it right away and captivate your audience.
-
 Editable Pie Chart Showing Revenue From US Region
Introducing our Editable Pie Chart Showing Revenue From US Region set of slides. The topics discussed in these slides are Editable Pie Chart Showing Revenue From Us Region. This is an immediately available PowerPoint presentation that can be conveniently customized. Download it and convince your audience.
-
 Editable Pie Chart Showing Strategic Management Process Steps
Presenting our well structured Editable Pie Chart Showing Strategic Management Process Steps. The topics discussed in this slide are Evaluate And Control, Formulate A Strategy, Gather And Analyse Information. This is an instantly available PowerPoint presentation that can be edited conveniently. Download it right away and captivate your audience.
-
 Pie Chart Showing Factors Impacting Project Success And Failure
The following slide depicts the major reasons for project failure to avoid future reoccurrence. It includes elements such as ineffective management practices, poorly defined objectives, technical glitches etc. Introducing our Pie Chart Showing Factors Impacting Project Success And Failure set of slides. The topics discussed in these slides are Pie Chart, Factors Impacting, Project Success, Failure. This is an immediately available PowerPoint presentation that can be conveniently customized. Download it and convince your audience.
-
 Pie Chart Showing Impact Of Staff Retention
The following slide highlights the impact of employee retention in an organization to enhance overall efficiency and increase. It constitutes of a pie chart depicting the major benefits such as increased productivity, saved recruitment cost, more experienced employees etc.Introducing our Pie Chart Showing Impact Of Staff Retention set of slides. The topics discussed in these slides are Saves Recruitment, Experienced Employees, Satisfied Customer. This is an immediately available PowerPoint presentation that can be conveniently customized. Download it and convince your audience.
-
 Pie Chart Showing Current Production Efficient Operations Planning To Increase Strategy SS V
Deliver an outstanding presentation on the topic using this Pie Chart Showing Current Production Efficient Operations Planning To Increase Strategy SS V. Dispense information and present a thorough explanation of Production, Efficiencies, Current using the slides given. This template can be altered and personalized to fit your needs. It is also available for immediate download. So grab it now.
-
 Implementing New Operational Strategy Pie Chart Showing Current Production Strategy SS
Deliver an outstanding presentation on the topic using this Implementing New Operational Strategy Pie Chart Showing Current Production Strategy SS. Dispense information and present a thorough explanation of Production, Efficiencies, Current using the slides given. This template can be altered and personalized to fit your needs. It is also available for immediate download. So grab it now.
-
 Pie Chart Showing Current Production Streamline Processes And Workflow With Operations Strategy SS V
Deliver an outstanding presentation on the topic using this Pie Chart Showing Current Production Streamline Processes And Workflow With Operations Strategy SS V. Dispense information and present a thorough explanation of Pie Chart Showing, Current Production using the slides given. This template can be altered and personalized to fit your needs. It is also available for immediate download. So grab it now.
-
 Pie Chart Showing Current Production Streamlined Operations Strategic Planning Strategy SS V
This slide provides glimpse about developing a plan for production control management that can help an organization to check and ensure manufacturing of a quality product. It includes calibration activities, data acquisition, quality control, etc. Deliver an outstanding presentation on the topic using this Pie Chart Showing Current Production Streamlined Operations Strategic Planning Strategy SS V Dispense information and present a thorough explanation of Data Acquisition, Quality Control using the slides given. This template can be altered and personalized to fit your needs. It is also available for immediate download. So grab it now.
-
 Demographics of male and female pie chart showing percentage
Presenting this set of slides with name - Demographics Of Male And Female Pie Chart Showing Percentage. This is a two stage process. The stages in this process are Population, Demographics, People Growth.
-
 Hia aids pie chart image showing data
Presenting this set of slides with name - Hia Aids Pie Chart Image Showing Data. This is a two stage process. The stages in this process are Hiv Aids, Human Immunodeficiency Virus Infection And Acquired Immune Deficiency Syndrome, Health Disasters.
-
 Project background showing completion index and pie chart
Presenting this set of slides with name - Project Background Showing Completion Index And Pie Chart. This is a four stage process. The stages in this process are Project Background, Project Management, Project Description.
-
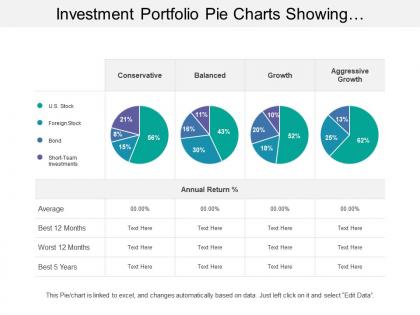 Investment portfolio pie charts showing conservative and balanced growth
Presenting this set of slides with name - Investment Portfolio Pie Charts Showing Conservative And Balanced Growth. This is a four stage process. The stages in this process are Investment Portfolio, Funding Portfolio, Expenditure Portfolio.
-
 Investment portfolio pie charts showing shares property bond cash risk investor
Presenting this set of slides with name - Investment Portfolio Pie Charts Showing Shares Property Bond Cash Risk Investor. This is a three stage process. The stages in this process are Investment Portfolio, Funding Portfolio, Expenditure Portfolio.
-
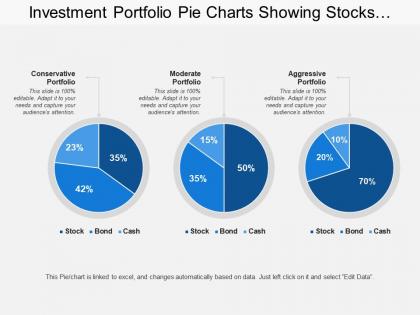 Investment portfolio pie charts showing stocks bonds cash with conservative portfolio
Presenting this set of slides with name - Investment Portfolio Pie Charts Showing Stocks Bonds Cash With Conservative Portfolio. This is a three stage process. The stages in this process are Investment Portfolio, Funding Portfolio, Expenditure Portfolio.
-
 Hr dashboard shown by pie charts hand humans
Presenting this set of slides with name - Hr Dashboard Shown By Pie Charts Hand Humans. This is a four stage process. The stages in this process are Hr Dashboard, Human Resource Dashboard, Hr Kpi.
-
 Half yearly plan shown by pie chart split up powerpoint diagram templates graphics 712
These high quality, editable pre-designed half yearly plan shown by pie chart split up powerpoint diagram templates graphics 712 powerpoint slides and powerpoint templates have been carefully created by our professional team to help you impress your audience. Each graphic in every powerpoint slide is vector based and is 100% editable in powerpoint.
-
 Icon Showing Sales Number Presentation With Pie Chart
Introducing our premium set of slides with Icon Showing Sales Number Presentation With Pie Chart. Ellicudate the three stages and present information using this PPT slide. This is a completely adaptable PowerPoint template design that can be used to interpret topics like Icon Showing Sales Number Presentation With Pie Chart. So download instantly and tailor it with your information.
-
 Pie Chart Showing Sales Split By Region
Presenting our well-structured Pie Chart Showing Sales Split By Region. The topics discussed in this slide are Pie Chart Showing, Sales Split Region. This is an instantly available PowerPoint presentation that can be edited conveniently. Download it right away and captivate your audience.
-
 Company sales pie chart report powerpoint show
Presenting company sales pie chart report powerpoint show. Presenting company sales pie chart report powerpoint show. Presenting company sales pie chart report powerpoint show. Presenting company sales pie chart report powerpoint show. This is a company sales pie chart report powerpoint show. This is a seven stage process. The stages in this process are business, strategy, marketing, shapes, process, finance.
-
 Pie chart showing sales team performance ppt examples slides
Presenting pie chart showing sales team performance ppt examples slides. This is a pie chart showing sales team performance ppt examples slides. This is a five stage process. The stages in this process are pie, percentage, communication, business, marketing.
-
 Big data benefits pie chart for business powerpoint show
Presenting big data benefits pie chart for business powerpoint show. This is a big data benefits pie chart for business powerpoint show. This is a four stage process. The stages in this process are increased efficiency, better business decision making, improved customer experience and engagement, achieved financial savings.
-
 Gender comparison pie chart powerpoint slide show
Presenting gender comparison pie chart powerpoint slide show. This is a gender comparison pie chart powerpoint slide show. This is a two stage process. The stages in this process are women, men.
-
 Pie chart to showcase sales ppt infographics
Presenting pie chart to showcase sales ppt infographics. This is a pie chart to showcase sales ppt infographics. This is a six stage process. The stages in this process are business, marketing, strategy, success, percentage.
-
 Pie chart to showcase sales of different brand products powerpoint slide images
Presenting pie chart to showcase sales of different brand products powerpoint slide images. This is a pie chart to showcase sales of different brand products powerpoint slide images. This is a five stage process. The stages in this process are business, success, strategy, finance, presentation.
-
 Industry analysis framework pie chart powerpoint slide show
Presenting industry analysis framework pie chart powerpoint slide show. This is a industry analysis framework pie chart powerpoint slide show. This is a six stage process. The stages in this process are industry analysis framework pie chart,market analysis market share brand.
-
 Pie chart to show total sales of a company powerpoint slide designs download
Presenting pie chart to show total sales of a company powerpoint slide designs download. This is a pie chart to show total sales of a company powerpoint slide designs download. This is a seven stage process. The stages in this process are depreciation, other, profit, marketing, wages, purchases, rent and utilities.
-
 Donut pie chart powerpoint slide show
Presenting donut pie chart powerpoint slide show. This is a donut pie chart powerpoint slide show. This is a four stage process. The stages in this process are business, marketing, strategy, planning, finance.
-
 Data analytics process icon showing magnifying glass with pie chart
Presenting this set of slides with name - Data Analytics Process Icon Showing Magnifying Glass With Pie Chart. This is a two stage process. The stages in this process are Data Analytics Process, Data Analysis Cycle, Data Visualization Process.
-
 Expense management icon showing pie chart
Presenting this set of slides with name - Expense Management Icon Showing Pie Chart. This is a three stage process. The stages in this process are Expense Management, Cost Management, Price Management.
-
 Telecom expense management icon showing phone with pie chart
Presenting this set of slides with name - Telecom Expense Management Icon Showing Phone With Pie Chart. This is a one stage process. The stages in this process are Expense Management, Cost Management, Price Management.
-
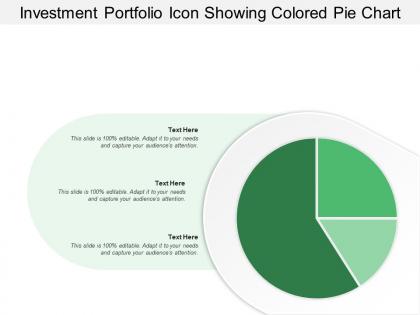 Investment portfolio icon showing colored pie chart
Presenting this set of slides with name - Investment Portfolio Icon Showing Colored Pie Chart. This is a three stage process. The stages in this process are Investment Portfolio, Funding Portfolio, Expenditure Portfolio.
-
 Investment portfolio icon showing pie chart with bar graph
Presenting this set of slides with name - Investment Portfolio Icon Showing Pie Chart With Bar Graph. This is a four stage process. The stages in this process are Investment Portfolio, Funding Portfolio, Expenditure Portfolio.
-
 Mobile analytics icon showing pie chart bar graph data analytics
Presenting this set of slides with name - Mobile Analytics Icon Showing Pie Chart Bar Graph Data Analytics. This is a one stage process. The stages in this process are Mobile Analytics, Mobile Tracking, Mobile Web Analytics.
-
 Mobile analytics showing magnifying glass and pie chart
Presenting this set of slides with name - Mobile Analytics Showing Magnifying Glass And Pie Chart. This is a four stage process. The stages in this process are Mobile Analytics, Mobile Tracking, Mobile Web Analytics.
-
 Financial statements icon showing euro and pie chart
Presenting this set of slides with name - Financial Statements Icon Showing Euro And Pie Chart. This is a three stage process. The stages in this process are Financial Statements Icon, Accounting Ratio Icon, Balance Sheet Icon.
-
 Financial statements icon showing line art and pie chart
Presenting this set of slides with name - Financial Statements Icon Showing Line Art And Pie Chart. This is a three stage process. The stages in this process are Financial Statements Icon, Accounting Ratio Icon, Balance Sheet Icon.
-
 Sectioned circle icon showing pie chart with three segment
Presenting this set of slides with name - Sectioned Circle Icon Showing Pie Chart With Three Segment. This is a three stage process. The stages in this process are Sectioned Circle, Segmented Circle, Partitioned Circle.
-
 Sectioned circle showing pie chart with one segment
Presenting this set of slides with name - Sectioned Circle Showing Pie Chart With One Segment. This is a three stage process. The stages in this process are Sectioned Circle, Segmented Circle, Partitioned Circle.
-
 Kpi icon showing magnifying glass bar graph and pie chart
Presenting this set of slides with name - Kpi Icon Showing Magnifying Glass Bar Graph And Pie Chart. This is a four stage process. The stages in this process are Kpi Icon, Metircs Icon, Dashboard Icon.
-
 Kpi icon showing pie chart and bar graph in monitor
Presenting this set of slides with name - Kpi Icon Showing Pie Chart And Bar Graph In Monitor. This is a four stage process. The stages in this process are Kpi Icon, Metircs Icon, Dashboard Icon.
-
 Growth showing pie chart in circle icon
Presenting growth showing pie chart in circle icon. This is a growth showing pie chart in circle icon. This is a three stage process. The stages in this process are growth icons, improvement icons, enhancement icons.
-
 Growth and support shown by humans and pie chart stairs
Presenting growth and support shown by humans and pie chart stairs. This is a growth and support shown by humans and pie chart stairs. This is a eight stage process. The stages in this process are growth and support, improvement and support, growth and help.
-
 Printer icon showing pie chart on a4 sheet
Presenting printer icon showing pie chart on a4 sheet. This is a printer icon showing pie chart on a4 sheet. This is a two stage process. The stages in this process are printer icon, scan icon, photostat icon.
-
 Population icon showing human population with pie chart
Presenting population icon showing human population with pie chart. This is a population icon showing human population with pie chart. This is a four stage process. The stages in this process are population icon, demographics icon, people growth icon.
-
 Stats showing pie chart seo projects mobile projects and web projects
Presenting this set of slides with name - Stats Showing Pie Chart Seo Projects Mobile Projects And Web Projects. This is a three stage process. The stages in this process are Stats, Statistics, Data.
-
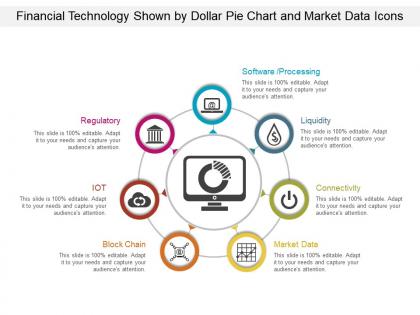 Financial technology shown by dollar pie chart and market data icons
Presenting this set of slides with name - Financial Technology Shown By Dollar Pie Chart And Market Data Icons. This is a seven stage process. The stages in this process are Financial Technology, Fintech, Financial Services.
-
 Overlapping circles eight steps showing dollar bar graph and pie chart
Presenting this set of slides with name - Overlapping Circles Eight Steps Showing Dollar Bar Graph And Pie Chart. This is a eight stage process. The stages in this process are Three Overlapping Circles, Three Interconnected Circle, Venn Diagram.
-
 Overlapping circles five elements of different size showing pencil and pie chart
Presenting this set of slides with name - Overlapping Circles Five Elements Of Different Size Showing Pencil And Pie Chart. This is a five stage process. The stages in this process are Three Overlapping Circles, Three Interconnected Circle, Venn Diagram.
-
 Overlapping circles four elements of different size showing pencil and pie chart
Presenting this set of slides with name - Overlapping Circles Four Elements Of Different Size Showing Pencil And Pie Chart. This is a four stage process. The stages in this process are Three Overlapping Circles, Three Interconnected Circle, Venn Diagram.
-
 Overlapping circles nine steps showing dollar bar graph and pie chart
Presenting this set of slides with name - Overlapping Circles Nine Steps Showing Dollar Bar Graph And Pie Chart. This is a nine stage process. The stages in this process are Three Overlapping Circles, Three Interconnected Circle, Venn Diagram.


