Powerpoint Templates and Google slides for Performance Dashboards
Save Your Time and attract your audience with our fully editable PPT Templates and Slides.
-
 Data Schema In DBMS Data Model Performance Tracking Dashboard
This slide shows the data model performance tracking dashboard. The purpose of this slide is to represent the Information related to the change brought by data models graphically. Deliver an outstanding presentation on the topic using this Data Schema In DBMS Data Model Performance Tracking Dashboard. Dispense information and present a thorough explanation of Database Users, Database Performance, Server Space using the slides given. This template can be altered and personalized to fit your needs. It is also available for immediate download. So grab it now.
-
 Material Control System Performance Tracking Dashboard
This slide represents dashboard showcasing supplier performance which helps in improving material control system processes. It provides information regarding supplier statistics, material compliance rate, top raw material suppliers, average material procurement cycle. Present the topic in a bit more detail with this Material Control System Performance Tracking Dashboard. Use it as a tool for discussion and navigation on Supplier Statistics, Material Compliance, Average Material Procurement. This template is free to edit as deemed fit for your organization. Therefore download it now.
-
 Website Performance Tracking And Monitoring Dashboard Performance Improvement Plan
The following slide showcases a dashboard to track and measure website performance. It includes key elements such as visits, average session duration, bounce rate, page views, goal conversion, visits by week, traffic sources, top channels by conversions, etc. Present the topic in a bit more detail with this Website Performance Tracking And Monitoring Dashboard Performance Improvement Plan. Use it as a tool for discussion and navigation on Channels By Conversion, Website Performance, Monitoring Dashboard. This template is free to edit as deemed fit for your organization. Therefore download it now.
-
 Marketing Campaign Performance Management Dashboard Guide For Situation Analysis To Develop MKT SS V
This slide presents a dashboard ti track and measure performance of marketing campaign for effective decision making. It provides information about bounce rate, new users, users, average session duration, page performance, page path, average time on page, goal conversion rate and goal completions. Deliver an outstanding presentation on the topic using this Marketing Campaign Performance Management Dashboard Guide For Situation Analysis To Develop MKT SS V. Dispense information and present a thorough explanation of Marketing Campaign Performance, Management Dashboard using the slides given. This template can be altered and personalized to fit your needs. It is also available for immediate download. So grab it now.
-
 Digital Marketing Program Dashboard To Evaluate Marketing Campaign Performance
This slide represents dashboard to evaluate marketing campaign performance. It includes revenue, sales, total orders, order value, conversion rate etc. Present the topic in a bit more detail with this Digital Marketing Program Dashboard To Evaluate Marketing Campaign Performance. Use it as a tool for discussion and navigation on Returning Customer Purchases, Dashboard To Evaluate Marketing, Campaign Performance. This template is free to edit as deemed fit for your organization. Therefore download it now.
-
 Dashboard To Track Performance Of Multiple Chatbots AI Chatbot For Different Industries AI SS
This slide showcases dashboard that can help organization to evaluate the performance of multiple chatbots. Its key elements are total bot conversations, bot sessions, engagement rate, bot escalation rate and chatbot metrics. Deliver an outstanding presentation on the topic using this Dashboard To Track Performance Of Multiple Chatbots AI Chatbot For Different Industries AI SS. Dispense information and present a thorough explanation of Engagement Rate, Resolution Rate, Escalation Rate, Abandon Rate using the slides given. This template can be altered and personalized to fit your needs. It is also available for immediate download. So grab it now.
-
 Effective Marketing Strategies Dashboard To Track Online Sales Performance
Following slide exhibits dashboard that help organizations to measure performance of online sales. It include parameters such as number of new customers, sales revenue, profit, sales growth rate, customer acquisition cost etc. Present the topic in a bit more detail with this Effective Marketing Strategies Dashboard To Track Online Sales Performance. Use it as a tool for discussion and navigation on Dashboard To Track, Online Sales Performance, Sales Growth Rate, Customer Acquisition Cost. This template is free to edit as deemed fit for your organization. Therefore download it now.
-
 Effective Marketing Strategies KPI Dashboard To Measure Online Website Performance
Following slide exhibits dashboard to track and measure performance of online shopping website of company. It include indicators such as sales, gross profit, conversion rates, site traffic, number of shares and transactions etc. Present the topic in a bit more detail with this Effective Marketing Strategies KPI Dashboard To Measure Online Website Performance. Use it as a tool for discussion and navigation on KPI Dashboard, Online Website Performance, Conversion Rate. This template is free to edit as deemed fit for your organization. Therefore download it now.
-
 Developing Winning Brand Strategy Dashboard Showing Performance Of Various Marketing
The following slide outlines the key performance indicator dashboard used by the organization to evaluate the effectiveness of multiple marketing campaigns. It provides information about total spending, impressions, acquisitions, cost per acquisition, clicks, etc. Present the topic in a bit more detail with this Developing Winning Brand Strategy Dashboard Showing Performance Of Various Marketing. Use it as a tool for discussion and navigation on Dashboard Showing Performance, Marketing Campaigns, Impressions, Acquisitions, Cost Per Acquisition. This template is free to edit as deemed fit for your organization. Therefore download it now.
-
 Company xyz monthly business review showing marketing performance dashboard
Presenting this set of slides with name - Company Xyz Monthly Business Review Showing Marketing Performance Dashboard. This is a five stage process. The stages in this process are Monthly Business Review, Monthly Business Report, Monthly Company Review.
-
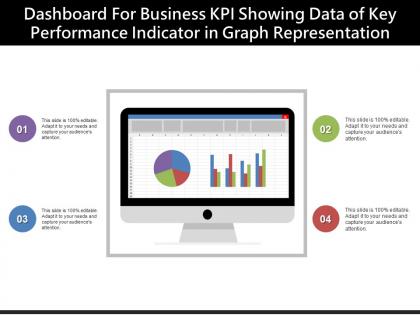 Dashboard for business kpi showing data of key performance indicator in graph representation
Presenting this set of slides with name - Dashboard For Business Kpi Showing Data Of Key Performance Indicator In Graph Representation. This is a four stage process. The stages in this process are Business Kpi, Business Dashboard, Business Metrics.
-
 Risk Management Kpi Dashboard Showing Open Issues And Control Performance
Presenting this set of slides with name - Risk Management Kpi Dashboard Showing Open Issues And Control Performance. This is a five stage process. The stages in this process are Risk Management, Risk Assessment, Project Risk.
-
 Financial performance kpi dashboard showing asset allocation balance sheet
Presenting this set of slides with name - Financial Performance Kpi Dashboard Showing Asset Allocation Balance Sheet. This is a two stage process. The stages in this process are Financial Performance, Financial Report, Financial Review.
-
 Financial performance kpi dashboard showing benchmark vs cash position
Presenting this set of slides with name - Financial Performance Kpi Dashboard Showing Benchmark Vs Cash Position. This is a four stage process. The stages in this process are Financial Performance, Financial Report, Financial Review.
-
 Financial performance kpi dashboard showing burn rate opex ratio gross profit
Presenting this set of slides with name - Financial Performance Kpi Dashboard Showing Burn Rate Opex Ratio Gross Profit. This is a four stage process. The stages in this process are Financial Performance, Financial Report, Financial Review.
-
 Financial performance kpi dashboard showing gross profit margin sales growth operating cash flow
Presenting this set of slides with name - Financial Performance Kpi Dashboard Showing Gross Profit Margin Sales Growth Operating Cash Flow. This is a three stage process. The stages in this process are Financial Performance, Financial Report, Financial Review.
-
 Financial performance kpi dashboard showing income expenses monthly revenue
Presenting this set of slides with name - Financial Performance Kpi Dashboard Showing Income Expenses Monthly Revenue. This is a four stage process. The stages in this process are Financial Performance, Financial Report, Financial Review.
-
 Financial performance kpi dashboard showing payroll headcount ratio cost per lead
Presenting this set of slides with name - Financial Performance Kpi Dashboard Showing Payroll Headcount Ratio Cost Per Lead. This is a seven stage process. The stages in this process are Financial Performance, Financial Report, Financial Review.
-
 Financial performance kpi dashboard showing quick ratio current ratio working capital
Presenting this set of slides with name - Financial Performance Kpi Dashboard Showing Quick Ratio Current Ratio Working Capital. This is a three stage process. The stages in this process are Financial Performance, Financial Report, Financial Review.
-
 Financial performance kpi dashboard showing regional sales status cash and ratios
Presenting this set of slides with name - Financial Performance Kpi Dashboard Showing Regional Sales Status Cash And Ratios. This is a four stage process. The stages in this process are Financial Performance, Financial Report, Financial Review.
-
 Financial performance kpi dashboard showing revenue quick ratio short term assets
Presenting this set of slides with name - Financial Performance Kpi Dashboard Showing Revenue Quick Ratio Short Term Assets. This is a four stage process. The stages in this process are Financial Performance, Financial Report, Financial Review.
-
 Financial performance kpi dashboard showing sales growth average purchase value
Presenting this set of slides with name - Financial Performance Kpi Dashboard Showing Sales Growth Average Purchase Value. This is a three stage process. The stages in this process are Financial Performance, Financial Report, Financial Review.
-
 R and d kpi dashboard showing performance and expenditure by year
Presenting this set of slides with name - R And D Kpi Dashboard Showing Performance And Expenditure By Year. This is a four stage process. The stages in this process are R And D, Research And Development, Research And Technological Development.
-
 Hr dashboard snapshot recruitment performance key metrics
Presenting this set of slides with name - Hr Dashboard Snapshot Recruitment Performance Key Metrics. This is a four stage process. The stages in this process are Hr Dashboard, Human Resource Dashboard, Hr Kpi.
-
 Business intelligence market analytics and performance dashboard
Presenting this set of slides with name - Business Intelligence Market Analytics And Performance Dashboard. This is a three stage process. The stages in this process are Business Understanding, Business Intelligence, Business Knowledge.
-
 Executing reporting kpi dashboard showing trading summary performance summary and sales ratio
Presenting this set of slides with name - Executing Reporting Kpi Dashboard Showing Trading Summary Performance Summary And Sales Ratio. This is a four stage process. The stages in this process are Executive Reporting, Executive Analysis, Executive Performance.
-
 Property and facility kpi dashboard showing sales trend and sales performance
Grab an opportunity to see, property and facility KPI dashboard showing sales trend and sales performance PowerPoint Presentation Slide. This Presentation has been designed under the strict supervision of professionals and is fully editable. You can have access to play with the font size, font type, colors, and even the background. This Template is achievable with Google Slide and can be saved in JPG or PDF format without any obstacles created during the saving process. Fast download at the click of the button.
-
 Warehousing kpi dashboard showing weekly performance by picker
The best part of this PPT design is the use of excel linked editable charts. You can change your business related information, statistics and figures in excel sheet and changes will reflect in PPT design. PPT design is 100% editable; you can change the design elements according to your business needs. You can download and save this design as JPEG or PDF formats. Design is fully supported on Google Slides and MS PowerPoint software.
-
 Logistics performance dashboard with inventory and shipping
Presenting Logistics Performance Dashboard With Inventory And Shipping PPT slide. The performance dashboard PowerPoint template designed by the professional team of SlideTeam to present yearly sales, productivity, and profit. The text and image in logistics dashboard slide are customizable in PowerPoint and can help you in sharing the sale target. The logistics performance dashboard slide is compatible with Google Slide which makes easy for a presenter to present his view points about business managing. An individual can do changes in the font size, font type, color and dimensions of the image to present the desired sales value. A user can easily edit the text as well as modify to fit his needs and can add text in the placeholder.
-
 Workforce kpi dashboard showing resignation rate manager instability rate and performance workflow process
Presenting this set of slides with name - Workforce Kpi Dashboard Showing Resignation Rate Manager Instability Rate And Performance Workflow Process. This is a six stage process. The stages in this process are Staff, Personnel, Workforce.
-
 Workforce planning kpi dashboard showing salary merit bonus headcount and performance
Presenting this set of slides with name - Workforce Planning Kpi Dashboard Showing Salary Merit Bonus Headcount And Performance. This is a five stage process. The stages in this process are Staff, Personnel, Workforce.
-
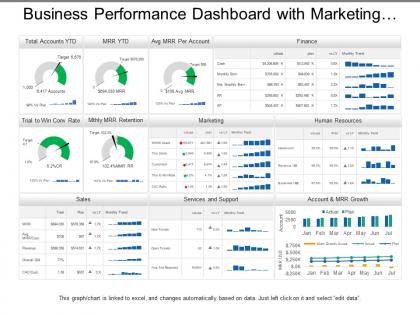 Business performance dashboard with marketing human resource and sales
Presenting, business performance dashboard with marketing human resource and sales PPT deck. This PPT deck focuses on one of the aspects of business marketing with content broadly researched by our business research team. Quickly editable color combinations, layout, text boxes, and font. Alluring graphs for illustration with relatable images to explain the concept. Transform into PDF and JPG format at ease. Predesigned content is adaptable and can be projected to widescreen for business meetings.
-
 Business performance dashboards snapshot with accounts and mrr growth
Presenting, our business performance dashboards snapshot with accounts and mr growth PPT layout. High pixel resolution of the designs. Easy to edit and save using google slides. 100% modification of the slides granted. Apply your company name, replacing the official trademark in the slides. Valuable for the Marketing Professionals, business managers, and the directors. Includes extensive text spaces to include a title and can be easily projected to a widescreen.
-
 Business performance dashboards with accounts receivable and accounts payable
Presenting business performance dashboards with accounts receivable and accounts payable PPT template. These PPT graphics allow you to resize and recolor the images. Good quality images can be used to complement and reinforce the learning. Works well with all software's and Google Slides. Editing in display slideshow can be done from wherever by compatible devices. Convert PPT to PDF at ease.
-
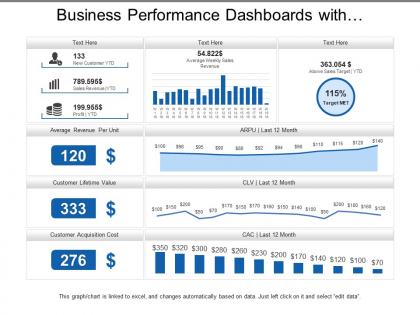 Business performance dashboards with average revenue and customer lifetime value
Presenting, our business performance dashboards with average revenue and customer lifetime value PPT template. You can download this engaging PPT template and take a report of the full version of this PPT deck which includes editing the text, adjusting the colors according to your liking, watermark gets expelled, include your company's logo and get slides in widescreen version.
-
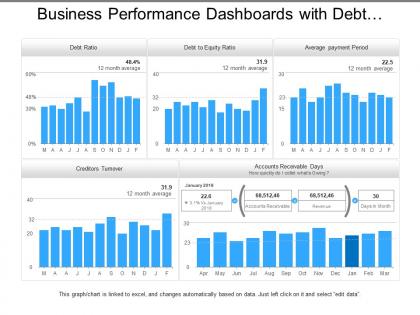 Business performance dashboards with debt equity ratio
Presenting, business performance dashboards with debt-equity ratio PPT deck, that can be used by businesses experts for their business performance indication Presentations. The issues and data shown in the flat design can be quickly edited in respect with color, text, and fonts by just by following few steps. The color and orientation of the elements can also be adjusted easily. This PPT slide is cooperative with Google Slides and can be obtained in pdf or jpeg format.
-
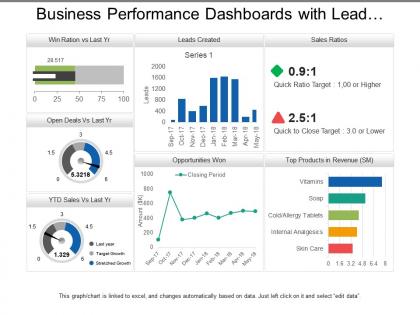 Business performance dashboards with lead creation and sales ratios
Presenting, business performance dashboards with lead creation and sales ratios for cost efficiency and performance indication PPT presentation. Bright and informative PowerPoint presentation slides. Gives regulations to achieve business success and targets. Produces error-free execution. Acts as a model for planning future assignments for marketing capabilities. Fully editable by any user at any point in time. Performs a clarity of marketing and presentation objectives without creating any confusions and misconceptions. Simple to be projected to widescreen without degradation in quality.
-
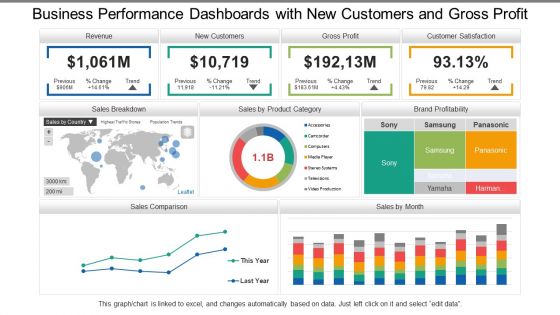 Business Performance Dashboards Snapshot With New Customers And Gross Profit
Presenting, business performance dashboards Snapshot with new customers and gross profit PowerPoint ideas for your ease. Information based slides, creating an impact on the viewer, can be used by specialists from any background, entrepreneurs, and scholars. Engaging and editable font style, type, text design and the content of the icons or the PPT slides. Full-screen view choice available and can be transformed into the desired format. Compatible with Google Slides. Open in widescreen size 16:9 after downloading.
-
 Business performance dashboards with revenue and ratios
Presenting, our business performance dashboards with revenue and ratios PPT deck. Pre-designed chart sheet directed PowerPoint Presentation template. Administration of high-resolution images, graphs, and comparison diagrams. Filled with methods and effects to create an impact. Can be quickly converted into JPEG/JPG or PDF formats as per the requirements. Congenial with Google Slides for ease. Project to widescreen without cringing about pixelating, after downloading explore these characteristics.
-
 Business performance dashboards with total accounts marketing and product
Presenting, business performance dashboards with total accounts marketing and product PowerPoint template. High-resolution PPT slide to reflect on business performance. The content is accurate and ready to use. Modifiable framework, layout, and font type, font size, and color schemes. Can be quickly transformed into PDF and JPG format. Appealing graphs for illustration and captivating figures to illustrate the idea. Can be extended to widescreen without loss of quality. Compatible with Google Slides and widescreens.
-
 Business performance dashboards with total assets gross profit and cash flow
Presenting, business performance dashboards with total assets gross profit and cash flow PPT deck. Adjustable color, text, and font as per the need. Engaging and easy to comprehend infographic format. Even download and can be converted into JPG and PDF format. The advantage of the addition of logo and trademarks for personalization. Adaptable to widescreen view without the problem of pixelation. Exposition illustration well-matched with google slides. Related designs available with different nodes and stages. Possible in 4:3 and full-screen version 16:9
-
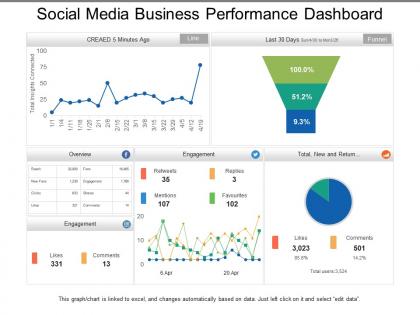 Social media business performance dashboard
Presenting, agile development showing product owner with iteration plan and planning meeting PPT template. This PPT slide can be used for agile development and sprint planning related presentations by experts, students or strategists. All the icons practiced here are 100% editable in PowerPoint software. You can change the color, size, and format of any icon to your liking. Insert your business logo in the PPT slide, which is also compatible with google slides.
-
 Social media business performance dashboards with total leads
Presenting this set of slides with name - Social Media Business Performance Dashboards With Total Leads. This is a three stage process. The stages in this process are Business Dashboard, Business Kpi, Business Performance.
-
 Technology kpi dashboard showing percent availability and performance
Displaying Technology KPI dashboard percent availability PowerPoint design. Colors and text can be easily changed as the PPT slide is completely editable. Modify the design with brand name and logo. Presentation diagram is available both Standard and Widescreen slide. Fast and easy download with saving options. Adaptable with other software’s such as PDF or JPG formats. PowerPoint graphic is fully compatible with Google slides as can be merged with them accordingly.
-
 Campaign performance e commerce dashboard
Presenting this set of slides with name - Campaign Performance E Commerce Dashboard. This is a six stage process. The stages in this process are Mercantilism, Commercialism, Ecommerce.
-
 Sales performance and product revenue dashboard
Presenting this set of slides with name - Sales Performance And Product Revenue Dashboard. Amazing representation of content used in the PowerPoint slide. Good quality pixels used in the designing. High resolution presentation design does not affect the quality even when projected on wide screen. Easy convert into different formats such as JPG and PDF. Compatible with maximum number of software and Google slides. Easy to add and remove content as per business need. Totally modifiable PPT template as text, icons and graphics are editable. Insert Company’s personalized content and logo.
-
 Accounting dashboard with global financial performance
Pre-designed accounting dashboard with global financial performance PPT template. High-resolution PowerPoint presentation backgrounds for better clarity of the information displayed. Offers wide variety of options and colors to alter the appearance. Allows adding of enterprise personal details such as brand name, logo and much more. Enough space available to enter text and its related points in the PPT table. This slide is available in both Standard and Widescreen slide size. Compatible with multiple formats like JPEG, PDF and Google slides.
-
 Inventory and logistics global financial performance dashboards
Presenting this set of slides with name - Inventory And Logistics Global Financial Performance Dashboards. This is a two stage process. The stages in this process are Inventory And Logistics, Inventory Management, Warehousing And Inventory Management.
-
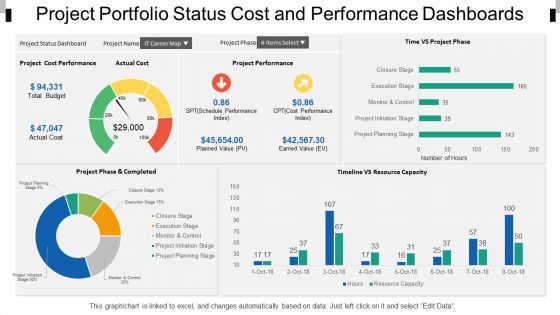 Project portfolio status cost and performance dashboards snapshot
Presenting, project portfolio status cost and performance dashboards snapshot. This is an appealing design for project portfolio status cost and performance focused PowerPoint presentation. This PPT template can be used by experts from various backgrounds to present their ideas in a contemporary way. This slide is cooperative with google slides and after downloading you can use it in full version and insert your company's logo for your best practice. Unique thinking to mesmerize your audience. Fully editable PowerPoint colors, orientation, text, and graphics.
-
 Business analytics dashboard snapshot with net sales product inventory purchases and performance
This is a five stage process. The stages in this process are Business Analytics, BA, Organizations Data.
-
 Employee performance evaluation dashboard ppt powerpoint presentation outline cpb
Presenting Employee Performance Evaluation Dashboard Ppt Powerpoint Presentation Outline Cpb slide which is completely adaptable. The graphics in this PowerPoint slide showcase two stages that will help you succinctly convey the information. In addition, you can alternate the color, font size, font type, and shapes of this PPT layout according to your content. This PPT presentation can be accessed with Google Slides and is available in both standard screen and widescreen aspect ratios. It is also a useful set to elucidate topics like Employee Performance Evaluation Dashboard. This well structured design can be downloaded in different formats like PDF, JPG, and PNG. So, without any delay, click on the download button now.
-
 Company department cultural dashboard shaping organizational practice and performance
The purpose of this slide is to provide a graph showing the production and sales over the last 4 years in the organization, also defining the rationale behind the decrease in production and sales within the company. Deliver an outstanding presentation on the topic using this Company Department Cultural Dashboard Shaping Organizational Practice And Performance. Dispense information and present a thorough explanation of Company Culture, Average Per Department using the slides given. This template can be altered and personalized to fit your needs. It is also available for immediate download. So grab it now.
-
 Organization culture dashboard shaping organizational practice and performance ppt ideas
This slide covers the company culture dashboard which focuses on different important aspects such as willingness to learn, morale, customer focus, goal orientation, etc. Deliver an outstanding presentation on the topic using this Organization Culture Dashboard Shaping Organizational Practice And Performance Ppt Ideas. Dispense information and present a thorough explanation of Collaboration, Customer Focus, Goal Orientation using the slides given. This template can be altered and personalized to fit your needs. It is also available for immediate download. So grab it now.
-
 Fiber distributed data interface it performance dashboard snapshot post fddi implementation
This slide shows the performance dashboard after the implementation based on network topology, node details, changes in default route, and so on. Deliver an outstanding presentation on the topic using this Fiber Distributed Data Interface It Performance Dashboard Snapshot Post Fddi Implementation. Dispense information and present a thorough explanation of Performance, Dashboard, Implementation using the slides given. This template can be altered and personalized to fit your needs. It is also available for immediate download. So grab it now.
-
 Analyst Evaluating Communication Metrics Dashboard for Performance Management
Presenting our set of slides with Analyst Evaluating Communication Metrics Dashboard for Performance Management. This exhibits information on four stages of the process. This is an easy to edit and innovatively designed PowerPoint template. So download immediately and highlight information on Analyst Evaluating Communication Metrics Dashboard For Performance Management.
-
 Employee Engagement Performance Dashboard Complete Guide To Employee
This slide shows a Employee Engagement Performance Dashboard with variables such as engagement score, participation rate, NPS net promoter score, engagement score by driver etc. Present the topic in a bit more detail with this Employee Engagement Performance Dashboard Complete Guide To Employee Use it as a tool for discussion and navigation on Employee Engagement Performance Dashboard With Participation Rate This template is free to edit as deemed fit for your organization. Therefore download it now.
-
 Vendor performance dashboard with payment status
Introducing our Vendor Performance Dashboard With Payment Status set of slides. The topics discussed in these slides are Vendor Performance Dashboard With Payment Status. This is an immediately available PowerPoint presentation that can be conveniently customized. Download it and convince your audience.
-
 Proficiency management dashboard for team performance assessment
Introducing our premium set of slides with Proficiency Management Dashboard For Team Performance Assessment. Ellicudate the three stages and present information using this PPT slide. This is a completely adaptable PowerPoint template design that can be used to interpret topics like Proficiency Management Dashboard For Team Performance Assessment. So download instantly and tailor it with your information.
-
 Staff Key Performance Indicators Dashboard Icon
Presenting our well structured Staff Key Performance Indicators Dashboard Icon. The topics discussed in this slide are Staff Key Performance Indicators Dashboard Icon. This is an instantly available PowerPoint presentation that can be edited conveniently. Download it right away and captivate your audience.
-
 Icon For Risk Key Performance Indicators Dashboard
Presenting our set of slides with Icon For Risk Key Performance Indicators Dashboard. This exhibits information on four stages of the process. This is an easy to edit and innovatively designed PowerPoint template. So download immediately and highlight information on Icon For Risk Key Performance Indicators Dashboard.


