Powerpoint Templates and Google slides for Not Completed
Save Your Time and attract your audience with our fully editable PPT Templates and Slides.
-
 Project progress showing completed deferred not started
Presenting this set of slides with name - Project Progress Showing Completed Deferred Not Started. This is a four stage process. The stages in this process are Project Progress, Project Growth, Project Management.
-
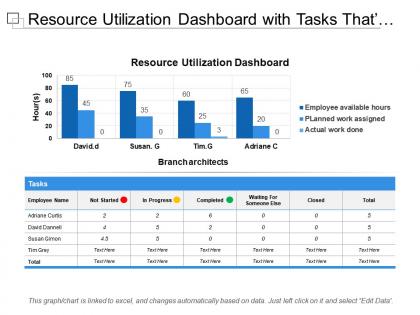
 Resource utilization dashboard with tasks thats not completed in progress completed
Presenting this set of slides with name - Resource Utilization Dashboard With Tasks Thats Not Completed In Progress Completed. This is a four stage process. The stages in this process are Resource Management, Resource Utilization, Resource Allocation.
-
 Project progress with project on hold completed and not started
Presenting this set of slides with name - Project Progress With Project On Hold Completed And Not Started. This is a four stage process. The stages in this process are Project Progress, Project Growth, Project Management.
-
 Education completion for 25 years white alone not latino for graduate degree in us 2015-22
Presenting this set of slides with name - Education Completion For 25 Years White Alone Not Latino For Graduate Degree In US 2015-22. Sex By Educational Attainment For The Population 25 Years And Over White Alone Not Hispanic Or Latino For Graduate Degree In The U.S Estimated From 2015 to 22. This is part of our Data and Statistics products selection, and you will need a Paid account to download the actual report with accurate data. Downloaded report will contain the actual editable graph with the actual data, an excel table with the actual data, the exact source of the data and the release date. This graph shows Educational Attainment for Graduate or professional degree by Male and Female for the population 25 years and over White Alone Not Hispanic Or Latino in the U.S from 2015 to 2017 and Forecasts for 2018 to 22. It covers topic Educational Attainment for Graduate or professional degree for region USA and is for date range 2015 to 22. Download it immediately and use it for your business.
-
 Educational completion by sex for 25 years over white alone not hispanic for high school diploma us 2015-2017
Presenting this set of slides with name - Educational Completion By Sex For 25 Years Over White Alone Not Hispanic For High School Diploma US 2015-2017. Sex By Educational Attainment For The Population 25 Years And Over White Alone Not Hispanic Or Latino For Regular High School Diploma In The U.S From 2015 TO 17. This is part of our Data and Statistics products selection, and you will need a Paid account to download the actual report with accurate data. Downloaded report will contain the actual editable graph with the actual data, an excel table with the actual data, the exact source of the data and the release date. This graph shows Educational Attainment for Regular high school diploma by Male and Female for the population 25 years and over White Alone Not Hispanic Or Latino in the U.S from 2015 TO 2017. It covers topic Educational Attainment for Regular high school diploma by sex for region USA and is for date range 2015 TO 17. Download it immediately and use it for your business.
-
 Sprint report with complete and not complete issues
Presenting this set of slides with name Sprint Report With Complete And Not Complete Issues. The topics discussed in these slides are Completed Issues, Not Complete Issues, Priority. This is a completely editable PowerPoint presentation and is available for immediate download. Download now and impress your audience.


