Powerpoint Templates and Google slides for Measurement Business
Save Your Time and attract your audience with our fully editable PPT Templates and Slides.
-
 Piggery Farming Business Plan Balance Sheet Measuring Business Position During The Forecasted BP SS
The slides cover the snapshot of the company financial position at a specific time. It shows the assets and liabilities of the company from the year 2023 till the forecasted year 2027. Present the topic in a bit more detail with this Piggery Farming Business Plan Balance Sheet Measuring Business Position During The Forecasted BP SS. Use it as a tool for discussion and navigation on Measuring Business Position, Assets And Liabilities, Depreciation Schedule Of Equipments. This template is free to edit as deemed fit for your organization. Therefore download it now.
-
 Piggery Farming Business Plan Cash Flow Statement Measuring Cash Inflows And Outflows BP SS
The slides highlight the cash flow statement of the company. It represents net cash flow from operating, investing, and financing activities from the year 2023 till 2027. Deliver an outstanding presentation on the topic using this Piggery Farming Business Plan Cash Flow Statement Measuring Cash Inflows And Outflows BP SS. Dispense information and present a thorough explanation of Cash Flow Statement, Cash Inflows And Outflows, Investing And Financing Activities using the slides given. This template can be altered and personalized to fit your needs. It is also available for immediate download. So grab it now.
-
 Piggery Farming Business Plan Profit And Loss Account Statement Measuring Business Expense BP SS
The slides provide a glimpse of the projected profit and loss statement to visualize the platforms financial performance for the next five years. The key components are total revenue from operations, gross profit, EBITDA, etc. Present the topic in a bit more detail with this Piggery Farming Business Plan Profit And Loss Account Statement Measuring Business Expense BP SS. Use it as a tool for discussion and navigation on Profit And Loss Account Statement, Business Expense And Earnings, Revenue From Operations, Gross Profit. This template is free to edit as deemed fit for your organization. Therefore download it now.
-
 KPIs To Measure Data Quality For Business Assessment
This slide represents data quality measurement KPIs for business assessment such as ratio of data to errors, data transformation error rate, etc. Introducing our premium set of slides with KPIs To Measure Data Quality For Business Assessment Ellicudate the four stages and present information using this PPT slide. This is a completely adaptable PowerPoint template design that can be used to interpret topics like Data Transformation Error Rates, Number Of Empty Values So download instantly and tailor it with your information.
-
 Measuring Quality KPIs To Track Pharmaceutical Business Performance
This slide represents various KPIs to measure performance quality of pharmaceutical business such as lot acceptance rate, calibration timeliness, etc. Introducing our Measuring Quality KPIs To Track Pharmaceutical Business Performance set of slides. The topics discussed in these slides are Manufacturing Process Performance, Laboratory Performance, Supply Chain RobustnessThis is an immediately available PowerPoint presentation that can be conveniently customized. Download it and convince your audience.
-
 Central Idea Business Successful Marketing Strategies Arrows Circle Measure Goals Improvement
This complete presentation has PPT slides on wide range of topics highlighting the core areas of your business needs. It has professionally designed templates with relevant visuals and subject driven content. This presentation deck has total of nine slides. Get access to the customizable templates. Our designers have created editable templates for your convenience. You can edit the colour, text and font size as per your need. You can add or delete the content if required. You are just a click to away to have this ready-made presentation. Click the download button now.
-
 Cash Flow Dashboard Measuring Business Performance Using Kpis
Following slide covers cash flow dashboard covering details like beginning cash on hand, cash going in, cash going out, profit or loss and ending cash on hand. It also includes detail of accounts receivable and payable. Present the topic in a bit more detail with this Cash Flow Dashboard Measuring Business Performance Using Kpis. Use it as a tool for discussion and navigation on Dashboard, Accounts, Receivable. This template is free to edit as deemed fit for your organization. Therefore download it now.
-
 Customer Satisfaction Dashboard Measuring Business Performance Using Kpis
Mentioned slide covers customer satisfaction dashboard with a 12-month format. It includes customer satisfaction details by region and by district. Deliver an outstanding presentation on the topic using this Customer Satisfaction Dashboard Measuring Business Performance Using Kpis. Dispense information and present a thorough explanation of Customer, Satisfaction, Dashboard using the slides given. This template can be altered and personalized to fit your needs. It is also available for immediate download. So grab it now.
-
 Customer Service Dashboard Snapshot Measuring Business Performance Using Kpis
Following slide illustrates customer service dashboard covering details such as request answered, total requests, total revenue and support cost revenue. It also includes customer satisfaction score, customer retention in a 12 months format. Present the topic in a bit more detail with this Customer Service Dashboard Snapshot Measuring Business Performance Using Kpis. Use it as a tool for discussion and navigation on Customer, Service, Dashboard. This template is free to edit as deemed fit for your organization. Therefore download it now.
-
 Download measuring the business value diagram powerpoint presentation
Presenting download measuring the business value diagram powerpoint presentation. This is a measuring the business value diagram powerpoint presentation. This is a five stage process. The stages in this process are define business goals, identify user personas, create adoption plan and kpis, execute plan and measure success, refine plan and adjust kpis.
-
 Apt business performance measures example of ppt presentation
Presenting apt business performance measures example of ppt presentation. This is a business performance measures example of ppt presentation. This is a five stage process. The stages in this process are vision and strategy, finance, sales and marketing, people, operations.
-
 Factors of business measures ppt slide styles
Presenting factors of business measures ppt slide styles. This is a factors of business measures ppt slide styles. This is a five stage process. The stages in this process are client satisfaction, costs, market share, efficiency, revenue.
-
 Sustainable business innovation measures ppt presentation graphics
Presenting sustainable business innovation measures ppt presentation graphics. This is a sustainable business innovation measures ppt presentation graphics. This is a three stage process. The stages in this process are be familiar with, value streams, information.
-
 How to measure and improve the business value of it service business value metrics it spend customer
This template covers IT business value metrics aligned to a business value such as IT spend by business unit, customer satisfaction scores for business facing services, and percent of IT investment by business initiative. Present the topic in a bit more detail with this How To Measure And Improve The Business Value Of IT Service Business Value Metrics IT Spend Customer. Use it as a tool for discussion and navigation on IT Investment, Business Initiative, Customer Satisfaction, business facing services, Business Unit Total IT Spend YTD, Sales, Finance. This template is free to edit as deemed fit for your organization. Therefore download it now.
-
 How to measure and improve the business value of it service innovation and agility metrics service delivery
This template covers IT service innovation and agility metrics aligned to a business value such as percent of IT investment on run, grow, transform the business and percent of project spend on customer-facing initiatives. Present the topic in a bit more detail with this How To Measure And Improve The Business Value Of IT Service Innovation And Agility Metrics Service Delivery. Use it as a tool for discussion and navigation on IT Project Investments, Business Usual, Customer Facing Initiatives, Business Initiatives, Regulatory Compliance. This template is free to edit as deemed fit for your organization. Therefore download it now.
-
 How to measure and improve the business value of it service need for it department to demonstrate
This template covers IT value problems and solution communication such as Implementing 9 Rules For Showing The Business Value Of Information Technology. Deliver an outstanding presentation on the topic using this How To Measure And Improve The Business Value Of IT Service Need For It Department To Demonstrate. Dispense information and present a thorough explanation of Problem, Solution, Rarely Been Successful, Sometimes Successful, Consistently Successful, Usually Successful using the slides given. This template can be altered and personalized to fit your needs. It is also available for immediate download. So grab it now.
-
 KPI Dashboard For Measuring Information Technology Business Performance
This slide shows KPI dashboard for measuring information technology business performance which can be referred by technical organizations to analyze their annual performance. It includes information about monthly recurring revenue, customer acquisition cost, signups and paying customers, visitors and signups, runway, etc. Introducing our KPI Dashboard For Measuring Information Technology Business Performance set of slides. The topics discussed in these slides are Monthly Recurring Revenue, Customer Acquisition Cost, Monthly Growth. This is an immediately available PowerPoint presentation that can be conveniently customized. Download it and convince your audience.
-
 It service integration after merger dashboard to measure business performance
Mentioned slide portrays a dashboard for measuring business performance. Performance metrics covered in the slide are average weekly sales revenue, average revenue per unit, customer lifetime value and customer acquisition cost.Deliver an outstanding presentation on the topic using this IT Service Integration After Merger Dashboard To Measure Business Performance Dispense information and present a thorough explanation of Average Revenue, Customer Lifetime Value, Customer Acquisition Cost using the slides given. This template can be altered and personalized to fit your needs. It is also available for immediate download. So grab it now.
-
 Dashboard To Measure Business Performance Developing Managing Product Portfolio
This slide illustrates a dashboard that can be used by a product manager to measure the business performance. Metrics covered in the dashboard are revenue, launches, cash flow, EPS, average revenue by product and average cost by phase. Deliver an outstanding presentation on the topic using this Dashboard To Measure Business Performance Developing Managing Product Portfolio. Dispense information and present a thorough explanation of Dashboard To Measure Business Performance using the slides given. This template can be altered and personalized to fit your needs. It is also available for immediate download. So grab it now.
-
 Business Planning Software Dashboard To Measure Performance
This slide describes the dashboard to measure the performance of ERP implementation, and it is coving details of production and revenues. Deliver an outstanding presentation on the topic using this Business Planning Software Dashboard To Measure Performance. Dispense information and present a thorough explanation of Dashboard To Measure Performance Of ERP Implementation using the slides given. This template can be altered and personalized to fit your needs. It is also available for immediate download. So grab it now.
-
 Business performance measuring kpi dashboard effective brand building strategy
Following slide covers business performance dashboard of the firm. It include KPIs such as average weekly sales revenue, above sales target, sales revenue and profit generated. Deliver an outstanding presentation on the topic using this Business Performance Measuring KPI Dashboard Effective Brand Building Strategy. Dispense information and present a thorough explanation of Average Revenue Per Unit, Customer Lifetime Value, Customer Acquisition Cost using the slides given. This template can be altered and personalized to fit your needs. It is also available for immediate download. So grab it now.
-
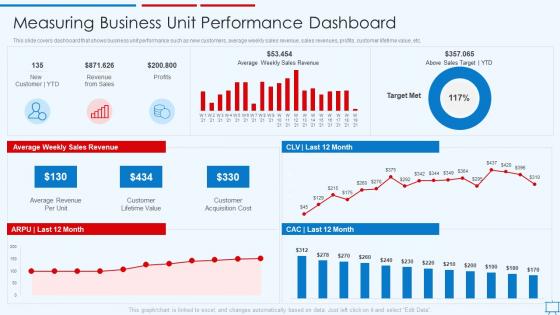 Building Competitive Strategies Successful Leadership Measuring Business Unit Performance
This slide covers dashboard that shows business unit performance such as new customers, average weekly sales revenue, sales revenues, profits, customer lifetime value, etc. Deliver an outstanding presentation on the topic using this Building Competitive Strategies Successful Leadership Measuring Business Unit Performance. Dispense information and present a thorough explanation of Performance, Dashboard, Business using the slides given. This template can be altered and personalized to fit your needs. It is also available for immediate download. So grab it now.
-
 Ensuring Leadership Product Innovation Processes Measuring Business Unit Performance Dashboard
This slide covers dashboard that shows business unit performance such as new customers, average weekly sales revenue, sales revenues, profits, customer lifetime value, etc. Present the topic in a bit more detail with this Ensuring Leadership Product Innovation Processes Measuring Business Unit Performance Dashboard. Use it as a tool for discussion and navigation on Business, Performance, Dashboard. This template is free to edit as deemed fit for your organization. Therefore download it now.
-
 IT Integration Post Mergers And Acquisition Dashboard To Measure Business Performance
Mentioned slide portrays a dashboard for measuring business performance. Performance metrics covered in the slide are average weekly sales revenue, average revenue per unit, customer lifetime value and customer acquisition cost. Deliver an outstanding presentation on the topic using this IT Integration Post Mergers And Acquisition Dashboard To Measure Business Performance. Dispense information and present a thorough explanation of Average Weekly Sales Revenue, Above Sales Target I YTD, Average Revenue Per Unit, Customer Lifetime Value, New Customer I YTD using the slides given. This template can be altered and personalized to fit your needs. It is also available for immediate download. So grab it now.
-
 KPI Dashboard To Measure Overall Business Performance Guide For Web Developers
Deliver an outstanding presentation on the topic using this KPI Dashboard To Measure Overall Business Performance Guide For Web Developers. Dispense information and present a thorough explanation of KPI Dashboard To Measure Overall Business Performance using the slides given. This template can be altered and personalized to fit your needs. It is also available for immediate download. So grab it now.
-
 Delivering Efficiency By Innovating Product Measuring Business Unit Performance Dashboard
This slide covers dashboard that shows business unit performance such as new customers, average weekly sales revenue, sales revenues, profits, customer lifetime value, etc. Present the topic in a bit more detail with this Delivering Efficiency By Innovating Product Measuring Business Unit Performance Dashboard. Use it as a tool for discussion and navigation on Business, Performance, Dashboard. This template is free to edit as deemed fit for your organization. Therefore download it now.
-
 Kpi Dashboard To Measure Partner Performance Ensuring Business Success Maintaining
Mentioned slide showcase KPI dashboard that can be used by a company to measure its partner performance. KPIS covered in the dashboard are revenue, number of pipelines closed and amount of pipeline closed versus business plan target. Present the topic in a bit more detail with this Kpi Dashboard To Measure Partner Performance Ensuring Business Success Maintaining. Use it as a tool for discussion and navigation on Kpi Dashboard To Measure Partner Performance. This template is free to edit as deemed fit for your organization. Therefore download it now.
-
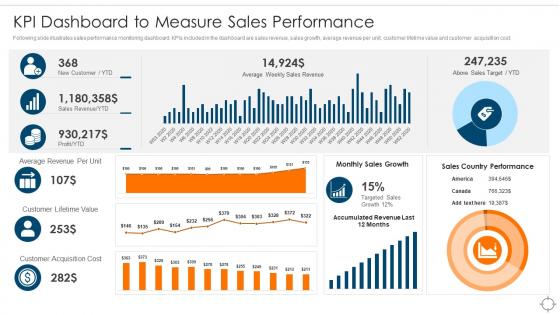 Kpi Dashboard To Measure Sales Performance Ensuring Business Success Maintaining
Following slide illustrates sales performance monitoring dashboard. KPIs included in the dashboard are sales revenue, sales growth, average revenue per unit, customer lifetime value and customer acquisition cost. Deliver an outstanding presentation on the topic using this Kpi Dashboard To Measure Sales Performance Ensuring Business Success Maintaining. Dispense information and present a thorough explanation of Kpi Dashboard To Measure Sales Performance using the slides given. This template can be altered and personalized to fit your needs. It is also available for immediate download. So grab it now.
-
 KPI Dashboard to Measure Overall Business Performance App developer playbook
Deliver an outstanding presentation on the topic using this KPI Dashboard To Measure Overall Business Performance App Developer Playbook. Dispense information and present a thorough explanation of KPI Dashboard To Measure Overall Business Performance using the slides given. This template can be altered and personalized to fit your needs. It is also available for immediate download. So grab it now.
-
 Playbook For Developers Kpi Dashboard To Measure Overall Business Performance
Present the topic in a bit more detail with this Playbook For Developers Kpi Dashboard To Measure Overall Business Performance. Use it as a tool for discussion and navigation on Business, Performance, Dashboard. This template is free to edit as deemed fit for your organization. Therefore download it now.
-
 Managing And Innovating Product Management Measuring Business Unit Performance
This slide covers dashboard that shows business unit performance such as new customers, average weekly sales revenue, sales revenues, profits, customer lifetime value, etc. Deliver an outstanding presentation on the topic using this Managing And Innovating Product Management Measuring Business Unit Performance. Dispense information and present a thorough explanation of Business, Performance, Dashboard using the slides given. This template can be altered and personalized to fit your needs. It is also available for immediate download. So grab it now.
-
 Leverage Ratios To Measure The Debt Level Financial Planning Analysis Guide Small Large Businesses
The following slide outlines top 2 leverage ratios which will assist the in determining the debt level incurred by the organization. This slide provides information about debt to equity and interest coverage ratio of the company and its competitors for the period of last 3 years. Deliver an outstanding presentation on the topic using this Leverage Ratios To Measure The Debt Level Financial Planning Analysis Guide Small Large Businesses. Dispense information and present a thorough explanation of Measure, Approximately, Comparatively using the slides given. This template can be altered and personalized to fit your needs. It is also available for immediate download. So grab it now.
-
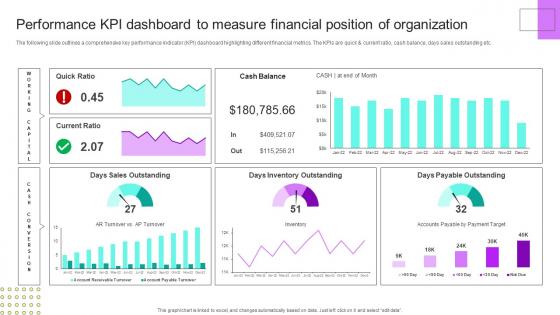 Performance Kpi Dashboard Measure Financial Position Financial Planning Analysis Guide Small Large Businesses
The following slide outlines a comprehensive key performance indicator KPI dashboard highlighting different financial metrics. The KPIs are quick and current ratio, cash balance, days sales outstanding etc. Deliver an outstanding presentation on the topic using this Performance Kpi Dashboard Measure Financial Position Financial Planning Analysis Guide Small Large Businesses. Dispense information and present a thorough explanation of Organization, Performance, Dashboard using the slides given. This template can be altered and personalized to fit your needs. It is also available for immediate download. So grab it now.
-
 Profitability Ratios To Measure The Organization Earnings Financial Planning Analysis Guide Small Large Businesses
The following slide outlines different profitability ratios which can be used by the investors to measure the financial position of the company. It covers information about gross profit and net profit margin. Deliver an outstanding presentation on the topic using this Profitability Ratios To Measure The Organization Earnings Financial Planning Analysis Guide Small Large Businesses. Dispense information and present a thorough explanation of Measure, Organization, Profitability using the slides given. This template can be altered and personalized to fit your needs. It is also available for immediate download. So grab it now.
-
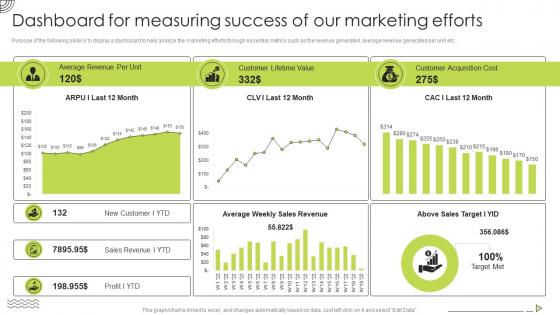 Organic Strategy To Help Business Dashboard For Measuring Success Of Our Marketing Efforts
Purpose of the following slide is to display a dashboard to help analyze the marketing efforts through essential metrics such as the revenue generated, average revenue generated per unit etc. Present the topic in a bit more detail with this Organic Strategy To Help Business Dashboard For Measuring Success Of Our Marketing Efforts. Use it as a tool for discussion and navigation on Average Revenue, Per Unit, Customer Lifetime Value, Customer Acquisition Cost. This template is free to edit as deemed fit for your organization. Therefore download it now.
-
 Measure Behavior Post Gamification Implementing Games In Business Marketing
Identify the KPIs relevant to your industry and program and then measure the performance. For example, if gamification was applied to training program, measure how many completed the training. Introducing Measure Behavior Post Gamification Implementing Games In Business Marketing to increase your presentation threshold. Encompassed with five stages, this template is a great option to educate and entice your audience. Dispence information on Average Daily Activity, Measure Behavior, Post Gamification, using this template. Grab it now to reap its full benefits.
-
 KPI Dashboard To Measure Overall Business Performance Playbook For App Design And Development
Present the topic in a bit more detail with this KPI Dashboard To Measure Overall Business Performance Playbook For App Design And Development Use it as a tool for discussion and navigation on Sales Comparison, Product Category, Brand Profitability This template is free to edit as deemed fit for your organization. Therefore download it now.
-
 QBR Dashboard To Measure Overall Business Performance
The following slide highlights a comprehensive quarterly business review QBR dashboard which can be used by the organization to evaluate business performance. The metrics used for review are total revenue, new customers, gross profit, overall costs, sales comparison, sales by different products and top performing channels. Introducing our QBR Dashboard To Measure Overall Business Performance set of slides. The topics discussed in these slides are Revenue, New Customer, Gross Profit, Total Costs. This is an immediately available PowerPoint presentation that can be conveniently customized. Download it and convince your audience.
-
 Measure Behavior Post Gamification Gamification Techniques Elements Business Growth
Identify the KPIs relevant to your industry and program and then measure the performance. For example, if gamification was applied to training program, measure how many completed the training. Introducing Measure Behavior Post Gamification Gamification Techniques Elements Business Growth to increase your presentation threshold. Encompassed with five stages, this template is a great option to educate and entice your audience. Dispence information on Gamification,Measure, Performance, using this template. Grab it now to reap its full benefits.
-
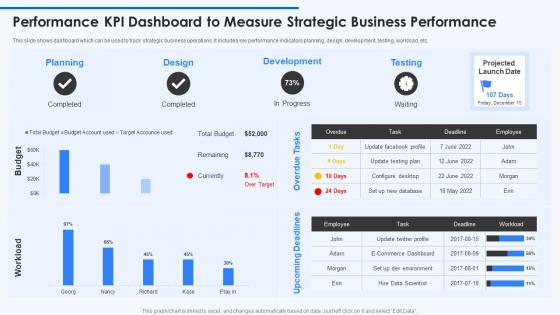 Performance KPI Dashboard To Measure Strategic Business Performance
This slide shows dashboard which can be used to track strategic business operations. It includes key performance indicators planning, design, development, testing, workload, etc. Presenting our well structured Performance KPI Dashboard To Measure Strategic Business Performance. The topics discussed in this slide are Planning, Development, Testing. This is an instantly available PowerPoint presentation that can be edited conveniently. Download it right away and captivate your audience.
-
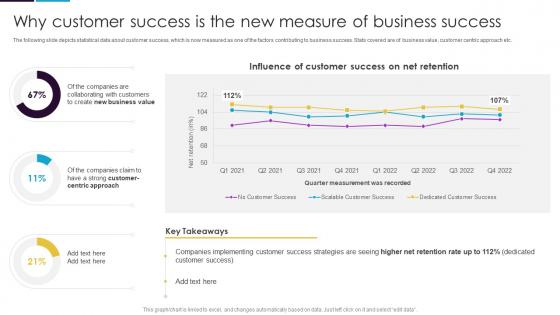 Why Customer Success Is The New Measure Of Business Success Guide To Customer Success
The following slide depicts statistical data about customer success, which is now measured as one of the factors contributing to business success. Stats covered are of business value, customer centric approach etc.Present the topic in a bit more detail with this Why Customer Success Is The New Measure Of Business Success Guide To Customer Success Use it as a tool for discussion and navigation on Companies Implementing, Quarter Measurement, Customer Success This template is free to edit as deemed fit for your organization. Therefore download it now.
-
 CS Playbook Why Customer Success Is The New Measure Of Business Success
The following slide depicts statistical data about customer success, which is now measured as one of the factors contributing to business success. Stats covered are of business value, customer centric approach etc. Present the topic in a bit more detail with this CS Playbook Why Customer Success Is The New Measure Of Business Success. Use it as a tool for discussion and navigation on Customer Success, Net Retention, Companies Implementing. This template is free to edit as deemed fit for your organization. Therefore download it now.
-
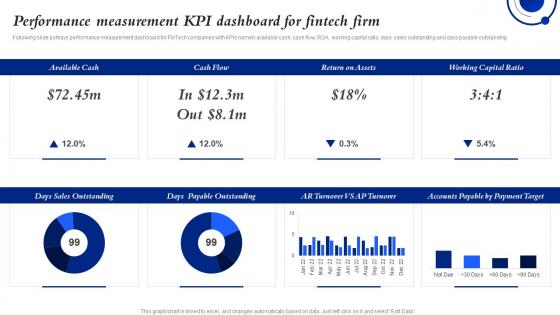 Performance Measurement KPI Dashboard For Fintech Firm Ensuring Business Success By Investing
Following slide portrays performance measurement dashboard for FinTech companies with KPIs namely available cash, cash flow, ROA, working capital ratio, days sales outstanding and days payable outstanding.Present the topic in a bit more detail with this Performance Measurement KPI Dashboard For Fintech Firm Ensuring Business Success By Investing. Use it as a tool for discussion and navigation on Payable Outstanding, Sales Outstanding, Accounts Payable. This template is free to edit as deemed fit for your organization. Therefore download it now.
-
 Approach To Introduce New Product Dashboard To Measure Business Performance
This slide illustrates a dashboard that can be used by a product manager to measure the business performance. Metrics covered in the dashboard are revenue, launches, cash flow, EPS, average revenue by product and average cost by phase. Present the topic in a bit more detail with this Approach To Introduce New Product Dashboard To Measure Business Performance. Use it as a tool for discussion and navigation on Revenue, Launches, Cash Flow, EPS. This template is free to edit as deemed fit for your organization. Therefore download it now.
-
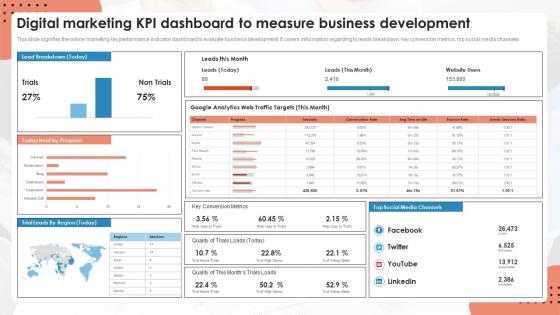 Digital Marketing KPI Dashboard To Measure Business Development
This slide signifies the online marketing key performance indicator dashboard to evaluate business development. It covers information regarding to leads breakdown, key conversion metrics, top social media channels. Introducing our Digital Marketing KPI Dashboard To Measure Business Development set of slides. The topics discussed in these slides are Digital Marketing, KPI Dashboard, Measure Business Development. This is an immediately available PowerPoint presentation that can be conveniently customized. Download it and convince your audience.
-
 Driving Value Business Through Investment Performance Measurement Kpi Dashboard For Fintech Firm
Following slide portrays performance measurement dashboard for FinTech companies with KPIs namely available cash, cash flow, ROA, working capital ratio, days sales outstanding and days payable outstanding. Present the topic in a bit more detail with this Driving Value Business Through Investment Performance Measurement Kpi Dashboard For Fintech Firm. Use it as a tool for discussion and navigation on Performance, Measurement, Dashboard. This template is free to edit as deemed fit for your organization. Therefore download it now.
-
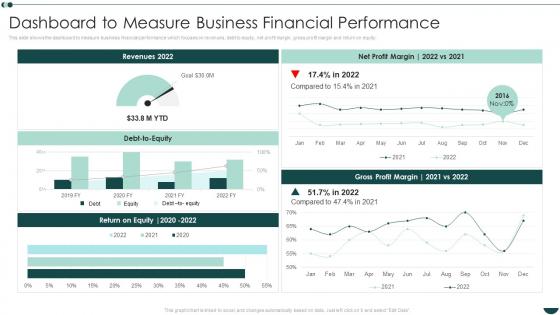 Dashboard To Measure Business Financial Performance Business Process Reengineering Operational Efficiency
This slide shows the dashboard to measure business financial performance which focuses on revenues, debt to equity, net profit margin, gross profit margin and return on equity. Deliver an outstanding presentation on the topic using this Dashboard To Measure Business Financial Performance Business Process Reengineering Operational Efficiency. Dispense information and present a thorough explanation of Business, Financial, Performance using the slides given. This template can be altered and personalized to fit your needs. It is also available for immediate download. So grab it now.
-
 Competitive Landscape Analysis Company Specific Measuring Business Performance Using Kpis
Following slide shows detailed competitive landscape analysis based on different criteria such as founded year, number of employees, investor funding, operating profit and net profit margin. Deliver an outstanding presentation on the topic using this Competitive Landscape Analysis Company Specific Measuring Business Performance Using Kpis. Dispense information and present a thorough explanation of Competitive, Landscape, Analysis using the slides given. This template can be altered and personalized to fit your needs. It is also available for immediate download. So grab it now.
-
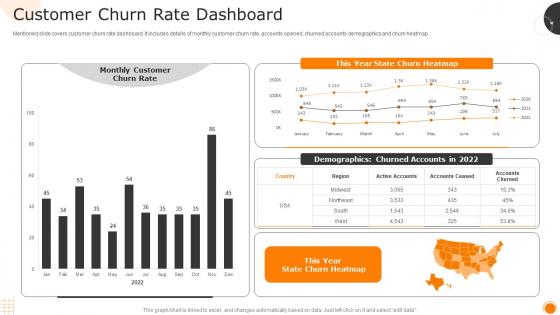 Customer Churn Rate Dashboard Measuring Business Performance Using Kpis
Mentioned slide covers customer churn rate dashboard. It includes details of monthly customer churn rate, accounts opened, churned accounts demographics and churn heatmap. Present the topic in a bit more detail with this Customer Churn Rate Dashboard Measuring Business Performance Using Kpis. Use it as a tool for discussion and navigation on Dashboard, Demographics, Customer. This template is free to edit as deemed fit for your organization. Therefore download it now.
-
 Effective Rate Metrics By Customer And Offering Measuring Business Performance Using Kpis
This slide covers effective rate metrics. It shows over year over comparison of effective rate per customer as well as effective rate per offering. Present the topic in a bit more detail with this Effective Rate Metrics By Customer And Offering Measuring Business Performance Using Kpis. Use it as a tool for discussion and navigation on Comparison, Effective, Customer. This template is free to edit as deemed fit for your organization. Therefore download it now.
-
 Employee Billable Hours Dashboard Measuring Business Performance Using Kpis
Following slide shows employee billable hours dashboard covering total hours capacity, allocated hours billable, total hours worked, and total billable hours worked for the assignment. It also includes details of each team member indulged for same assignment. Deliver an outstanding presentation on the topic using this Employee Billable Hours Dashboard Measuring Business Performance Using Kpis. Dispense information and present a thorough explanation of Dashboard, Assignment, Allocated using the slides given. This template can be altered and personalized to fit your needs. It is also available for immediate download. So grab it now.
-
 Financial Performance Indicator Dashboard Snapshot Measuring Business Performance Using Kpis
This slide shows financial performance indicator dashboard covering net profit and net sales, profitability indicator ratios, cogs and net profit by region or channel. Present the topic in a bit more detail with this Financial Performance Indicator Dashboard Snapshot Measuring Business Performance Using Kpis. Use it as a tool for discussion and navigation on Financial, Performance, Dashboard. This template is free to edit as deemed fit for your organization. Therefore download it now.
-
 Key Financials Of The Company Measuring Business Performance Using Kpis
Following slide provides financial details of company including revenue and operating profit. Revenue recorded in FY22 was dollar 518,932 while operating profit recorded was dollar 481,932. Present the topic in a bit more detail with this Key Financials Of The Company Measuring Business Performance Using Kpis. Use it as a tool for discussion and navigation on Financials, Revenue, Operating Profit. This template is free to edit as deemed fit for your organization. Therefore download it now.
-
 Measuring Business Performance Using Kpis Customer Lifetime Value Dashboard
This slide covers customer lifetime value dashboard. It covers details of average customer lifetime and average lifetime value in a 12 months format. Deliver an outstanding presentation on the topic using this Measuring Business Performance Using Kpis Customer Lifetime Value Dashboard. Dispense information and present a thorough explanation of Customer, Lifetime, Dashboard using the slides given. This template can be altered and personalized to fit your needs. It is also available for immediate download. So grab it now.
-
 Measuring Business Performance Using Kpis Employee Engagement And Company Culture Dashboard
Following slide shows employee engagement and company culture dashboard. It includes employee details, engagement score, total given recognition, previous seven days performance and radar chart to measure employee performance. Present the topic in a bit more detail with this Measuring Business Performance Using Kpis Employee Engagement And Company Culture Dashboard. Use it as a tool for discussion and navigation on Engagement, Dashboard, Measure . This template is free to edit as deemed fit for your organization. Therefore download it now.
-
 Measuring Business Performance Using Kpis Revenue And Employment Cost Dashboard
Mentioned slide covers revenue and employment cost dashboard. It includes details like full time employee number, total employment cost, total revenue and average revenue per FTE. Present the topic in a bit more detail with this Measuring Business Performance Using Kpis Revenue And Employment Cost Dashboard. Use it as a tool for discussion and navigation on Revenue, Employment, Dashboard. This template is free to edit as deemed fit for your organization. Therefore download it now.
-
 Product Pricing Strategy We Will Adopt Measuring Business Performance Using Kpis
This slide shows current and future product pricing strategy of the company. In current strategy, company opted cost plus pricing to recover their profits and in future they will opt penetration pricing for capturing market share. Present the topic in a bit more detail with this Product Pricing Strategy We Will Adopt Measuring Business Performance Using Kpis. Use it as a tool for discussion and navigation on Strategy, Product, Penetration. This template is free to edit as deemed fit for your organization. Therefore download it now.
-
 Profit Margin Dashboard Snapshot Measuring Business Performance Using Kpis
Following slide illustrates profit margin dashboard with a 12 months format. It also includes gross profit margin, operating profit margin and net profit margin. Deliver an outstanding presentation on the topic using this Profit Margin Dashboard Snapshot Measuring Business Performance Using Kpis. Dispense information and present a thorough explanation of Dashboard, Illustrates, Operating using the slides given. This template can be altered and personalized to fit your needs. It is also available for immediate download. So grab it now.
-
 Real Time Utilization Dashboard Measuring Business Performance Using Kpis
This slide covers real time utilization dashboard covering logged time such as billable, non-billable, estimated time and scheduled. It also include details of allotted hours to each employee and weekly hours for the assignment. Present the topic in a bit more detail with this Real Time Utilization Dashboard Measuring Business Performance Using Kpis. Use it as a tool for discussion and navigation on Dashboard, Estimated, Assignment. This template is free to edit as deemed fit for your organization. Therefore download it now.
-
 Business Process Automation KPI Metrics Dashboard To Measure Automation Performance In Customer
The following slide outlines a comprehensive KPI dashboard which can be used by the organization to measure the automation performance in customer support department. It covers kpis such as customer retention, costs per support, customer satisfaction, etc.Deliver an outstanding presentation on the topic using this Business Process Automation KPI Metrics Dashboard To Measure Automation Performance In Customer. Dispense information and present a thorough explanation of Customer Satisfaction, Request Answered, Request Volume using the slides given. This template can be altered and personalized to fit your needs. It is also available for immediate download. So grab it now.


