Powerpoint Templates and Google slides for Mea
Save Your Time and attract your audience with our fully editable PPT Templates and Slides.
-
 Strategy To Increase Quarterly Sales Per Customer By Meal Delivery
Introducing our Strategy To Increase Quarterly Sales Per Customer By Meal Delivery set of slides. The topics discussed in these slides are Quarterly Consumer Spending, Customers Doordash Spent This is an immediately available PowerPoint presentation that can be conveniently customized. Download it and convince your audience.
-
 Marketing Tactics To Improve Brand Measuring The Experience Of Customer Base Using Net
Following slide provides information about companys net promoter score that can be used to measure customer satisfaction. Company scored poorly in FY22 as compared to its FY21 score. Deliver an outstanding presentation on the topic using this Marketing Tactics To Improve Brand Measuring The Experience Of Customer Base Using Net. Dispense information and present a thorough explanation of Response Breakdown, Measuring The Experience, Customer Base using the slides given. This template can be altered and personalized to fit your needs. It is also available for immediate download. So grab it now.
-
 Measuring The Experience Of Customer Base Using Effort Marketing Tactics To Improve Brand
Mentioned slide shows customer effort score that can be used to measure the ease of service experienced by the customer with an organization. Based on survey results, 28 percent said that it took a lot of effort in searching the desired product. Present the topic in a bit more detail with this Measuring The Experience Of Customer Base Using Effort Marketing Tactics To Improve Brand. Use it as a tool for discussion and navigation on Customer Effort Score, Business, Product Or Service. This template is free to edit as deemed fit for your organization. Therefore download it now.
-
 Measuring The Experience Of Customer Base Using Marketing Tactics To Improve Brand
This slide illustrates customer satisfaction score that can be used to track how satisfied customers are with companys products or services. It includes the statistics of customer satisfaction based on the survey done by the firm. Deliver an outstanding presentation on the topic using this Measuring The Experience Of Customer Base Using Marketing Tactics To Improve Brand. Dispense information and present a thorough explanation of Measuring The Experience, Customer Base, Satisfaction Score using the slides given. This template can be altered and personalized to fit your needs. It is also available for immediate download. So grab it now.
-
 Measure Sales Performance With Kpi Dashboard Streamlined Sales Plan Mkt Ss V
This slide provides glimpse about dashboard analysis that can help the business to track the performance of the sales team. It includes KPIs such as sales, sales target, target achievement, sales last year, sales by channel, etc. Deliver an outstanding presentation on the topic using this Measure Sales Performance With Kpi Dashboard Streamlined Sales Plan MKT SS V Dispense information and present a thorough explanation of Sales By Channel, Inventory Days Outstanding using the slides given. This template can be altered and personalized to fit your needs. It is also available for immediate download. So grab it now.
-
 Real Estate Marketing Ideas To Improve KPI Dashboard To Measure Effectiveness Of Real Estate MKT SS V
The following slide outlines performance key performance indicator KPI dashboard that can assist marketers to evaluate online and offline real estate promotional techniques performance. The metrics covered are quarterly sales, deals won, expired contracts, revenue, conversion rates, etc. Deliver an outstanding presentation on the topic using this Real Estate Marketing Ideas To Improve KPI Dashboard To Measure Effectiveness Of Real Estate MKT SS V. Dispense information and present a thorough explanation of Revenue, Revenue Forecast, Sales Funnel using the slides given. This template can be altered and personalized to fit your needs. It is also available for immediate download. So grab it now.
-
 Measuring WOM Marketing Campaign Success Consumers Preferred Method MKT SS V
This slide covers the graphical representation of various sources for learning about new brands, products, or services. It aims to identify the need for implementing word of mouth marketing and other marketing channels such as social media, cable tv, digital ads, etc. Present the topic in a bit more detail with this Measuring WOM Marketing Campaign Success Consumers Preferred Method MKT SS V. Use it as a tool for discussion and navigation on Consumers Preferred Method, Reasons For Customers, Online Digital Ads. This template is free to edit as deemed fit for your organization. Therefore download it now.
-
 Measuring WOM Marketing Campaign Success Dashboard Tracking MKT SS V
This slide covers the KPI dashboard for companies to evaluate the performance of ambassador marketing campaigns. It includes metrics such as the number of brand ambassadors, the total number of shares, clicks, CPS, revenue, commissions, etc. Deliver an outstanding presentation on the topic using this Measuring WOM Marketing Campaign Success Dashboard Tracking MKT SS V. Dispense information and present a thorough explanation of Shares, Clicks, Revenue using the slides given. This template can be altered and personalized to fit your needs. It is also available for immediate download. So grab it now.
-
 Measuring WOM Marketing Campaign Success Dashboard Tracking Referral MKT SS V
This slide covers the KPI dashboard for brands to evaluate the performance of referral marketing campaigns. It includes metrics such as referral participation rate, referred customers, referral conversion rate, total revenue generated, etc. Present the topic in a bit more detail with this Measuring WOM Marketing Campaign Success Dashboard Tracking Referral MKT SS V. Use it as a tool for discussion and navigation on Referral Participation Rate, Referred Customers, Referral Conversion Rate. This template is free to edit as deemed fit for your organization. Therefore download it now.
-
 Measuring WOM Marketing Campaign Success Dashboard Tracking Viral MKT SS V
This slide showcases the parameters for business organizations to evaluate viral marketing performance. It includes KPIs such as user metrics, campaign metrics, social metrics, engagement rate, viral sign ups, etc. Deliver an outstanding presentation on the topic using this Measuring WOM Marketing Campaign Success Dashboard Tracking Viral MKT SS V. Dispense information and present a thorough explanation of Campaign Metrics, Social Metrics, User Metrics using the slides given. This template can be altered and personalized to fit your needs. It is also available for immediate download. So grab it now.
-
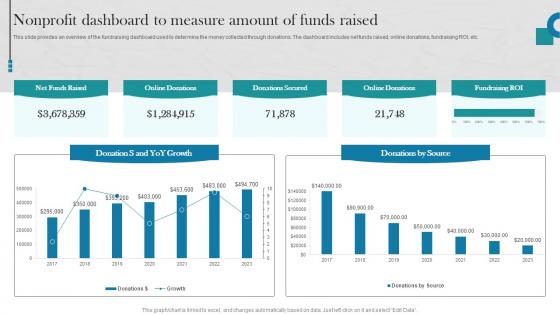 Nonprofit Dashboard To Measure Amount Of Funds Raising Donations By Optimizing MKT SS V
This slide provides an overview of the fundraising dashboard used to determine the money collected through donations. The dashboard includes net funds raised, online donations, fundraising ROI, etc. Present the topic in a bit more detail with this Nonprofit Dashboard To Measure Amount Of Funds Raising Donations By Optimizing MKT SS V. Use it as a tool for discussion and navigation on Donations By Source, Growth, Fundraising Roi. This template is free to edit as deemed fit for your organization. Therefore download it now.
-
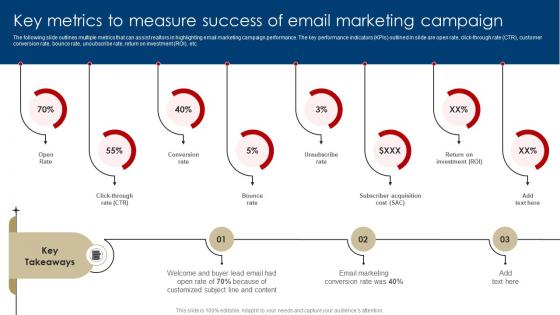 Key Metrics To Measure Success Of Email Marketing Digital Marketing Strategies For Real Estate MKT SS V
The following slide outlines multiple metrics that can assist realtors in highlighting email marketing campaign performance. The key performance indicators KPIs outlined in slide are open rate, click-through rate CTR, customer conversion rate, bounce rate, unsubscribe rate, return on investment ROI, etc. Introducing Key Metrics To Measure Success Of Email Marketing Digital Marketing Strategies For Real Estate MKT SS V to increase your presentation threshold. Encompassed with three stages, this template is a great option to educate and entice your audience. Dispence information on Metrics, Success, Email, using this template. Grab it now to reap its full benefits.
-
 KPI Dashboard To Measure Effectiveness Of Real Estate Digital Marketing Strategies For Real Estate MKT SS V
The following slide outlines performance key performance indicator KPI dashboard that can assist marketers to evaluate online and offline real estate promotional techniques performance. The metrics covered are quarterly sales, deals won, expired contracts, revenue, conversion rates, etc. Deliver an outstanding presentation on the topic using this KPI Dashboard To Measure Effectiveness Of Real Estate Digital Marketing Strategies For Real Estate MKT SS V. Dispense information and present a thorough explanation of Measure, Effectiveness, Marketing using the slides given. This template can be altered and personalized to fit your needs. It is also available for immediate download. So grab it now.
-
 Measuring Brands Market Value Using The Equity Index Brand Equity Optimization Through Strategic Brand
This slide measures the brand equity index based on the size of the intersection of the composite measures. It includes three aspects such as willingness to recommend, favorite brand and willingness to pay premium. Deliver an outstanding presentation on the topic using this Measuring Brands Market Value Using The Equity Index Brand Equity Optimization Through Strategic Brand. Dispense information and present a thorough explanation of Measuring Brands Market, Value Using The Equity Index using the slides given. This template can be altered and personalized to fit your needs. It is also available for immediate download. So grab it now.
-
 Measuring Impact Of Integrated Marketing Activities Brand Equity Optimization Through Strategic Brand
This slide represents a graph showcasing the impact of effective brand marketing programs on various brand equity metrics. It analyzes impact on awareness, commitment, trust, differentiation, quality, fame and image. Present the topic in a bit more detail with this Measuring Impact Of Integrated Marketing Activities Brand Equity Optimization Through Strategic Brand. Use it as a tool for discussion and navigation on Product Line Extension, Impact On Business Metrics. This template is free to edit as deemed fit for your organization. Therefore download it now.
-
 Tracking KPIs To Measure Brand Health And Reputation Brand Equity Optimization Through Strategic Brand
This slide represents a dashboard highlighting multiple performance metrics to measure brand health and reputation over time. It includes metrics such as net promoter score, brand awareness, familiarity, consideration, perception, etc. Deliver an outstanding presentation on the topic using this Tracking KPIs To Measure Brand Health And Reputation Brand Equity Optimization Through Strategic Brand. Dispense information and present a thorough explanation of Perceptions Over Time, Awareness Current Wave using the slides given. This template can be altered and personalized to fit your needs. It is also available for immediate download. So grab it now.
-
 Business Questionnaire To Measure Customer Satisfaction Survey SS
This slide consists of a business questionnaire that can be used by business analysts to gain insights about client satisfaction and perspective to take better business decisions. The set of questions is related to demographics and product-related questions. Introducing our Business Questionnaire To Measure Customer Satisfaction Survey SS set of slides. The topics discussed in these slides are Demographics, Product Related Questions. This is an immediately available PowerPoint presentation that can be conveniently customized. Download it and convince your audience.
-
 Role And Importance Of Display Advertising Dashboard To Measure Display Advertising MKT SS V
This slide provides a dashboard to monitor the display advertising campaign performance in order to reduce overall marketing cost. It incorporates advertising cost, average number of clicks and impressions, clicks per day, revenue by campaign, etc. Present the topic in a bit more detail with this Role And Importance Of Display Advertising Dashboard To Measure Display Advertising MKT SS V. Use it as a tool for discussion and navigation on Average Number, Number Impressions, Number Of Clicks. This template is free to edit as deemed fit for your organization. Therefore download it now.
-
 Nonprofit Dashboard To Measure Amount NPO Marketing And Communication MKT SS V
This slide provides an overview of the fundraising dashboard used to determine the money collected through donations. The dashboard includes net funds raised, online donations, fundraising ROI, etc. Present the topic in a bit more detail with this Nonprofit Dashboard To Measure Amount NPO Marketing And Communication MKT SS V. Use it as a tool for discussion and navigation on Nonprofit Dashboard, Measure Amount, Funds Raised. This template is free to edit as deemed fit for your organization. Therefore download it now.
-
 KPI Metrics Dashboard To Measure Success Of Customer Attrition Rate Prevention
Mentioned slide outlines a key performance indicator KPI dashboard which will assist managers to showcase the result of customer attrition prevention strategies. The KPIs are risky customers, retention rate, monthly recurring revenue MRR, churn risk by location and income, etc. Present the topic in a bit more detail with this KPI Metrics Dashboard To Measure Success Of Customer Attrition Rate Prevention. Use it as a tool for discussion and navigation on Risky Customers, Risky Customers, Retention Rate, Prevention Strategies. This template is free to edit as deemed fit for your organization. Therefore download it now.
-
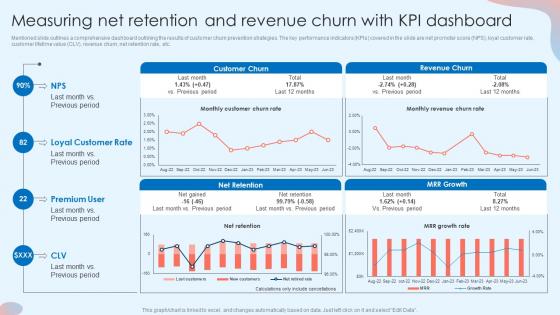 Measuring Net Retention And Revenue Churn With Customer Attrition Rate Prevention
Mentioned slide outlines a comprehensive dashboard outlining the results of customer churn prevention strategies. The key performance indicators KPIs covered in the slide are net promoter score NPS, loyal customer rate, customer lifetime value CLV, revenue churn, net retention rate, etc. Present the topic in a bit more detail with this Measuring Net Retention And Revenue Churn With Customer Attrition Rate Prevention. Use it as a tool for discussion and navigation on Loyal Customer Rate, Premium User, Customer Churn, Revenue Churn. This template is free to edit as deemed fit for your organization. Therefore download it now.
-
 Major Industries Adopting Robotic Dashboard To Measure Robotic Process Automation
This slide presents a dashboard to measure RPA bots performance in an organization. It includes utilization hours, bot types, average daily utilization, percentage of errors that occurred by bots, and occupied bots by business operations. Present the topic in a bit more detail with this Major Industries Adopting Robotic Dashboard To Measure Robotic Process Automation. Use it as a tool for discussion and navigation on Board To Measure Robotic Process, Automation Bots Performance. This template is free to edit as deemed fit for your organization. Therefore download it now.
-
 Major Industries Adopting Robotic Dashboard To Measure Workflow Performance Post
This slide presents a dashboard to measure the overall operation performance after RPA implementation. It includes return on investment, bot numbers, saved hours, capital, bots runtime, time saved by bots, and workflow processes. Deliver an outstanding presentation on the topic using this Major Industries Adopting Robotic Dashboard To Measure Workflow Performance Post. Dispense information and present a thorough explanation of Dashboard, Measure Workflow Performance, Post RPA Implementation using the slides given. This template can be altered and personalized to fit your needs. It is also available for immediate download. So grab it now.
-
 Measure Sales Performance With KPI Dashboard Elevating Lead Generation With New And Advanced MKT SS V
This slide provides glimpse about dashboard analysis that can help the business to track the performance of the sales team. It includes KPIs such as sales, sales target, target achievement, sales last year, sales by channel, etc. Deliver an outstanding presentation on the topic using this Measure Sales Performance With KPI Dashboard Elevating Lead Generation With New And Advanced MKT SS V. Dispense information and present a thorough explanation of Measure, Sales, Performance using the slides given. This template can be altered and personalized to fit your needs. It is also available for immediate download. So grab it now.
-
 KPI Dashboard To Measure Effectiveness Real Estate Promotional Techniques To Engage MKT SS V
The following slide outlines performance key performance indicator KPI dashboard that can assist marketers to evaluate online and offline real estate promotional techniques performance. The metrics covered are quarterly sales, deals won, expired contracts, revenue, conversion rates, etc. Present the topic in a bit more detail with this KPI Dashboard To Measure Effectiveness Real Estate Promotional Techniques To Engage MKT SS V. Use it as a tool for discussion and navigation on Quarterly Sales, Under Contracts, Deals Won. This template is free to edit as deemed fit for your organization. Therefore download it now.
-
 A41 KPI Dashboard To Measure Effectiveness Of Real Estate Marketing Plan To Maximize ROI MKT SS V
The following slide outlines performance key performance indicator KPI dashboard that can assist marketers to evaluate online and offline real estate promotional techniques performance. The metrics covered are quarterly sales, deals won, expired contracts, revenue, conversion rates, etc. Deliver an outstanding presentation on the topic using this A41 KPI Dashboard To Measure Effectiveness Of Real Estate Marketing Plan To Maximize ROI MKT SS V. Dispense information and present a thorough explanation of Measure, Effectiveness, Estate using the slides given. This template can be altered and personalized to fit your needs. It is also available for immediate download. So grab it now.
-
 Performance Dashboard Tracking For Measuring New Hire Onboarding And Orientation Plan
This slide represents a dashboard tracking employee experience KPIs. It includes information about metrics such as employee engagement, experience vs expectation and intent to stay. Deliver an outstanding presentation on the topic using this Performance Dashboard Tracking For Measuring New Hire Onboarding And Orientation Plan. Dispense information and present a thorough explanation of Employee Engagement, Intent To Stay, Employee Engagement using the slides given. This template can be altered and personalized to fit your needs. It is also available for immediate download. So grab it now.
-
 Support Measures For Ensuring Health And Safety At How To Optimize Recruitment Process To Increase
This slide covers various support measures that a company can provide to its employees to promote physical as well we metal health at workplace. These are work from home facility, availability of doctors during working hours, trainings for managing stress at work Introducing Support Measures For Ensuring Health And Safety At How To Optimize Recruitment Process To Increase to increase your presentation threshold. Encompassed with three stages, this template is a great option to educate and entice your audience. Dispence information on Support, Health, Safety, using this template. Grab it now to reap its full benefits.
-
 KPI Dashboard For Measuring Digital Marketing Program For Customer Retention Management
This slide represents ecommerce dashboard showcasing marketing performance. It includes sales breakdown, net revenue through channels, sales forecast, sales funnel etc. Deliver an outstanding presentation on the topic using this KPI Dashboard For Measuring Digital Marketing Program For Customer Retention Management. Dispense information and present a thorough explanation of KPI Dashboard, Digital Marketing Program, Customer Retention Management using the slides given. This template can be altered and personalized to fit your needs. It is also available for immediate download. So grab it now.
-
 Dashboard To Measure Post Implementation Of Workforce ICT Strategic Framework Strategy SS V
This slide represents dashboard to track workforce performance post software implementation. It covers metrics such as absenteeism rate, average employee tenure, and overall labor effectiveness. Present the topic in a bit more detail with this Dashboard To Measure Post Implementation Of Workforce ICT Strategic Framework Strategy SS V. Use it as a tool for discussion and navigation on Dashboard To Measure, Post Implementation, Workforce Management Software. This template is free to edit as deemed fit for your organization. Therefore download it now.
-
 Key ICT Security Measures Used By Businesses ICT Strategic Framework Strategy SS V
This slide represents essential information and communication technology ICT security measures businesses use. It covers strong password authentication, data backup, network access control, etc. Present the topic in a bit more detail with this Key ICT Security Measures Used By Businesses ICT Strategic Framework Strategy SS V. Use it as a tool for discussion and navigation on Responsible Person, Number Of Respondents, Businesses. This template is free to edit as deemed fit for your organization. Therefore download it now.
-
 Dashboards To Track Effectiveness Of Health And Safety Measures Manpower Optimization Methods
The performance tracker includes health and safety measures which are incidence rate, critical incidence, type of incidence, consequences of injuries etc. Present the topic in a bit more detail with this Dashboards To Track Effectiveness Of Health And Safety Measures Manpower Optimization Methods. Use it as a tool for discussion and navigation on Critical Incidents, Severity, Injury Consequence. This template is free to edit as deemed fit for your organization. Therefore download it now.
-
 Consumer Adoption Challenges Faced By Organization Key Adoption Measures For Customer
This slide provides glimpse about problems faced by our organization that can provide metrics to target and develop strategies to increase our customer base. It includes issues such as customer churn rate, customer adoption rate, etc. Deliver an outstanding presentation on the topic using this Consumer Adoption Challenges Faced By Organization Key Adoption Measures For Customer Dispense information and present a thorough explanation of Adoption Challenges, Faced By Organization using the slides given. This template can be altered and personalized to fit your needs. It is also available for immediate download. So grab it now.
-
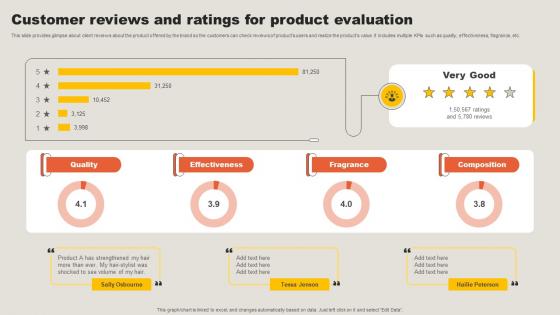 Customer Reviews And Ratings For Product Evaluation Key Adoption Measures For Customer
This slide provides glimpse about client reviews about the product offered by the brand so the customers can check reviews of products users and realize the products value. It includes multiple KPIs such as quality, effectiveness, fragrance, etc. Present the topic in a bit more detail with this Customer Reviews And Ratings For Product Evaluation Key Adoption Measures For Customer Use it as a tool for discussion and navigation on Reviews And Ratings, Product Evaluation This template is free to edit as deemed fit for your organization. Therefore download it now.
-
 Dashboard To Evaluate Consumer Adoption In Key Adoption Measures For Customer
This slide showcases the KPIs that would help our business organization to evaluate improvements in the consumer adoption process. It includes repeat purchase ratio per purchase frequency, conversions over time, customer adoption rate, customer churn rate, etc. Deliver an outstanding presentation on the topic using this Dashboard To Evaluate Consumer Adoption In Key Adoption Measures For Customer Dispense information and present a thorough explanation of Evaluate Consumer Adoption using the slides given. This template can be altered and personalized to fit your needs. It is also available for immediate download. So grab it now.
-
 Effective Marketing Strategies KPI Dashboard To Measure Online Website Performance
Following slide exhibits dashboard to track and measure performance of online shopping website of company. It include indicators such as sales, gross profit, conversion rates, site traffic, number of shares and transactions etc. Present the topic in a bit more detail with this Effective Marketing Strategies KPI Dashboard To Measure Online Website Performance. Use it as a tool for discussion and navigation on KPI Dashboard, Online Website Performance, Conversion Rate. This template is free to edit as deemed fit for your organization. Therefore download it now.
-
 Average cost of automated measured reported improved kpis ppt slide
Presenting average cost of automated measured reported improved kpis ppt slide. This presentation slide shows three Key Performance Indicators or KPIs in a Dashboard style design. The first KPI that can be shown is Average Cost of Automated Measurement Per KPI. The second KPI is percentage of KPIs Reported According to Approved Plan and the third is percentage of KPIs That are Improved. These KPI Powerpoint graphics are all data driven, and the shape automatically adjusts according to your data. Just right click on the KPI graphic, enter the right value and the shape will adjust automatically. Make a visual impact with our KPI slides.
-
 Kpi for benchmarking manual automated measurement cost presentation slide
Presenting kpi for benchmarking manual automated measurement cost presentation slide. This presentation slide shows three Key Performance Indicators or KPIs in a Dashboard style design. The first KPI that can be shown is Cost of KPI Benchmarking. The second KPI is Cost of Manual KPI Measurement and the third is Cost of Automated Measurement of KPIs. These KPI Powerpoint graphics are all data driven, and the shape automatically adjusts according to your data. Just right click on the KPI graphic, enter the right value and the shape will adjust automatically. Make a visual impact with our KPI slides.
-
 Kpi for ratio cost between automated and manual measurement updates time presentation slide
Presenting kpi for ratio cost between automated and manual measurement updates time presentation slide. This presentation slide shows three Key Performance Indicators or KPIs in a Dashboard style design. The first KPI that can be shown is Ratio Between Cost of Automated and Manual KPI Measurement. The second KPI is Average Time Between Updates of KPIs and the third is Average Cost of Manual Measurement Per KPI. These KPI Powerpoint graphics are all data driven, and the shape automatically adjusts according to your data. Just right click on the KPI graphic, enter the right value and the shape will adjust automatically. Make a visual impact with our KPI slides.
-
 Manually measured compared against benchmarks benchmarking cost per kpi ppt slide
Presenting manually measured compared against benchmarks benchmarking cost per kpi ppt slide. This presentation slide shows three Key Performance Indicators or KPIs in a Dashboard style design. The first KPI that can be shown is percentage of KPIs That are Manually Measured. The second KPI is percentage of KPIs Compared Against Benchmarks and the third is Average Cost of Benchmarking Per KPI. These KPI Powerpoint graphics are all data driven, and the shape automatically adjusts according to your data. Just right click on the KPI graphic, enter the right value and the shape will adjust automatically. Make a visual impact with our KPI slides.
-
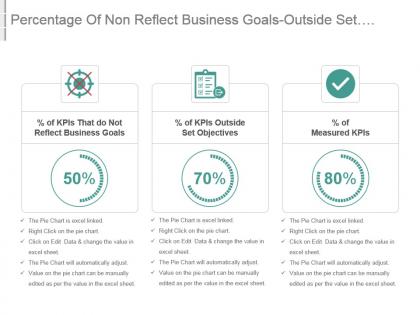 Percentage of non reflect business goals outside set objectives measured kpis ppt slide
Presenting percentage of non reflect business goals outside set objectives measured kpis ppt slide. This presentation slide shows three Key Performance Indicators or KPIs in a Dashboard style design. The first KPI that can be shown is percentage of KPIs That do Not Reflect Business Goals. The second KPI is percentage of KPIs Outside Set Objectives and the third is percentage of Measured KPIs. These KPI Powerpoint graphics are all data driven, and the shape automatically adjusts according to your data. Just right click on the KPI graphic, enter the right value and the shape will adjust automatically. Make a visual impact with our KPI slides.
-
 Percentage of set objectives measurement cost automatically measured kpis powerpoint slide
Presenting percentage of set objectives measurement cost automatically measured kpis powerpoint slide. This presentation slide shows three Key Performance Indicators or KPIs in a Dashboard style design. The first KPI that can be shown is percentage of KPIs Within Set Objectives. The second KPI is Cost of KPI Measurement and the third is percentage of KPIs That are Automatically Measured. These KPI Powerpoint graphics are all data driven, and the shape automatically adjusts according to your data. Just right click on the KPI graphic, enter the right value and the shape will adjust automatically. Make a visual impact with our KPI slides.
-
 Update time between automated and manual measurement kpis data collection sources presentation slide
Presenting update time between automated and manual measurement kpis data collection sources presentation slide. This presentation slide shows three Key Performance Indicators or KPIs in a Dashboard style design. The first KPI that can be shown is Average Time Between Updates of KPIs with Automated Measurement. The second KPI is Average Time Between Updates of KPIs with Manual Measurement and the third is Number of Sources used for Data Collection. These KPI Powerpoint graphics are all data driven, and the shape automatically adjusts according to your data. Just right click on the KPI graphic, enter the right value and the shape will adjust automatically. Make a visual impact with our KPI slides.
-
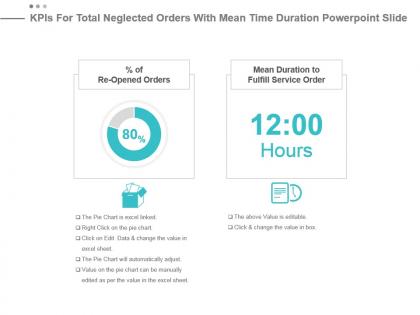 Kpis for total neglected orders with mean time duration powerpoint slide
Presenting kpis for total neglected orders with mean time duration powerpoint slide. This presentation slide shows two Key Performance Indicators or KPIs. The first KPI that can be show is percentage of Re Opened Orders . The second KPI is Mean Duration to Fulfill Service Order. These KPI Powerpoint graphics are all data driven, and the shape automatically adjusts according to your data. Just right click on the KPI graphic, enter the right value and the shape will adjust automatically. Make a visual impact with our KPI slides.
-
 Business highlights of financial measures of year over year
Presenting this set of slides with name - Business Highlights Of Financial Measures Of Year Over Year. This is a three stage process. The stages in this process are Business Highlights, Company Highlights, Business Key Points.
-
 Business highlights showing liabilities measures of year over year
Presenting this set of slides with name - Business Highlights Showing Liabilities Measures Of Year Over Year. This is a five stage process. The stages in this process are Business Highlights, Company Highlights, Business Key Points.
-
 Magnitude of dimension for size measurement by ruler or tape measure
Presenting this set of slides with name - Magnitude Of Dimension For Size Measurement By Ruler Or Tape Measure. This is a three stage process. The stages in this process are Size, Dimensions, Measurements.
-
 Measure level tool for size measurement showing man working on project
Presenting this set of slides with name - Measure Level Tool For Size Measurement Showing Man Working On Project. This is a three stage process. The stages in this process are Size, Dimensions, Measurements.
-
 Measuring size with the help of ruler or scale showing magnitude of dimension
Presenting this set of slides with name - Measuring Size With The Help Of Ruler Or Scale Showing Magnitude Of Dimension. This is a four stage process. The stages in this process are Size, Dimensions, Measurements.
-
 Measuring tape for size dimension magnitude
Presenting this set of slides with name - Measuring Tape For Size Dimension Magnitude. This is a three stage process. The stages in this process are Size, Dimensions, Measurements.
-
 Size measurement showing different categories as small medium and large
Presenting this set of slides with name - Size Measurement Showing Different Categories As Small Medium And Large. This is a four stage process. The stages in this process are Size, Dimensions, Measurements.
-
 Small medium and large size showing different categories of measurement
Presenting this set of slides with name - Small Medium And Large Size Showing Different Categories Of Measurement. This is a three stage process. The stages in this process are Size, Dimensions, Measurements.
-
 Project metric dashboard for tracking with measure status trend
Presenting this set of slides with name - Project Metric Dashboard For Tracking With Measure Status Trend. This is a two stage process. The stages in this process are Project Kpis, Project Dashboard, Project Metrics.
-
 List of measure of efficiency of contributors in organisation development in percent
Presenting this set of slides with name - List Of Measure Of Efficiency Of Contributors In Organisation Development In Percent. This is a five stage process. The stages in this process are Contributor, Writer, Reporter.
-
 Measuring Success Powerpoint Template Slide
Bother free, easy and fast download. Completely modifiable text as per your need. Change the color scheme and contrast to suit the contextual requirement. Thoroughly editable orientation and size of PPT icons. Include your own company logo, tagline, watermark, trademark etc. to personalize. No alteration in original resolution of presentation images post editing. The stages in this process are success, growth.
-
 Quality dashboard with quality index by measures and quality index
Presenting this set of slides with name - Quality Dashboard With Quality Index By Measures And Quality Index. This is a three stage process. The stages in this process are Quality Dashboard, Quality Kpi, Quality Metircs.
-
 Employee performance levels measuring effectiveness analysis
Presenting this set of slides with name - Employee Performance Levels Measuring Effectiveness Analysis. This is a four stage process. The stages in this process are Employee Performance, Employee Engagement, Employee Evaluation.
-
 Devops kpi dashboard showing mean time to recover
Presenting this set of slides with name - Devops Kpi Dashboard Showing Mean Time To Recover. This is a six stage process. The stages in this process are Development And Operations, Devops.
-
 Contract management measuring the performance status of contract activities
Presenting this set of slides with name - Contract Management Measuring The Performance Status Of Contract Activities. This is a five stage process. The stages in this process are Contract Negotiation, Contract Management, Deal Making.
-
 Event based marketing customer data insight social influencer measures cpb
This is an editabletwo stages graphic that deals with topics like Event Based Marketing, Customer Data Insight, Social Influencer Measures to help convey your message better graphically. This product is a premium product available for immediate download, and is 100 percent editable in Powerpoint. Download this now and use it in your presentations to impress your audience.


