Powerpoint Templates and Google slides for Manager Showing
Save Your Time and attract your audience with our fully editable PPT Templates and Slides.
-
 Financial Investment Portfolio Management Dashboard Showcasing Portfolio Investment Performance
This slide represents dashboard showcasing portfolio investment performance. It includes project progress, project manager, task completed etc. Present the topic in a bit more detail with this Financial Investment Portfolio Management Dashboard Showcasing Portfolio Investment Performance. Use it as a tool for discussion and navigation on Dashboard, Investment, Performance. This template is free to edit as deemed fit for your organization. Therefore download it now.
-
 Dashboard Showing Construction Project Management
This slide shows the dashboard which depicts the construction project management performance such as billing date, working profit, total cost, billed percentage, budget spent, completed projects and comparison of two companies about revenues earned from project. Introducing our Dashboard Showing Construction Project Management set of slides. The topics discussed in these slides are Dashboard Showing Construction, Project Management This is an immediately available PowerPoint presentation that can be conveniently customized. Download it and convince your audience.
-
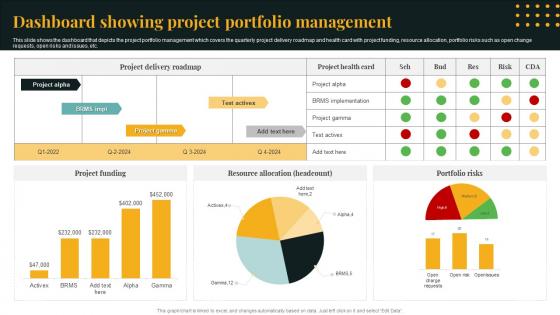 Dashboard Showing Project Portfolio Management
This slide shows the dashboard that depicts the project portfolio management which covers the quarterly project delivery roadmap and health card with project funding, resource allocation, portfolio risks such as open change requests, open risks and issues, etc. Presenting our well structured Dashboard Showing Project Portfolio Management. The topics discussed in this slide are Project Delivery Roadmap, Resource Allocation, Project Funding. This is an instantly available PowerPoint presentation that can be edited conveniently. Download it right away and captivate your audience.
-
 Warehouse Performance Management Dashboard Showing Query Execution
This slide shows the dashboard representing data related to the performance of warehouse for its management. It shows query provisioning and overload time along with its execution. Introducing our Warehouse Performance Management Dashboard Showing Query Execution set of slides. The topics discussed in these slides are Warehouse Performance, Management Dashboard, Query Execution. This is an immediately available PowerPoint presentation that can be conveniently customized. Download it and convince your audience.
-
 Dashboard Showcasing Project Management Operations
This slide exhibits project management operations dashboard. It covers task status, budget status, pending tasks, activity progress status etc to track project progress. Presenting our well structured Dashboard Showcasing Project Management Operations. The topics discussed in this slide are Feasibility Analysis, Mark Research, Funds Availability. This is an instantly available PowerPoint presentation that can be edited conveniently. Download it right away and captivate your audience.
-
 Creating Value With Machine Learning Crisis Management Ppt Infographics Show
Deliver an outstanding presentation on the topic using this Creating Value With Machine Learning Crisis Management Ppt Infographics Show. Dispense information and present a thorough explanation of Crisis Management, Target, Situational Development using the slides given. This template can be altered and personalized to fit your needs. It is also available for immediate download. So grab it now.
-
 Dashboard Showcasing Employee Performance Post Career Management Implementing Effective Career
This slide represents dashboard showcasing employee productivity and workplace insights. It covers overtime cost, leaves, employee count, gender diversity etc. Deliver an outstanding presentation on the topic using this Dashboard Showcasing Employee Performance Post Career Management Implementing Effective Career. Dispense information and present a thorough explanation of Dashboard, Showcasing Employee, Performance, Post Career Management using the slides given. This template can be altered and personalized to fit your needs. It is also available for immediate download. So grab it now.
-
 Dashboard Showcasing Project Management And Delivery Status
This slide represents dashboard which shows project management with delivery status that helps track progress and drive efficiency. It provides information regarding project budget, overdue tasks and delivery dates. Introducing our Dashboard Showcasing Project Management And Delivery Status set of slides. The topics discussed in these slides are Planning Phase, Product Designing, Development Stage. This is an immediately available PowerPoint presentation that can be conveniently customized. Download it and convince your audience.
-
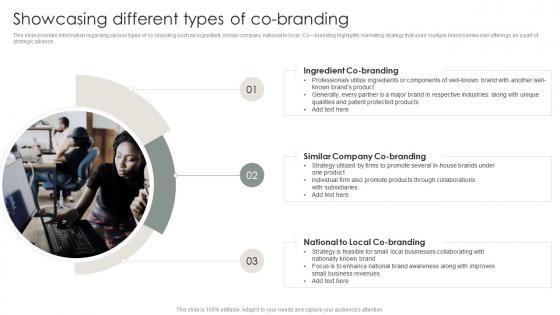 Strategic Brand Management Process Showcasing Different Types Of Co Branding
This slide provides information regarding various types of co branding such as ingredient, similar company, national to local. Co branding highlights marketing strategy that uses multiple brand names over offerings as a part of strategic alliance. Introducing Strategic Brand Management Process Showcasing Different Types Of Co Branding to increase your presentation threshold. Encompassed with three stages, this template is a great option to educate and entice your audience. Dispence information on Ingredient Co Branding, Similar Company Co Branding, National To Local Co Branding , using this template. Grab it now to reap its full benefits.
-
 Table Of Contents For Bank Risk Management Tools And Techniques Ppt Show Example Introduction
Introducing Table Of Contents For Bank Risk Management Tools And Techniques Ppt Show Example Introduction to increase your presentation threshold. Encompassed with six stages, this template is a great option to educate and entice your audience. Dispence information on Risk Management, Assessment Of The Risk, Components And Key Parameters, using this template. Grab it now to reap its full benefits.
-
 Table Of Contents Content Management System Deployment Ppt Show Designs Download
Increase audience engagement and knowledge by dispensing information using Table Of Contents Content Management System Deployment Ppt Show Designs Download. This template helps you present information on three stages. You can also present information on Warehouse Management System, Order Management System, Management System Deployment using this PPT design. This layout is completely editable so personaize it now to meet your audiences expectations.
-
 Enhancing Recruitment Process Candidate Relationship Management Dashboard Showcasing SMS Campaign
This slide showcases dashboard which can help recruiters in managing relationships along with SMS campaign for candidates. It provides details about applications, shortlisted, on hold, SMS activity report, SMS schedule, etc. Present the topic in a bit more detail with this Enhancing Recruitment Process Candidate Relationship Management Dashboard Showcasing SMS Campaign. Use it as a tool for discussion and navigation on Candidate Relationship, Management, Dashboard, SMS Campaign. This template is free to edit as deemed fit for your organization. Therefore download it now.
-
 Showcasing The Results Of Resolving Employees Conflict Management Techniques
The purpose of this slide is to outline results of conflict management training program. The statistics covered in this slide is related to before and after impact of training program on employees performance. Deliver an outstanding presentation on the topic using this Showcasing The Results Of Resolving Employees Conflict Management Techniques. Dispense information and present a thorough explanation of Team, Management, Productivity, Organization using the slides given. This template can be altered and personalized to fit your needs. It is also available for immediate download. So grab it now.
-
 Table Of Contents Guide For International Marketing Management Ppt Show Gridlines
Increase audience engagement and knowledge by dispensing information using Table Of Contents Guide For International Marketing Management Ppt Show Gridlines. This template helps you present information on three stages. You can also present information on International, Marketing, Management using this PPT design. This layout is completely editable so personaize it now to meet your audiences expectations.
-
 Global AIOps Market It Operations Management With Machine Learning Ppt Show Graphics Pictures
The following slide displays a global overview of the AIOps market by region, the provided world map highlights multiple key regions such as North America, South America, APAC, Europe and Australia. Increase audience engagement and knowledge by dispensing information using Global AIOps Market It Operations Management With Machine Learning Ppt Show Graphics Pictures. This template helps you present information on three stages. You can also present information on Market Share, CAGR, Market using this PPT design. This layout is completely editable so personaize it now to meet your audiences expectations.
-
 Table Of Contents For Marketing Guide To Manage Brand Ppt Show Example Introduction
Introducing Table Of Contents For Marketing Guide To Manage Brand Ppt Show Example Introduction to increase your presentation threshold. Encompassed with four stages, this template is a great option to educate and entice your audience. Dispence information on Brand Identity Management, Leverage Brand Awareness, Enable Consumer Connection , using this template. Grab it now to reap its full benefits.
-
 Dashboard Showcasing Unique Errors Per Software Effective IoT Device Management IOT SS
This slide showcases a device management dashboard that allows monitoring device status in order to analyze performance. It includes elements such as unique devices, event type, active devices, and total number of events.Present the topic in a bit more detail with this Dashboard Showcasing Unique Errors Per Software Effective IoT Device Management IOT SS. Use it as a tool for discussion and navigation on Per Hardware Version, Firmware Version, Per Software Version. This template is free to edit as deemed fit for your organization. Therefore download it now.
-
 Lean Manufacturing Dashboard Showcasing Enabling Waste Management Through
This slide represents lean manufacturing dashboard showcasing production progress. It covers production volume, order volume, downtime, returned item etc. Present the topic in a bit more detail with this Lean Manufacturing Dashboard Showcasing Enabling Waste Management Through. Use it as a tool for discussion and navigation on Production Volume, Downtime Causes. This template is free to edit as deemed fit for your organization. Therefore download it now.
-
 Management Audit Findings Dashboard Showcasing Priority And Status
This slide showcases the management audit findings dashboard with status which helps an organization to easily manage execution according to planned timeframes and budgets. It includes details such as product, sales, marketing, trading, product management, etc. Introducing our Management Audit Findings Dashboard Showcasing Priority And Status set of slides. The topics discussed in these slides are Status, Priority. This is an immediately available PowerPoint presentation that can be conveniently customized. Download it and convince your audience.
-
 Our Team For Waste Management Service Proposal Ppt Show Infographic Template
This slide covers the team structure for the waste pickup service proposal. It covers the members names and designations following the team hierarchy. Introducing Our Team For Waste Management Service Proposal Ppt Show Infographic Template to increase your presentation threshold. Encompassed with two stages, this template is a great option to educate and entice your audience. Dispence information on Our Team, Waste Management, Service Proposal, using this template. Grab it now to reap its full benefits.
-
 Column Chart Process For Project Risk Management Ppt Show Designs Download
Deliver an outstanding presentation on the topic using this Column Chart Process For Project Risk Management Ppt Show Designs Download. Dispense information and present a thorough explanation of Column Chart using the slides given. This template can be altered and personalized to fit your needs. It is also available for immediate download. So grab it now.
-
 Dashboard Showcasing Real Estate Construction Quality Management
This slide showcases dashboard for building construction quality inspection which helps track project performance and make improvements. It provides information such as on site inspection, safety meeting, rework cost, time taken and client satisfaction etc. Presenting our well structured Dashboard Showcasing Real Estate Construction Quality Management. The topics discussed in this slide are Dashboard, Management, Construction. This is an instantly available PowerPoint presentation that can be edited conveniently. Download it right away and captivate your audience.
-
 C40 Managing Interpersonal Conflict Showcasing The Results Of Resolving Employees Conflict In House
The purpose of this slide is to outline the results of resolving workplace conflicts after developing in house strategy. Reduction in stress level, increase in trust level, improved work performance and increase in employee retention rate are the major benefits which are mentioned in the slide. Deliver an outstanding presentation on the topic using this C40 Managing Interpersonal Conflict Showcasing The Results Of Resolving Employees Conflict In House. Dispense information and present a thorough explanation of Team Members, Work Performance, Employees using the slides given. This template can be altered and personalized to fit your needs. It is also available for immediate download. So grab it now.
-
 Managing Interpersonal Conflict Showcasing The Results Of Resolving Employees Conflict Third Party
The purpose of this slide is to outline results of conflict management training program. The statistics covered in this slide is related to before and after impact of training program on employees performance. Present the topic in a bit more detail with this Managing Interpersonal Conflict Showcasing The Results Of Resolving Employees Conflict Third Party. Use it as a tool for discussion and navigation on Team Members, Training Program, Employees. This template is free to edit as deemed fit for your organization. Therefore download it now.
-
 Key Statistics Showing RPA Management In Different Segments
This template shows the Key statistics illustrating RPA management in various segments. The purpose of this slide to bifurcated on the segments for easy evaluation . It includes major such as company, designation, geography, etc. Introducing our Key Statistics Showing RPA Management In Different Segments set of slides. The topics discussed in these slides are By Company Type, By Designation, By Geography. This is an immediately available PowerPoint presentation that can be conveniently customized. Download it and convince your audience.
-
 BI Dashboard Showcasing Fleet Management Metrics
This slide showcases BI dashboard to ensure smooth working of shipping and logistics operations. It includes KPIs such as vehicle cost trend, price per unit, fuel consumption, distance, accident, etc. Introducing our BI Dashboard Showcasing Fleet Management Metrics set of slides. The topics discussed in these slides are Cost Trend, Emissions Trend, Accident Trend. This is an immediately available PowerPoint presentation that can be conveniently customized. Download it and convince your audience.
-
 Product Information Management System Dashboard Showing Profit And Loss
This slide shows the dashboard of product information management system. It highlights information related to profit and loss, net income, expenses etc. along with order status of products. Introducing our Product Information Management System Dashboard Showing Profit And Loss set of slides. The topics discussed in these slides are Product Information, Management System, Dashboard Showing, Profit And Loss This is an immediately available PowerPoint presentation that can be conveniently customized. Download it and convince your audience.
-
 Risk Assessment Dashboard Showing Procurement Contracts Status Vendor Management Automation
This slide delineates risk assessment dashboard which can help vendor managers in assessing procurement contract status. It includes information about suppliers, renewals, actions, assessment status, concentration, etc. Deliver an outstanding presentation on the topic using this Risk Assessment Dashboard Showing Procurement Contracts Status Vendor Management Automation. Dispense information and present a thorough explanation of Assessment, Procurement, Status using the slides given. This template can be altered and personalized to fit your needs. It is also available for immediate download. So grab it now.
-
 E Commerce Management Promotion Strategies Metric Dashboard Showcasing E Commerce Website
This slide represents e commerce website dashboard that enables marketers to track status progress. It covers sales breakdown, abandonment carts rate etc. Present the topic in a bit more detail with this E Commerce Management Promotion Strategies Metric Dashboard Showcasing E Commerce Website. Use it as a tool for discussion and navigation on Sales Breakdown, Cart Abandonment Rate, Product Sales Funnel. This template is free to edit as deemed fit for your organization. Therefore download it now.
-
 Electronic Banking Management Metric Dashboard Showcasing Digital Banking
This slide represents metric dashboard for digital banking. It covers credit limit, online limit, interest payment etc. that enables users to track financial transactions. Present the topic in a bit more detail with this Electronic Banking Management Metric Dashboard Showcasing Digital Banking. Use it as a tool for discussion and navigation on Metric Dashboard, Showcasing Digital Banking, Track Financial Transactions. This template is free to edit as deemed fit for your organization. Therefore download it now.
-
 Online Banking Management Metric Dashboard Showcasing Digital Banking
This slide represents metric dashboard for digital banking. It covers credit limit, online limit, interest payment etc. That enables users to track financial transactions. Present the topic in a bit more detail with this Online Banking Management Metric Dashboard Showcasing Digital Banking. Use it as a tool for discussion and navigation on Metric Dashboard, Showcasing Digital Banking, Financial Transactions. This template is free to edit as deemed fit for your organization. Therefore download it now.
-
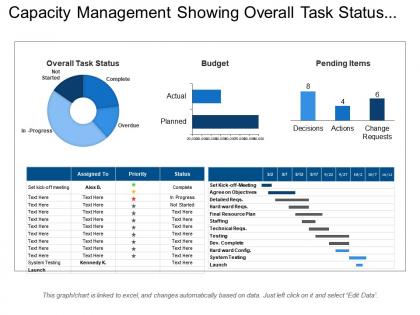 Capacity management showing overall task status budget pending items
Presenting this set of slides with name - Capacity Management Showing Overall Task Status Budget Pending Items. This is a five stage process. The stages in this process are Problem Statement And Solution, Challenges And Solutions, Issues And Solutions.
-
 Hassle free workforce management showing group hug of employees
Presenting this set of slides with name - Hassle Free Workforce Management Showing Group Hug Of Employees. This is a three stage process. The stages in this process are Workforce Management, Wfm, Human Resource Management.
-
 Workforce management showing group of colleague joining hand
Presenting this set of slides with name - Workforce Management Showing Group Of Colleague Joining Hand. This is a four stage process. The stages in this process are Workforce Management, Wfm, Human Resource Management.
-
 Workforce management showing group of people standing together
Presenting this set of slides with name - Workforce Management Showing Group Of People Standing Together. This is a three stage process. The stages in this process are Workforce Management, Wfm, Human Resource Management.
-
 Workforce management showing people achievement as hands frame
Presenting this set of slides with name - Workforce Management Showing People Achievement As Hands Frame. This is a six stage process. The stages in this process are Workforce Management, Wfm, Human Resource Management.
-
 Workforce management showing successful team work as raising hand high
Presenting this set of slides with name - Workforce Management Showing Successful Team Work As Raising Hand High. This is a three stage process. The stages in this process are Workforce Management, Wfm, Human Resource Management.
-
 Workforce management showing view of office with happy employees
Presenting this set of slides with name - Workforce Management Showing View Of Office With Happy Employees. This is a four stage process. The stages in this process are Workforce Management, Wfm, Human Resource Management.
-
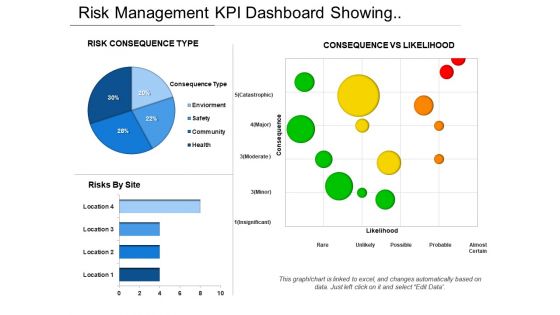 Risk Management Kpi Dashboard Showing Consequence Vs Likelihood
Presenting this set of slides with name - Risk Management Kpi Dashboard Showing Consequence Vs Likelihood. This is a three stage process. The stages in this process are Risk Management, Risk Assessment, Project Risk.
-
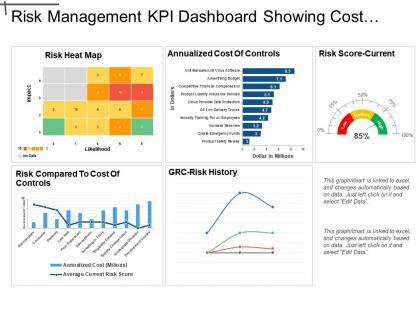 Risk Management Kpi Dashboard Showing Cost Of Control And Risk Score
Presenting this set of slides with name - Risk Management Kpi Dashboard Showing Cost Of Control And Risk Score. This is a five stage process. The stages in this process are Risk Management, Risk Assessment, Project Risk.
-
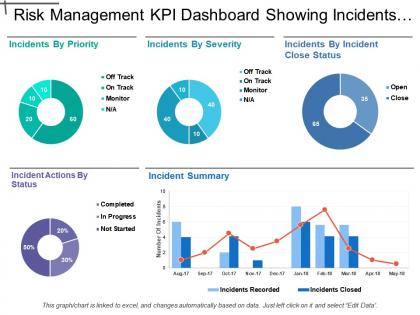 Risk Management Kpi Dashboard Showing Incidents By Priority And Severity
Presenting this set of slides with name - Risk Management Kpi Dashboard Showing Incidents By Priority And Severity. This is a four stage process. The stages in this process are Risk Management, Risk Assessment, Project Risk.
-
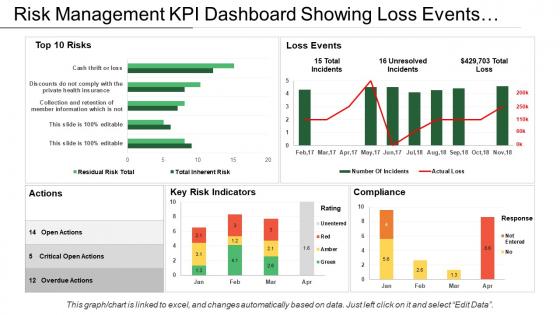 Risk management kpi dashboard showing loss events actions and compliance
Presenting this set of slides with name - Risk Management Kpi Dashboard Showing Loss Events Actions And Compliance. This is a four stage process. The stages in this process are Risk Management, Risk Assessment, Project Risk.
-
 Risk Management Kpi Dashboard Showing Open Issues And Control Performance
Presenting this set of slides with name - Risk Management Kpi Dashboard Showing Open Issues And Control Performance. This is a five stage process. The stages in this process are Risk Management, Risk Assessment, Project Risk.
-
 Risk Management Kpi Dashboard Showing Overall Security Risk And Regulatory
Presenting this set of slides with name - Risk Management Kpi Dashboard Showing Overall Security Risk And Regulatory Compliance. This is a four stage process. The stages in this process are Risk Management, Risk Assessment, Project Risk.
-
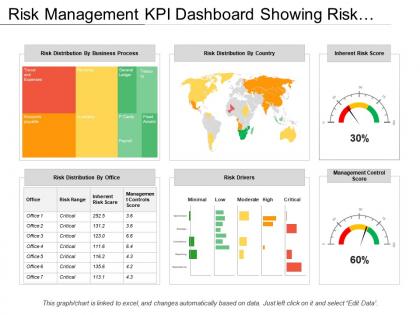 Risk Management Kpi Dashboard Showing Risk Distribution By Country Office
Presenting this set of slides with name - Risk Management Kpi Dashboard Showing Risk Distribution By Country Office And Business Process. This is a six stage process. The stages in this process are Risk Management, Risk Assessment, Project Risk.
-
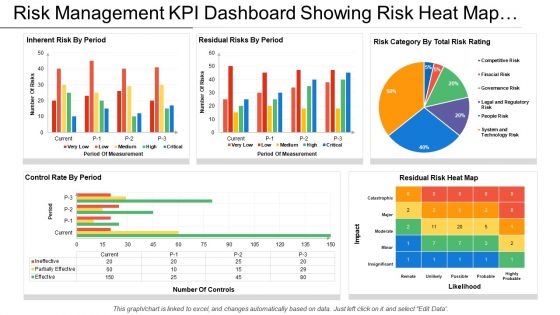 Risk Management Kpi Dashboard Showing Risk Heat Map And Control Rate By
Presenting this set of slides with name - Risk Management Kpi Dashboard Showing Risk Heat Map And Control Rate By Period. This is a five stage process. The stages in this process are Risk Management, Risk Assessment, Project Risk.
-
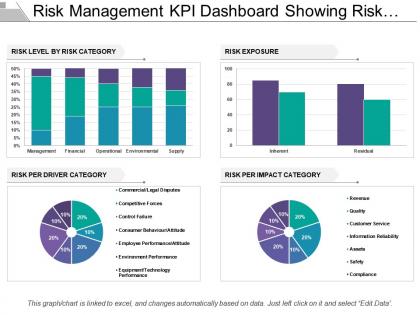 Risk Management Kpi Dashboard Showing Risk Level Exposure And Impact
Presenting this set of slides with name - Risk Management Kpi Dashboard Showing Risk Level Exposure And Impact Category. This is a four stage process. The stages in this process are Risk Management, Risk Assessment, Project Risk.
-
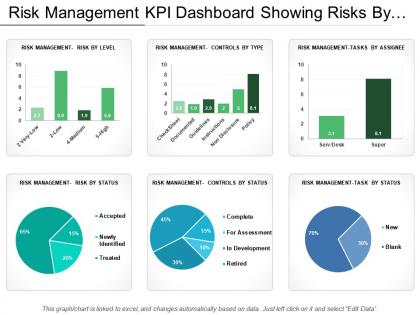 Risk Management Kpi Dashboard Showing Risks By Level Assignee And Status
Presenting this set of slides with name - Risk Management Kpi Dashboard Showing Risks By Level Assignee And Status. This is a six stage process. The stages in this process are Risk Management, Risk Assessment, Project Risk.
-
 Budget forecast showing expense management and expenses
Presenting this set of slides with name - Budget Forecast Showing Expense Management And Expenses. This is a three stage process. The stages in this process are Budget Forecast, Forecast Vs Actual Budget, Plan Vs Forecast.
-
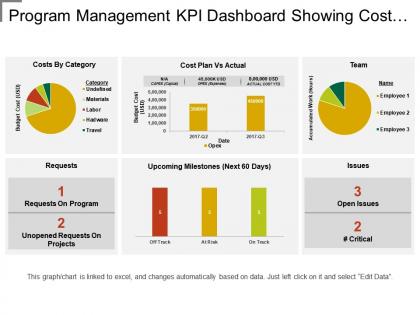 Program management kpi dashboard showing cost plan vs actual
Presenting this set of slides with name - Program Management Kpi Dashboard Showing Cost Plan Vs Actual. This is a six stage process. The stages in this process are Program Development, Human Resource Management, Program Management.
-
 Program management kpi dashboard showing estimated vs actual chart
Presenting this set of slides with name - Program Management Kpi Dashboard Showing Estimated Vs Actual Chart. This is a four stage process. The stages in this process are Program Development, Human Resource Management, Program Management.
-
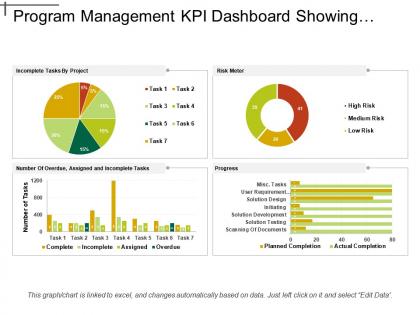 Program management kpi dashboard showing incomplete tasks and risk meter
Presenting this set of slides with name - Program Management Kpi Dashboard Showing Incomplete Tasks And Risk Meter. This is a four stage process. The stages in this process are Program Development, Human Resource Management, Program Management.
-
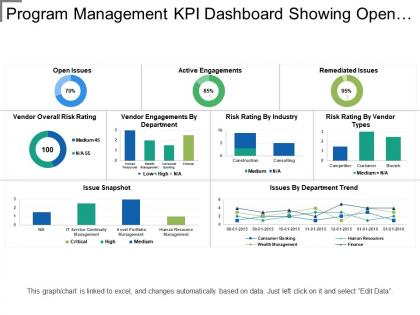 Program management kpi dashboard showing open issues and risk rating
Presenting this set of slides with name - Program Management Kpi Dashboard Showing Open Issues And Risk Rating. This is a three stage process. The stages in this process are Program Development, Human Resource Management, Program Management.
-
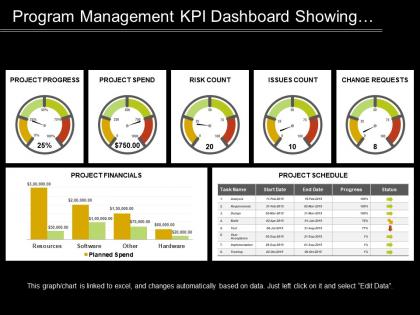 Program management kpi dashboard showing progress spend and risk count
Presenting this set of slides with name - Program Management Kpi Dashboard Showing Progress Spend And Risk Count. This is a three stage process. The stages in this process are Program Development, Human Resource Management, Program Management.
-
 Program management kpi dashboard showing project health and progress
Presenting this set of slides with name - Program Management Kpi Dashboard Showing Project Health And Progress. This is a six stage process. The stages in this process are Program Development, Human Resource Management, Program Management.
-
 Program management kpi dashboard showing task status and budget health
Presenting Program Management KPI Dashboard Showing Task Status And Budget Health PPT slide. The task status dashboard PowerPoint template designed professionally by the team of SlideTeam to present the current status of the project. The different icons such as pie chart, semi-circle, square box, line chart and many other which include text in the Budget health dashboard slide are customizable in PowerPoint. A user can populate the pie chart and line chart values by editing the excel table and it is also compatible with Google Slide. A user can alter the font size, font type, color and dimensions of the line chart and pie chart to show the desired values.
-
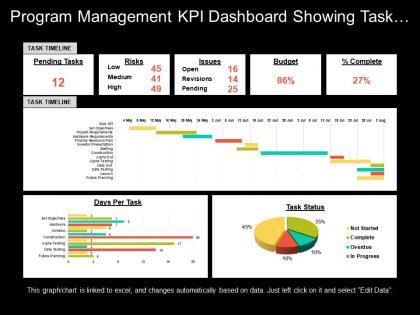 Program management kpi dashboard showing task timeline risks and budget
Presenting Program Management KPI Dashboard Showing Task Timeline Risks And Budget PPT slide. The task timeline dashboard PowerPoint template designed professionally by the team of SlideTeam to present the values over time. The different icons such as pie chart, line chart, as well as other figures and text in the Graphical Chart KPI dashboard slide are customizable in PowerPoint. A user can illustrate the desired numerical information because the graphical management dashboard template gets linked with Excel Sheet. The management dashboard slide is compatible with Google Slide. You may edit the font size, font type, color and dimensions of the different chart to present the desired numerical information.
-
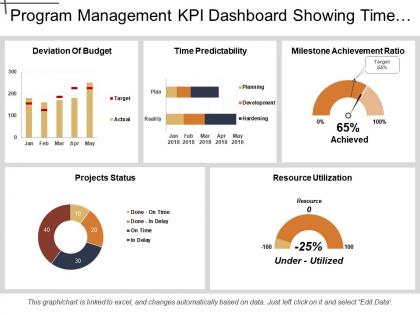 Program management kpi dashboard showing time predictability and resource utilization
Presenting Program Management KPI Dashboard Showing Time Predictability And Resource Utilization PPT slide. The graphical Program Management dashboard PowerPoint template designed by the professional team of SlideTeam to present the different parameters that are essential for any project. The different charts such as line and pie chart, along with that the text in the KPI dashboard slide are editable in PowerPoint. Moreover, this slide is compatible with Google Slide. An individual can edit the font size, font type, color and dimensions of the different figures according to the requirement.
-
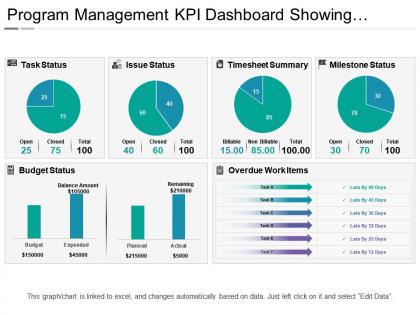 Program management kpi dashboard showing timesheet summary
Presenting Program Management KPI Dashboard Showing Timesheet Summary PPT slide. The Program management KPI dashboard PowerPoint template designed professionally by the team of SlideTeam to present the record of timesheet summary to do any task. The pie chart and line chart figures along with that the text in the timesheet summary dashboard slide are customizable in PowerPoint. A user can illustrate the specific time to do any task because the pie chart dashboard template gets linked with Excel Sheet along with that it is also compatible with Google Slide. A user can alter the font size, font type, color, as well as dimensions of the pie and line chart to present the specific time.
-
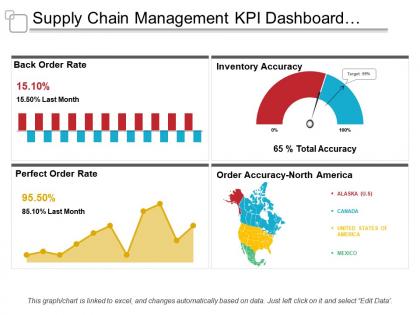 Supply chain management kpi dashboard showing back order rate and order accuracy
Presenting this set of slides with name - Supply Chain Management Kpi Dashboard Showing Back Order Rate And Order Accuracy. This is a four stage process. The stages in this process are Demand Forecasting, Predicting Future Demand, Supply Chain Management.


