Powerpoint Templates and Google slides for Management Kpi Dashboard
Save Your Time and attract your audience with our fully editable PPT Templates and Slides.
-
 Assessing Impact Of Sales Risk Management With KPI Dashboard Deploying Sales Risk Management
The following slide highlights some key performance indicators KPIs to measure the influence of executing sales risk management strategies on revenue performance. It includes elements such as target attainment rate, gross profit, annual growth rate etc. Present the topic in a bit more detail with this Assessing Impact Of Sales Risk Management With KPI Dashboard Deploying Sales Risk Management. Use it as a tool for discussion and navigation on Sales Target, Previous Year Sales, Gross Profit. This template is free to edit as deemed fit for your organization. Therefore download it now.
-
 Cash Performance Analysis With KPI Dashboard Defining Business Performance Management
The following slide depicts finance performance of company to manage cash transactions and invest finances appropriately. It includes elements such as quick ratio, current ratio, payables outstanding, sales outstanding, working capital etc. Present the topic in a bit more detail with this Cash Performance Analysis With KPI Dashboard Defining Business Performance Management. Use it as a tool for discussion and navigation on Days Sales Outstanding, Inventory Outstanding, Payable Outstanding. This template is free to edit as deemed fit for your organization. Therefore download it now.
-
 Sales Performance Analysis With KPI Dashboard Defining Business Performance Management
The following slide depicts the sales performance to assessment dashboard to compare past and current insights. It includes elements such as new customers, revenue, sales target, customer lifetime, annual acquisition cost,profit etc.Deliver an outstanding presentation on the topic using this Sales Performance Analysis With KPI Dashboard Defining Business Performance Management. Dispense information and present a thorough explanation of Average Revenue, Customer Lifetime Value, Customer Acquisition Cost using the slides given. This template can be altered and personalized to fit your needs. It is also available for immediate download. So grab it now.
-
 KPI Dashboard To Track Supplier Relationship Management Impact Business Relationship Management To Build
Mentioned slide provides information about various key performance indicators which can be used to evaluate impact of relations management on suppliers performance, it includes key points such as total suppliers, contracted, unlisted, average procurement cycle, suppliers share by different products. etc. Present the topic in a bit more detail with this KPI Dashboard To Track Supplier Relationship Management Impact Business Relationship Management To Build. Use it as a tool for discussion and navigation on Suppliers By Different Products, Procurement Cycle. This template is free to edit as deemed fit for your organization. Therefore download it now.
-
 KPI Dashboard To Assess Training Program Effectiveness Performance Management Techniques
This slide covers KPI dashboard to assess training program effectiveness. It involves details such as overall responses on monthly basis, employee satisfaction rate, net promoter score and major training courses. Present the topic in a bit more detail with this KPI Dashboard To Assess Training Program Effectiveness Performance Management Techniques. Use it as a tool for discussion and navigation on Employee Satisfaction, Assess Training, Program Effectiveness. This template is free to edit as deemed fit for your organization. Therefore download it now.
-
 KPI Dashboard To Track Employee Performance In Organization Performance Management Techniques
This slide covers KPI dashboard to track employee performance at workplace. It involves details such as productivity rate, labour effectiveness rate, absentee rate and turnover ratio. Deliver an outstanding presentation on the topic using this KPI Dashboard To Track Employee Performance In Organization Performance Management Techniques. Dispense information and present a thorough explanation of Productivity Rate, Labor Effectiveness, Deductions For Leaves using the slides given. This template can be altered and personalized to fit your needs. It is also available for immediate download. So grab it now.
-
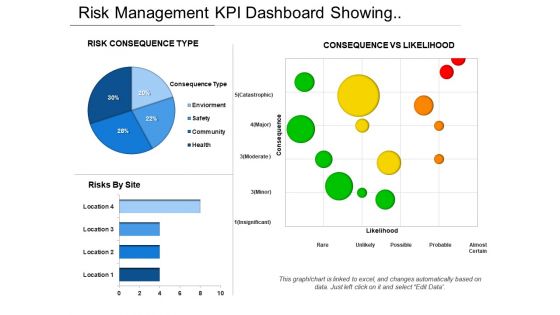 Risk Management Kpi Dashboard Showing Consequence Vs Likelihood
Presenting this set of slides with name - Risk Management Kpi Dashboard Showing Consequence Vs Likelihood. This is a three stage process. The stages in this process are Risk Management, Risk Assessment, Project Risk.
-
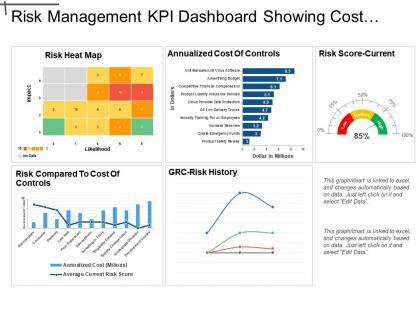 Risk Management Kpi Dashboard Showing Cost Of Control And Risk Score
Presenting this set of slides with name - Risk Management Kpi Dashboard Showing Cost Of Control And Risk Score. This is a five stage process. The stages in this process are Risk Management, Risk Assessment, Project Risk.
-
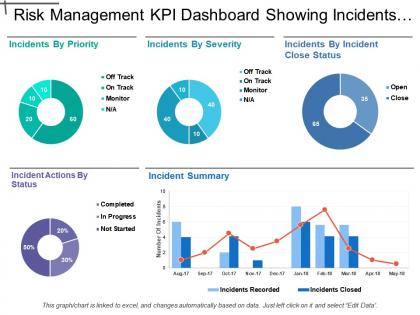 Risk Management Kpi Dashboard Showing Incidents By Priority And Severity
Presenting this set of slides with name - Risk Management Kpi Dashboard Showing Incidents By Priority And Severity. This is a four stage process. The stages in this process are Risk Management, Risk Assessment, Project Risk.
-
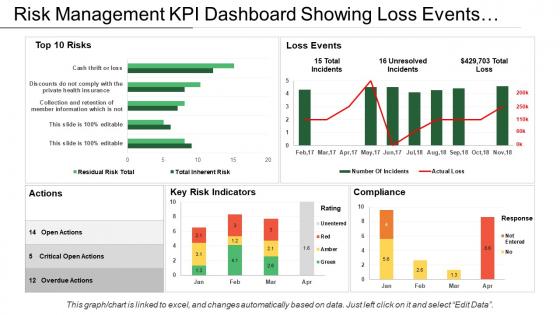 Risk management kpi dashboard showing loss events actions and compliance
Presenting this set of slides with name - Risk Management Kpi Dashboard Showing Loss Events Actions And Compliance. This is a four stage process. The stages in this process are Risk Management, Risk Assessment, Project Risk.
-
 Risk Management Kpi Dashboard Showing Open Issues And Control Performance
Presenting this set of slides with name - Risk Management Kpi Dashboard Showing Open Issues And Control Performance. This is a five stage process. The stages in this process are Risk Management, Risk Assessment, Project Risk.
-
 Risk Management Kpi Dashboard Showing Overall Security Risk And Regulatory
Presenting this set of slides with name - Risk Management Kpi Dashboard Showing Overall Security Risk And Regulatory Compliance. This is a four stage process. The stages in this process are Risk Management, Risk Assessment, Project Risk.
-
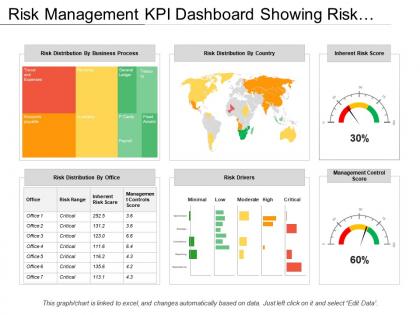 Risk Management Kpi Dashboard Showing Risk Distribution By Country Office
Presenting this set of slides with name - Risk Management Kpi Dashboard Showing Risk Distribution By Country Office And Business Process. This is a six stage process. The stages in this process are Risk Management, Risk Assessment, Project Risk.
-
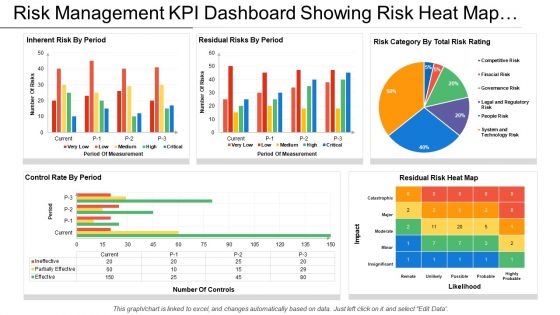 Risk Management Kpi Dashboard Showing Risk Heat Map And Control Rate By
Presenting this set of slides with name - Risk Management Kpi Dashboard Showing Risk Heat Map And Control Rate By Period. This is a five stage process. The stages in this process are Risk Management, Risk Assessment, Project Risk.
-
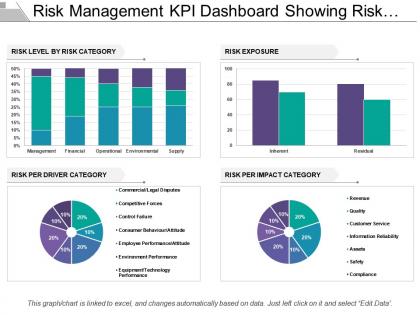 Risk Management Kpi Dashboard Showing Risk Level Exposure And Impact
Presenting this set of slides with name - Risk Management Kpi Dashboard Showing Risk Level Exposure And Impact Category. This is a four stage process. The stages in this process are Risk Management, Risk Assessment, Project Risk.
-
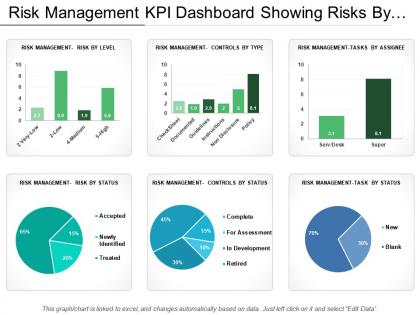 Risk Management Kpi Dashboard Showing Risks By Level Assignee And Status
Presenting this set of slides with name - Risk Management Kpi Dashboard Showing Risks By Level Assignee And Status. This is a six stage process. The stages in this process are Risk Management, Risk Assessment, Project Risk.
-
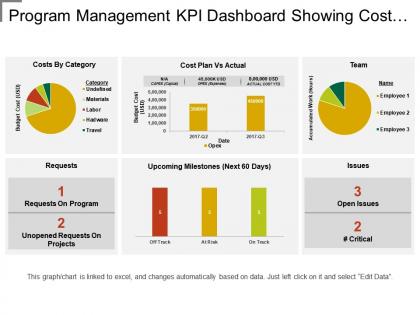 Program management kpi dashboard showing cost plan vs actual
Presenting this set of slides with name - Program Management Kpi Dashboard Showing Cost Plan Vs Actual. This is a six stage process. The stages in this process are Program Development, Human Resource Management, Program Management.
-
 Program management kpi dashboard showing estimated vs actual chart
Presenting this set of slides with name - Program Management Kpi Dashboard Showing Estimated Vs Actual Chart. This is a four stage process. The stages in this process are Program Development, Human Resource Management, Program Management.
-
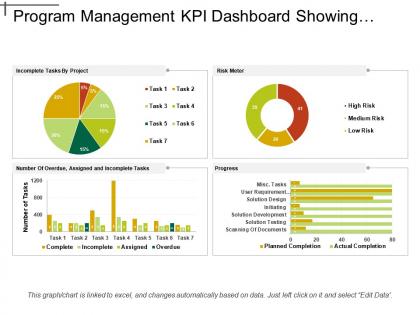 Program management kpi dashboard showing incomplete tasks and risk meter
Presenting this set of slides with name - Program Management Kpi Dashboard Showing Incomplete Tasks And Risk Meter. This is a four stage process. The stages in this process are Program Development, Human Resource Management, Program Management.
-
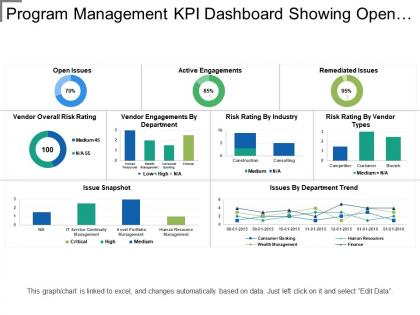 Program management kpi dashboard showing open issues and risk rating
Presenting this set of slides with name - Program Management Kpi Dashboard Showing Open Issues And Risk Rating. This is a three stage process. The stages in this process are Program Development, Human Resource Management, Program Management.
-
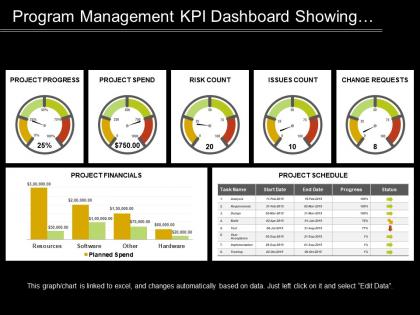 Program management kpi dashboard showing progress spend and risk count
Presenting this set of slides with name - Program Management Kpi Dashboard Showing Progress Spend And Risk Count. This is a three stage process. The stages in this process are Program Development, Human Resource Management, Program Management.
-
 Program management kpi dashboard showing project health and progress
Presenting this set of slides with name - Program Management Kpi Dashboard Showing Project Health And Progress. This is a six stage process. The stages in this process are Program Development, Human Resource Management, Program Management.
-
 Program management kpi dashboard showing task status and budget health
Presenting Program Management KPI Dashboard Showing Task Status And Budget Health PPT slide. The task status dashboard PowerPoint template designed professionally by the team of SlideTeam to present the current status of the project. The different icons such as pie chart, semi-circle, square box, line chart and many other which include text in the Budget health dashboard slide are customizable in PowerPoint. A user can populate the pie chart and line chart values by editing the excel table and it is also compatible with Google Slide. A user can alter the font size, font type, color and dimensions of the line chart and pie chart to show the desired values.
-
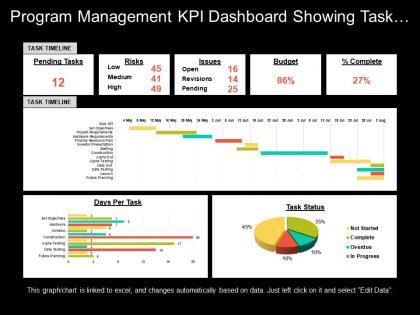 Program management kpi dashboard showing task timeline risks and budget
Presenting Program Management KPI Dashboard Showing Task Timeline Risks And Budget PPT slide. The task timeline dashboard PowerPoint template designed professionally by the team of SlideTeam to present the values over time. The different icons such as pie chart, line chart, as well as other figures and text in the Graphical Chart KPI dashboard slide are customizable in PowerPoint. A user can illustrate the desired numerical information because the graphical management dashboard template gets linked with Excel Sheet. The management dashboard slide is compatible with Google Slide. You may edit the font size, font type, color and dimensions of the different chart to present the desired numerical information.
-
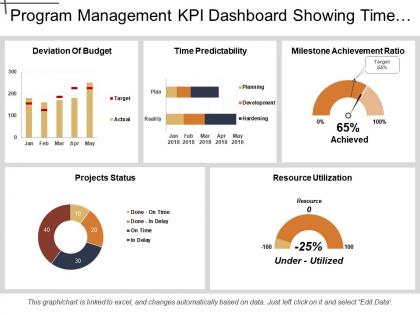 Program management kpi dashboard showing time predictability and resource utilization
Presenting Program Management KPI Dashboard Showing Time Predictability And Resource Utilization PPT slide. The graphical Program Management dashboard PowerPoint template designed by the professional team of SlideTeam to present the different parameters that are essential for any project. The different charts such as line and pie chart, along with that the text in the KPI dashboard slide are editable in PowerPoint. Moreover, this slide is compatible with Google Slide. An individual can edit the font size, font type, color and dimensions of the different figures according to the requirement.
-
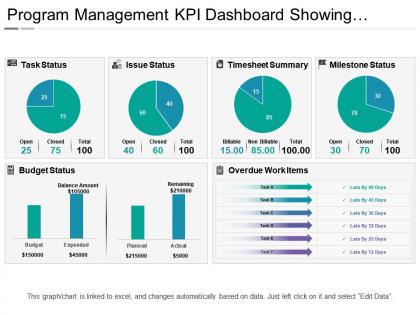 Program management kpi dashboard showing timesheet summary
Presenting Program Management KPI Dashboard Showing Timesheet Summary PPT slide. The Program management KPI dashboard PowerPoint template designed professionally by the team of SlideTeam to present the record of timesheet summary to do any task. The pie chart and line chart figures along with that the text in the timesheet summary dashboard slide are customizable in PowerPoint. A user can illustrate the specific time to do any task because the pie chart dashboard template gets linked with Excel Sheet along with that it is also compatible with Google Slide. A user can alter the font size, font type, color, as well as dimensions of the pie and line chart to present the specific time.
-
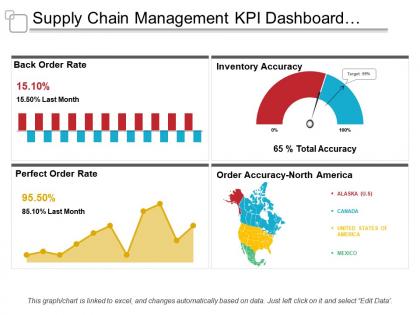 Supply chain management kpi dashboard showing back order rate and order accuracy
Presenting this set of slides with name - Supply Chain Management Kpi Dashboard Showing Back Order Rate And Order Accuracy. This is a four stage process. The stages in this process are Demand Forecasting, Predicting Future Demand, Supply Chain Management.
-
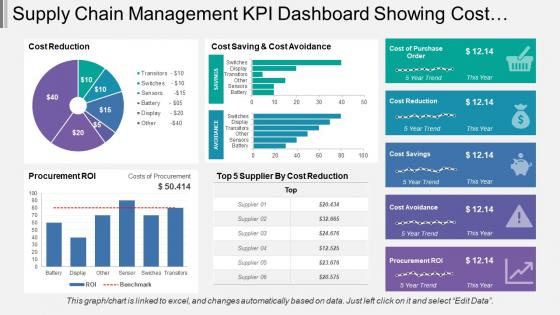 Supply Chain Management Kpi Dashboard Showing Cost Reduction And Procurement Roi
Presenting this set of slides with name - Supply Chain Management Kpi Dashboard Showing Cost Reduction And Procurement Roi. This is a five stage process. The stages in this process are Demand Forecasting, Predicting Future Demand, Supply Chain Management.
-
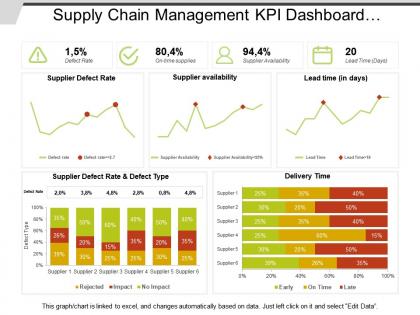 Supply chain management kpi dashboard showing defect rate and delivery time
Presenting this set of slides with name - Supply Chain Management Kpi Dashboard Showing Defect Rate And Delivery Time. This is a three stage process. The stages in this process are Demand Forecasting, Predicting Future Demand, Supply Chain Management.
-
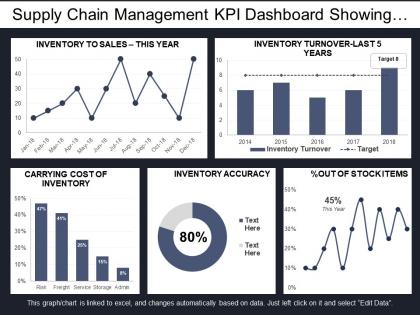 Supply chain management kpi dashboard showing inventory accuracy and turnover
Presenting this set of slides with name - Supply Chain Management Kpi Dashboard Showing Inventory Accuracy And Turnover. This is a five stage process. The stages in this process are Demand Forecasting, Predicting Future Demand, Supply Chain Management.
-
 Supply chain management kpi dashboard showing order status volume and inventory
Presenting this set of slides with name - Supply Chain Management Kpi Dashboard Showing Order Status Volume And Inventory. This is a two stage process. The stages in this process are Demand Forecasting, Predicting Future Demand, Supply Chain Management.
-
 Supply chain management kpi dashboard showing procurement vs utilization
Presenting this set of slides with name - Supply Chain Management Kpi Dashboard Showing Procurement Vs Utilization. This is a six stage process. The stages in this process are Demand Forecasting, Predicting Future Demand, Supply Chain Management.
-
 Supply chain management kpi dashboard showing quarterly inventory and asset turnover
Presenting this set of slides with name - Supply Chain Management Kpi Dashboard Showing Quarterly Inventory And Asset Turnover. This is a ten stage process. The stages in this process are Demand Forecasting, Predicting Future Demand, Supply Chain Management.
-
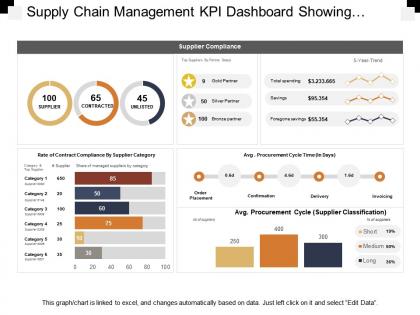 Supply chain management kpi dashboard showing supplier compliance stats
Presenting this set of slides with name - Supply Chain Management Kpi Dashboard Showing Supplier Compliance Stats. This is a four stage process. The stages in this process are Demand Forecasting, Predicting Future Demand, Supply Chain Management.
-
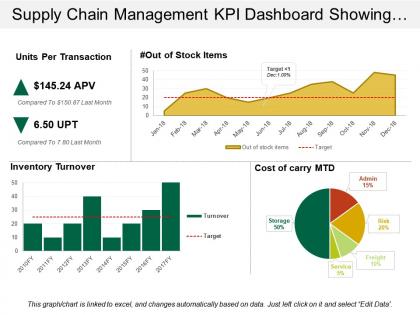 Supply chain management kpi dashboard showing units per transaction
Presenting predesigned Supply Chain Management KPI Dashboard Showing Warehouse Operating Costs PPT slide. Download of the template design is simple. You can modify the layout font type, font size, colors and the background as per needs. Template slide is fully flexible with Google Slides and other online software’s. You can alter the design using the instructional slides provided with the template. You can remove the watermark with your brand name, trademark, signature or logo. You can save the template into PNG or JPEG formats. Supreme quality layouts are used to create this template which is editable in PowerPoint. Sample content can be replaced with your presentation content.
-
 Supply chain management kpi dashboard showing warehouse operating costs
Presenting predesigned Supply Chain Management KPI Dashboard Showing Warehouse Operating Costs PPT slide. Download of the template design is simple. You can modify the layout font type, font size, colors and the background as per needs. Template slide is fully flexible with Google Slides and other online software’s. You can alter the design using the instructional slides provided with the template. You can remove the watermark with your brand name, trademark, signature or logo. You can save the template into PNG or JPEG formats. Supreme quality layouts are used to create this template which is editable in PowerPoint. Sample content can be replaced with your presentation content.
-
 Workforce kpi dashboard showing resignation rate manager instability rate and performance workflow process
Presenting this set of slides with name - Workforce Kpi Dashboard Showing Resignation Rate Manager Instability Rate And Performance Workflow Process. This is a six stage process. The stages in this process are Staff, Personnel, Workforce.
-
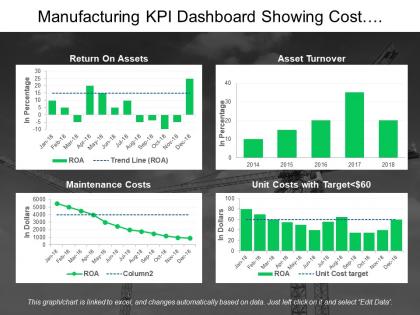 Manufacturing kpi dashboard showing cost management and asset turnover
Presenting this set of slides with name - Manufacturing Kpi Dashboard Showing Cost Management And Asset Turnover. This is a four stage process. The stages in this process are Manufacturing, Production, Manufacture.
-
 Financial hospitality management kpi and dashboard
Increase audience engagement and knowledge by dispensing information using Financial Hospitality Management KPI And Dashboard. This template helps you present information on three stages. You can also present information on Minimum, Medium, Maximum using this PPT design. This layout is completely editable so personaize it now to meet your audiences expectations.
-
 Hospitality management kpi and dashboard icons slide
Presenting our premium Hospitality Management KPI And Dashboard Icons Slide set of slides with flexible icons. The icons are designed by our group of professionals. Add these Hospitality Management KPI And Dashboard Icons Slide to your presentation to make it visually appealing. Also, edit them according to your requirement. Download it and captive your audience.
-
 Agile Methodology For Data Migration Project It Project Risk Management Kpi Dashboard
This slide displays project risk management dashboard with KPIS namely risks, assumptions, issues, dependencies, actions and repairs. Deliver an outstanding presentation on the topic using this Agile Methodology For Data Migration Project It Project Risk Management Kpi Dashboard. Dispense information and present a thorough explanation of Project Risk Management Kpi Dashboard using the slides given. This template can be altered and personalized to fit your needs. It is also available for immediate download. So grab it now.
-
 Operational Risk Management KPIs Dashboard Snapshot Icon
Introducing our premium set of slides with Operational Risk Management KPIs Dashboard Snapshot Icon. Ellicudate the four stages and present information using this PPT slide. This is a completely adaptable PowerPoint template design that can be used to interpret topics like Operational Risk Management KPIs Dashboard Icon. So download instantly and tailor it with your information.
-
 Project Risk Management Kpi Dashboard Using Agile In Data Transformation Project It
This slide displays project risk management dashboard with KPIS namely risks, assumptions, issues, dependencies, actions and repairs. Deliver an outstanding presentation on the topic using this Project Risk Management Kpi Dashboard Using Agile In Data Transformation Project It. Dispense information and present a thorough explanation of Assumptions, Dependencie, Dashboard using the slides given. This template can be altered and personalized to fit your needs. It is also available for immediate download. So grab it now.
-
 Manager Checking PMO KPI Dashboard
Presenting our set of slides with Manager Checking PMO KPI Dashboard. This exhibits information on three stages of the process. This is an easy to edit and innovatively designed PowerPoint template. So download immediately and highlight information on Manager Checking PMO KPI Dashboard.
-
 Manager Checking Campaign Dashboard To Track Product Promotion KPIs
Presenting our set of slides with Manager Checking Campaign Dashboard To Track Product Promotion KPIs. This exhibits information on three stages of the process. This is an easy to edit and innovatively designed PowerPoint template. So download immediately and highlight information on Manager Checking Campaign Dashboard To Track Product Promotion KPIs.
-
 Customer Checkout Behavior Kpi Dashboard Analyzing And Implementing Management System
This slide represents the dashboard to help management in analyzing the point at which customers leave the checkout process. It includes details related to KPIs such as shipping drop-off, payment drop-off etc. Present the topic in a bit more detail with this Customer Checkout Behavior Kpi Dashboard Analyzing And Implementing Management System. Use it as a tool for discussion and navigation on Dashboard, Comparison Period, Session With Transaction. This template is free to edit as deemed fit for your organization. Therefore download it now.
-
 Customer Checkout Behavior KPI Dashboard Ecommerce Management System
This slide represents the dashboard to help management in analyzing the point at which customers leave the checkout process. It includes details related to KPIs such as shipping drop off, payment drop off etc. Present the topic in a bit more detail with this Customer Checkout Behavior KPI Dashboard Ecommerce Management System. Use it as a tool for discussion and navigation on Information Dropoff, Shipping Dropoff, Payment Dropoff. This template is free to edit as deemed fit for your organization. Therefore download it now.
-
 Customer Checkout Behavior Kpi Dashboard Content Management System Deployment
This slide represents the dashboard to help management in analyzing the point at which customers leave the checkout process. It includes details related to KPIs such as shipping drop-off, payment drop-off etc. Present the topic in a bit more detail with this Customer Checkout Behavior Kpi Dashboard Content Management System Deployment. Use it as a tool for discussion and navigation on Dashboard, Information, Management. This template is free to edit as deemed fit for your organization. Therefore download it now.
-
 Customer Checkout Behavior KPI Dashboard Implementing Ecommerce Management
This slide represents the dashboard to help management in analyzing the point at which customers leave the checkout process. It includes details related to KPIs such as shipping drop-off, payment drop off etc. Deliver an outstanding presentation on the topic using this Customer Checkout Behavior KPI Dashboard Implementing Ecommerce Management. Dispense information and present a thorough explanation of Information Dropoff, Shipping Dropoff, Payment Dropoff using the slides given. This template can be altered and personalized to fit your needs. It is also available for immediate download. So grab it now.
-
 Workforce Appraisal Status Monitoring Kpi Dashboard Effective Employee Performance Management Framework
The following slide depicts the overview of employee appraisal tracking summary to align goals and system. It includes key elements such as stages, employee ID, name, feedback status pending, done, due etc. Deliver an outstanding presentation on the topic using this Workforce Appraisal Status Monitoring Kpi Dashboard Effective Employee Performance Management Framework. Dispense information and present a thorough explanation of Providing Feedback, Appraisals Consolidation, Appraisals Final Review using the slides given. This template can be altered and personalized to fit your needs. It is also available for immediate download. So grab it now.
-
 KPI Dashboard To Track Agile Release Management Transformation Data
The following slide exhibits dashboard to track data sets relating to sprint and release management. It presents information related to velocity, task status, etc.Introducing our KPI Dashboard To Track Agile Release Management Transformation Data set of slides. The topics discussed in these slides are Incomplete Tasks, Scope Changes, Hours Worked. This is an immediately available PowerPoint presentation that can be conveniently customized. Download it and convince your audience.
-
 Marketing Team Performance Management Dashboard With KPIS
This slide represents dashboard created for the measurement of the performance of the marketing team. It includes key performance indicators of total revenue, revenue per acquisition, leads, acquisitions, marketing spend, cost per acquisition, profit, profit per acquisition and return on investment. Introducing our Marketing Team Performance Management Dashboard With KPIS set of slides. The topics discussed in these slides are Marketing Team, Performance Management, Dashboard With KPIS. This is an immediately available PowerPoint presentation that can be conveniently customized. Download it and convince your audience.
-
 Organization Financial Performance Management Dashboard With KPIS
This slide shows the dashboard representing the financial position of the organization for the measurement of performance of the organizations finance department. It includes details related to current working capital, cash conversion cycle and vendor payment rate etc. Presenting our well structured Organization Financial Performance Management Dashboard With KPIS. The topics discussed in this slide are Current Working Capital, Cash Conversion, Working Capital. This is an instantly available PowerPoint presentation that can be edited conveniently. Download it right away and captivate your audience.
-
 Sales Management System Kpis Dashboard
This slide illustrates key performance metrics for sales team of a business organization to track the team performance. It includes performance indicators of sales team, sales funnel, etc. Introducing our Sales Management System Kpis Dashboard set of slides. The topics discussed in these slides are Average Monthly Tasks, Emails, Target. This is an immediately available PowerPoint presentation that can be conveniently customized. Download it and convince your audience.
-
 Project Management Compliance KPI Dashboard Icon
Presenting our set of slides with Project Management Compliance KPI Dashboard Icon. This exhibits information on three stages of the process. This is an easy to edit and innovatively designed PowerPoint template. So download immediately and highlight information on Management, Compliance, Project.
-
 Dashboard Icon Showcasing Change Management Kpis
Introducing our premium set of slides with Dashboard Icon Showcasing Change Management Kpis. Ellicudate the three stages and present information using this PPT slide. This is a completely adaptable PowerPoint template design that can be used to interpret topics like Dashboard Icon, Showcasing Change Management Kpis. So download instantly and tailor it with your information.
-
 Dashboard To Track Inventory Management KPIS Implementing Strategies For Inventory
This slide showcases KPIs that can help organization to evaluate the efficiency of inventory management process. Its key KPIs are out of stock rate, on time full deliveries, inventory turnover and average time to sell. Deliver an outstanding presentation on the topic using this Dashboard To Track Inventory Management KPIS Implementing Strategies For Inventory. Dispense information and present a thorough explanation of Freshness, Products, Inventory using the slides given. This template can be altered and personalized to fit your needs. It is also available for immediate download. So grab it now.
-
 Customer Checkout Behavior KPI Dashboard Electronic Commerce Management Platform Deployment
This slide represents the dashboard to help management in analyzing the point at which customers leave the checkout process. It includes details related to KPIs such as shipping drop off, payment drop off etc.Deliver an outstanding presentation on the topic using this Customer Checkout Behavior KPI Dashboard Electronic Commerce Management Platform Deployment. Dispense information and present a thorough explanation of Information Dropoff, Shipping Dropoff, Payment Dropoff using the slides given. This template can be altered and personalized to fit your needs. It is also available for immediate download. So grab it now.
-
 Dashboard To Track And Analyse Change Management Training Kpis Role Of Training In Effective
This slide represents the KPI dashboard to track and monitor the effectiveness of change management training program conducted by the organization. It includes key metrics such as active employees, no.of trainings, cost etc. Increase audience engagement and knowledge by dispensing information using Dashboard To Track And Analyse Change Management Training Kpis Role Of Training In Effective. This template helps you present information on one stages. You can also present information on Metrics, Kpis, Cost Per Employee using this PPT design. This layout is completely editable so personaize it now to meet your audiences expectations.
-
 Performance Management Kpi Dashboard Snapshot Ppt Slide
Presenting performance management kpi dashboard snapshot ppt slide. This is a performance management kpi dashboard ppt slide. This is a five stage process. The stages in this process are product, sold products, compare to, south, north, actual, change, successful adverts, jan, feb, mar, apr, earned revenue, average, target, outcasts, operations.


