Powerpoint Templates and Google slides for KPIs Dashboard
Save Your Time and attract your audience with our fully editable PPT Templates and Slides.
-
 KPI Dashboard to Measure Overall Business Performance App developer playbook
Deliver an outstanding presentation on the topic using this KPI Dashboard To Measure Overall Business Performance App Developer Playbook. Dispense information and present a thorough explanation of KPI Dashboard To Measure Overall Business Performance using the slides given. This template can be altered and personalized to fit your needs. It is also available for immediate download. So grab it now.
-
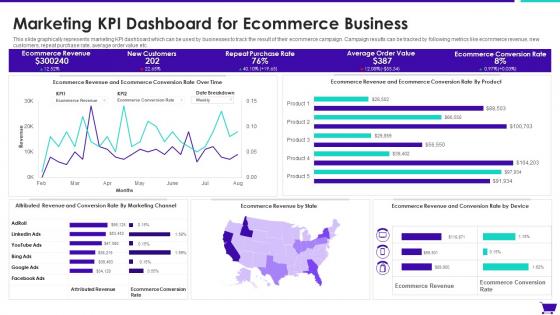 Marketing KPI Dashboard For Ecommerce Business
This slide graphically represents marketing KPI dashboard which can be used by businesses to track the result of their ecommerce campaign. Campaign results can be tracked by following metrics like ecommerce revenue, new customers, repeat purchase rate, average order value etc. Introducing our Marketing KPI Dashboard For Ecommerce Business set of slides. The topics discussed in these slides are Average, Purchase Rate, Customers. This is an immediately available PowerPoint presentation that can be conveniently customized. Download it and convince your audience.
-
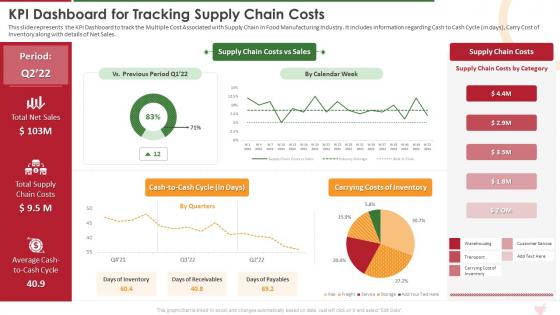 Kpi Dashboard For Tracking Supply Chain Costs Industry Report For Food Manufacturing Sector
This slide represents the KPI Dashboard to track the Multiple Cost Associated with Supply Chain in Food Manufacturing Industry. It includes information regarding Cash to Cash Cycle in days, Carry Cost of Inventory along with details of Net Sales. Present the topic in a bit more detail with this Kpi Dashboard For Tracking Supply Chain Costs Industry Report For Food Manufacturing Sector. Use it as a tool for discussion and navigation on Carrying Costs Of Inventory, Cash To Cash Cycle, Supply Chain Costs. This template is free to edit as deemed fit for your organization. Therefore download it now.
-
 Corporate KPI Dashboard Showing Bounce Rate With New Users Data
This graph or chart is linked to excel, and changes automatically based on data. Just left click on it and select Edit Data. Presenting our well structured Corporate KPI Dashboard Showing Bounce Rate With New Users Data. The topics discussed in this slide are New Sessions, Unique Pageviews, Time on Page, Bounce Rate, User Demographics, Visitor Statistics. This is an instantly available PowerPoint presentation that can be edited conveniently. Download it right away and captivate your audience.
-
 Employment Process KPI Dashboard With Cost Per Hire
The following slide highlights comprehensive employment process dashboard. The metrics covered in the dashboard are total sources of applications, vacancies statistics, recruitment decision and recruitment pipeline. Introducing our Employment Process KPI Dashboard With Cost Per Hire set of slides. The topics discussed in these slides are Recruitment Pipeline, Candidates Statistics, Recruitment Decision, Number of Application by Month. This is an immediately available PowerPoint presentation that can be conveniently customized. Download it and convince your audience.
-
 Affiliate Marketing KPI Dashboard With Click Through Rate
The following slide showcases a comprehensive affiliate marketing KPI dashboard. Information covered in this slide is related to total sales , commission, clicks, sessions, click-through rate, etc. Introducing our Affiliate Marketing KPI Dashboard With Click Through Rate set of slides. The topics discussed in these slides are Commission By Status, Sessions, Clicks And Sales, Highest Transaction, Sessions, Clicks And Sales. This is an immediately available PowerPoint presentation that can be conveniently customized. Download it and convince your audience.
-
 Digital Marketing KPI Dashboard With Conversion And Bounce Rate
The following slide showcases a comprehensive marketing KPI dashboard. Marketers can monitor and optimize the campaign performance after tracking metrics such as total sessions, conversion rate, average time spent on site, bounce rate etc. Presenting our well structured Digital Marketing KPI Dashboard With Conversion And Bounce Rate. The topics discussed in this slide are Today Lead By Program, Lead Breakdown, Today Lead By Program. This is an instantly available PowerPoint presentation that can be edited conveniently. Download it right away and captivate your audience.
-
 Digital Marketing KPI Dashboard Snapshot With Engagement Rate
The following slide showcases a comprehensive KPI dashboard which allows the company to track the digital marketing performance. Total visits, cost per click, engagement rate, total impressions, product sales trend, revenue by various channels are some of the key metrics mentioned in the slide. Introducing our Digital Marketing KPI Dashboard Snapshot With Engagement Rate set of slides. The topics discussed in these slides are Product Sales Trend, Revenue By Channel, Top Website Referral Channels, Website Demographics, Engagement Rate, Impressions Total. This is an immediately available PowerPoint presentation that can be conveniently customized. Download it and convince your audience.
-
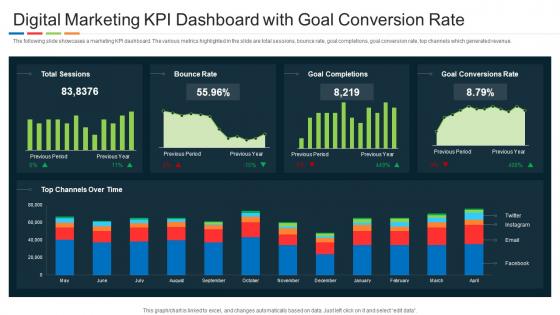 Digital Marketing KPI Dashboard With Goal Conversion Rate
The following slide showcases a marketing KPI dashboard. The various metrics highlighted in the slide are total sessions, bounce rate, goal completions, goal conversion rate, top channels which generated revenue. Presenting our well structured Digital Marketing KPI Dashboard With Goal Conversion Rate. The topics discussed in this slide are Total Sessions, Bounce Rate, Goal Completions, Goal Conversions Rate, Top Channels Over Time. This is an instantly available PowerPoint presentation that can be edited conveniently. Download it right away and captivate your audience.
-
 Email Marketing Kpi Dashboard With Bounce Rate
The following slide showcases KPI dashboard which allows marketers to track the email marketing campaign performance. Information covered in this slide is related to total subscribers, types of email sent, open, clicks, bounces and unsubscribed etc. Introducing our Email Marketing KPI Dashboard With Bounce Rate set of slides. The topics discussed in these slides are Direct Sessions, Organic Sessions, Paid Sessions, Referral Session. This is an immediately available PowerPoint presentation that can be conveniently customized. Download it and convince your audience.
-
 KPI Dashboard Highlighting Results Of SEO Campaign
The following slide showcases marketing KPI dashboard which shows the performance measuring metrics of SEO campaign. The metrics covered in the slide are most viewed pages from SEO, most search engines used, traffic type, top known keywords etc. Presenting our well structured KPI Dashboard Highlighting Results Of SEO Campaign. The topics discussed in this slide are Total Visits From SEO, Main Search Engines Used, Traffic Type, Most Viewed Pages From SEO. This is an instantly available PowerPoint presentation that can be edited conveniently. Download it right away and captivate your audience.
-
 KPI Dashboard Illustrating Results Of Online Marketing Campaign
The following slide showcases KPI dashboard which can be used by marketer to track the results of online marketing campaign. The template provides information about total leads, cost per acquisition, major KPIs, funnel, total followers by age, gender and location etc. Introducing our KPI Dashboard Illustrating Results Of Online Marketing Campaign set of slides. The topics discussed in these slides are Top Performing Post, Funnel, Followers By Location, Followers By Gender, Age. This is an immediately available PowerPoint presentation that can be conveniently customized. Download it and convince your audience.
-
 KPI Dashboard To Analyze Social Media Marketing Campaign Performance
The following slide showcases KPI dashboard which can be used by marketing manager to track social media performance. The metrics covered in the slide are YouTube channel views, LinkedIn clicks, likes and shares, Facebook daily reach etc. Presenting our well structured KPI Dashboard To Analyze Social Media Marketing Campaign Performance. The topics discussed in this slide are Linkedin Shares, Facebook Daily Reach 90 Days, Key Statistics, Instagram Overview. This is an instantly available PowerPoint presentation that can be edited conveniently. Download it right away and captivate your audience.
-
 KPI Dashboard To Track Results Of Ecommerce Marketing Strategy
The following slide showcases a comprehensive marketing KPI dashboard which can be used to track the performance of ecommerce businesses. The metrics mentioned in the slide are total sale by product, average product price, product page visits etc. Introducing our KPI Dashboard To Track Results Of Ecommerce Marketing Strategy set of slides. The topics discussed in these slides are Average Product Price, Visitors Online Now, Sales By Product, Marketing Sales And Expenses Last 30 Days. This is an immediately available PowerPoint presentation that can be conveniently customized. Download it and convince your audience.
-
 Marketing KPI Dashboard With Cost Per Click
The following slide showcases a comprehensive KPI dashboard used to analyze the pay per click advertising performance. The KPIs covered in the slide are total ad cost, total clicks, impressions, cost per conversion, conversion rate, cost per click etc. Presenting our well structured Marketing KPI Dashboard With Cost Per Click. The topics discussed in this slide are Clicks Impression, Click Though Rate, Conversion Rate, Cost Per, Click, Cost Per, Thousand Impressop. This is an instantly available PowerPoint presentation that can be edited conveniently. Download it right away and captivate your audience.
-
 Marketing KPI Dashboard Snapshot With Lead To Conversion
The following slide showcases KPI dashboard snapshot which can be used to monitor the performance of marketing campaign. The key metrics mentioned in the slide are average daily impressions, cost per click, leads to conversion rate, cost per conversion etc. Introducing our Marketing KPI Dashboard With Lead To Conversion set of slides. The topics discussed in these slides are Avg Daily Impressions, Click Through Rate, Cost Per Click, GA Conversion Rate, Leads To Opps Conversion, Cost Per Conversion. This is an immediately available PowerPoint presentation that can be conveniently customized. Download it and convince your audience.
-
 Performance KPI Dashboard Showing Results Of Pay Per Click Marketing
The following slide showcases online marketing KPI dashboard which will assist companies to effectively monitor the performance of pay per click campaign. The metrics highlighted in the slide are total impressions, clicks, conversions, costs, click through rate etc. Presenting our well structured Performance KPI Dashboard Showing Results Of Pay Per Click Marketing. The topics discussed in this slide are Impressions, Clicks, Conversions, Costs, Cost Per Conversion, Conversion Ratio, CPC. This is an instantly available PowerPoint presentation that can be edited conveniently. Download it right away and captivate your audience.
-
 Food Manufacturing Company Kpi Dashboard
This slide shows KPI dashboard for food manufacturing company. It provides information such as revenue, sales, production, export, top production provinces, activity feed, etc. Introducing our Food Manufacturing Company Kpi Dashboard set of slides. The topics discussed in these slides are Food Manufacturing Company Kpi Dashboard. This is an immediately available PowerPoint presentation that can be conveniently customized. Download it and convince your audience.
-
 Kpi Dashboard For Tracking Project Team Performance Playbook For Developers
Following slide illustrates performance monitoring dashboard that can be used by managers to track their developers team efficiency. It also includes details about billable and non-billable hours along with task summary. Deliver an outstanding presentation on the topic using this Kpi Dashboard For Tracking Project Team Performance Playbook For Developers. Dispense information and present a thorough explanation of Dashboard, Performance, Developers using the slides given. This template can be altered and personalized to fit your needs. It is also available for immediate download. So grab it now.
-
 Playbook For Developers Kpi Dashboard To Measure Overall Business Performance
Present the topic in a bit more detail with this Playbook For Developers Kpi Dashboard To Measure Overall Business Performance. Use it as a tool for discussion and navigation on Business, Performance, Dashboard. This template is free to edit as deemed fit for your organization. Therefore download it now.
-
 Ai Transformation Playbook Kpi Dashboard For Tracking Business Performance
Mentioned slide portrays KPI dashboard that can be used by organizations to measure their business performance post AI introduction. KPIS covered here are progress, Before versus After AI Implementation, risks and issues.Present the topic in a bit more detail with this Ai Transformation Playbook Kpi Dashboard For Tracking Business Performance Use it as a tool for discussion and navigation on KPI Dashboard For Tracking Business Performance This template is free to edit as deemed fit for your organization. Therefore download it now.
-
 Kpi Dashboard To Measure Post Merger It Service Integration
Mentioned slide portrays a dashboard for measuring business performance. Performance metrics covered in the slide are average weekly sales revenue, average revenue per unit, customer lifetime value and customer acquisition cost. Deliver an outstanding presentation on the topic using this Kpi Dashboard To Measure Post Merger It Service Integration. Dispense information and present a thorough explanation of KPI Dashboard To Measure Business Performance using the slides given. This template can be altered and personalized to fit your needs. It is also available for immediate download. So grab it now.
-
 Agile Qa Model It Kpi Dashboard To Monitor Software Development Project Status
Mentioned slide shows software development project management dashboard. KPIs covered in the dashboard are status of project budget, overdue tasks, workload and upcoming deadlines. Deliver an outstanding presentation on the topic using this Agile Qa Model It Kpi Dashboard To Monitor Software Development Project Status. Dispense information and present a thorough explanation of Software, Development, Dashboard using the slides given. This template can be altered and personalized to fit your needs. It is also available for immediate download. So grab it now.
-
 Kpi Dashboard To Monitor Software Development Project Status Agile Qa Model It
Following slide displays software development project status monitoring dashboard with KPIS namely overall task status, actual Vs planned budget, pending items. Present the topic in a bit more detail with this Kpi Dashboard To Monitor Software Development Project Status Agile Qa Model It Use it as a tool for discussion and navigation on Software, Development, Dashboard. This template is free to edit as deemed fit for your organization. Therefore download it now.
-
 Dashboard Depicting Hospital KPI With Treatment Costs
This slide covers the hospital KPI dashboard which focuses on average length of stay, nurse patient ratio, admission and 30 day readmission rate with percentage of infection cases acquired by hospital. Introducing our Dashboard Depicting Hospital KPI With Treatment Costs set of slides. The topics discussed in these slides are Length Of Stay, Stays By Payer, Admission AND 30 Day Readmission Rate, Avg Nurse Patient Ratio. This is an immediately available PowerPoint presentation that can be conveniently customized. Download it and convince your audience.
-
 Hospital KPI Dashboard Depicting Total Patients
This slide focuses on hospital KPI dashboard which covers patient satisfaction, operational costs, available staff, average wait time and patients, treatment plan of doctors with divisions such as cardiology, dermatology, gynecology, etc. Presenting our well structured Hospital KPI Dashboard Depicting Total Patients. The topics discussed in this slide are Operational Cost, Total Patients, Available Staff Per Division, Average Wait Times By Division, Overall Patient Satisfaction, Doctors Treatment Plan, Confidence In Treatment. This is an instantly available PowerPoint presentation that can be edited conveniently. Download it right away and captivate your audience.
-
 Hospital KPI Dashboard Snapshot To Measure Patients Trend
This slide covers the hospital KPI dashboard snapshot which includes number of total patients, average treatments expenses and ER waiting time, availability of staff members, patients by division such as surgery, dermatology, oncology, etc. Introducing our Hospital KPI Dashboard To Measure Patients Trend set of slides. The topics discussed in these slides are Outpatients Vs Inpatients Trend, Total Patients, Total Patients Admitted, Available Staff, Patients By Division, Avg Waiting Time By Division. This is an immediately available PowerPoint presentation that can be conveniently customized. Download it and convince your audience.
-
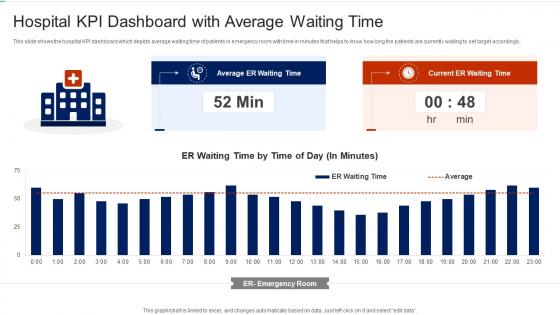 Hospital KPI Dashboard With Average Waiting Time
This slide shows the hospital KPI dashboard which depicts average waiting time of patients in emergency room with time in minutes that helps to know how long the patients are currently waiting to set target accordingly. Presenting our well structured Hospital KPI Dashboard With Average Waiting Time. The topics discussed in this slide are Average ER Waiting Time, Current ER Waiting Time, ER Emergency Room. This is an instantly available PowerPoint presentation that can be edited conveniently. Download it right away and captivate your audience.
-
 Hospital KPI Dashboard With Case Status Of Patients
This slide shows the hospital KPI dashboard that covers claim amount, readmission count, availability of bed, status of patients such as pending, cancelled, open, closed and denied. Introducing our Hospital KPI Dashboard With Case Status Of Patients set of slides. The topics discussed in these slides are Claim Amount By Provider, Member Count By Provider, Claim Count By Provider, Case Status By Patient, Readmission By Diagnosis, Total Claim Count By Diagnosis, Readmission By Gender By Age Group. This is an immediately available PowerPoint presentation that can be conveniently customized. Download it and convince your audience.
-
 Hospital KPI Dashboard With Patient Turnover Rate
This slide focuses on patient dashboard which includes KPIs such as bed occupancy rate, patient satisfaction rate, average cost per patient of various departments, follow up rate, percentage of missed appointments. Presenting our well structured Hospital KPI Dashboard With Patient Turnover Rate. The topics discussed in this slide are Efficiency And Costs, Patient Satisfaction, Drug Cost Per Patient By Department, Bottom Three Med. Equipment Utilization Rate, Percentage Of Missed Appointments, Patient Turnover Rate, Current Patients. This is an instantly available PowerPoint presentation that can be edited conveniently. Download it right away and captivate your audience.
-
 Hospital KPI Dashboard With Patients Feedback
This slide covers the hospital KPI dashboard that shows metrics such as percentage of satisfied patients, admission of patients in different departments like cardiology, dermatology, neurology, etc. with average wait time. Introducing our Hospital KPI Dashboard With Patients Feedback set of slides. The topics discussed in these slides are Average Visit Length By Department, Patient Satisfaction, Patients Feedback By Gender, Patient Feedback Details, Patient Count By Department, Average Wait Time By Department. This is an immediately available PowerPoint presentation that can be conveniently customized. Download it and convince your audience.
-
 Hospital KPI Dashboard With Surgical Stays
This slide shows the hospital KPI and metrics dashboard that helps to evaluate the distribution of costs under Medicare, Medicaid , whether patients have subscribe to private insurance that helps to know about the biggest payers for health facility. Presenting our well structured Hospital KPI Dashboard With Surgical Stays. The topics discussed in this slide are Costs By Payer And Type Of Stays, Stays By Payer, Private Insurance, Medicaid, Medicare. This is an instantly available PowerPoint presentation that can be edited conveniently. Download it right away and captivate your audience.
-
 Hospital KPI Dashboard With Total Revenues
This slide presents the dashboard that shows hospital KPI such as client satisfaction rate, monthly number of patients admission, average time spend with doctor, percentage of follow up consultation using Likert scale. Introducing our Hospital KPI Dashboard With Total Revenues set of slides. The topics discussed in these slides are Likert Scale, Client Satisfaction, Sales. This is an immediately available PowerPoint presentation that can be conveniently customized. Download it and convince your audience.
-
 Hospital Performance Dashboard With KPI
This slide covers the dashboard of hospital KPI which includes monthly stays, quarterly admissions and readmission rate, average treatment costs with acquired infections, patients having private insurance, etc. Presenting our well structured Hospital Performance Dashboard With KPI. The topics discussed in this slide are Avg Length Of Stay, Avg Treatment Costs All Ages, Stays By Payer, Average Treatment Costs, Admissions And Readmission Rate, Hospital Acquired Infections, Length Of Stay. This is an instantly available PowerPoint presentation that can be edited conveniently. Download it right away and captivate your audience.
-
 KPI Compare Dashboard Depicting Revenue With Expenses
Introducing our KPI Compare Dashboard Depicting Revenue With Expenses set of slides. The topics discussed in these slides are Revenue, Expense, Activity Ratio. This is an immediately available PowerPoint presentation that can be conveniently customized. Download it and convince your audience.
-
 KPI Compare Dashboard Depicting Sales Performance
Presenting our well structured KPI Compare Dashboard Depicting Sales Performance. The topics discussed in this slide are Opportunities Won, Product In Revenue, Sales Ratios. This is an instantly available PowerPoint presentation that can be edited conveniently. Download it right away and captivate your audience.
-
 KPI Compare Dashboard Highlighting Cases With Resolutions
Introducing our KPI Compare Dashboard Highlighting Cases With Resolutions set of slides. The topics discussed in these slides are Case Priority, Case Channel, Case Tracking. This is an immediately available PowerPoint presentation that can be conveniently customized. Download it and convince your audience.
-
 KPI Compare Dashboard Highlighting Conversion Rate With Cost Per Mile
Presenting our well structured KPI Compare Dashboard Highlighting Conversion Rate With Cost Per Mile. The topics discussed in this slide are KPI Compare Dashboard Highlighting Conversion Rate With Cost Per Mile. This is an instantly available PowerPoint presentation that can be edited conveniently. Download it right away and captivate your audience.
-
 KPI Compare Dashboard Highlighting Patients By Division
Introducing our KPI Compare Dashboard Highlighting Patients By Division set of slides. The topics discussed in these slides are Outpatients Vs Inpatients, Waiting Time By Division, Treatment Costs. This is an immediately available PowerPoint presentation that can be conveniently customized. Download it and convince your audience.
-
 KPI Compare Dashboard Illustrating Fleet Management
Presenting our well structured KPI Compare Dashboard Illustrating Fleet Management. The topics discussed in this slide are Delivery Status, Loading Time And Weight, Deliveries By Destination. This is an instantly available PowerPoint presentation that can be edited conveniently. Download it right away and captivate your audience.
-
 KPI Compare Dashboard Illustrating Revenue With Acquisition Cost
Introducing our KPI Compare Dashboard Illustrating Revenue With Acquisition Cost set of slides. The topics discussed in these slides are Revenue, Previous Year, Customer. This is an immediately available PowerPoint presentation that can be conveniently customized. Download it and convince your audience.
-
 KPI Compare Dashboard With Turnover And Net Income
Introducing our KPI Compare Dashboard With Turnover And Net Income set of slides. The topics discussed in these slides are Planned Turnover, Net Income, Working Capital. This is an immediately available PowerPoint presentation that can be conveniently customized. Download it and convince your audience.
-
 Suppliers KPI Compare Dashboard Highlighting Spending With Savings
Presenting our well structured Suppliers KPI Compare Dashboard Highlighting Spending With Savings. The topics discussed in this slide are Procurement Cycle, Supplier Classification, Procurement Cycle Time. This is an instantly available PowerPoint presentation that can be edited conveniently. Download it right away and captivate your audience.
-
 Property Management KPI Dashboard Real Estate Marketing Plan Sell Property
This slide portrays property management dashboard with KPIs namely, average days on market, properties for sale, properties for rent, sales vs. target and sales by region. Deliver an outstanding presentation on the topic using this Property Management KPI Dashboard Real Estate Marketing Plan Sell Property. Dispense information and present a thorough explanation of Property Management Kpi Dashboard using the slides given. This template can be altered and personalized to fit your needs. It is also available for immediate download. So grab it now.
-
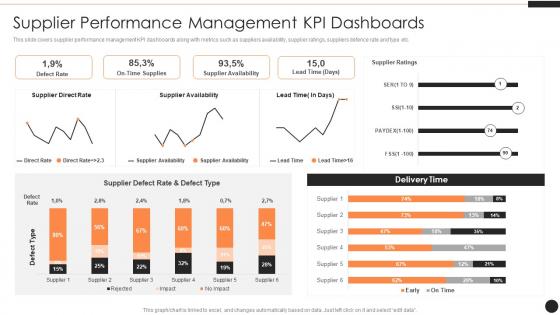 Supplier Performance Management KPI Dashboards Ppt Powerpoint Presentation Layouts
This slide covers supplier performance management KPI dashboards along with metrics such as suppliers availability, supplier ratings, suppliers defence rate and type etc. Present the topic in a bit more detail with this Supplier Performance Management KPI Dashboards Ppt Powerpoint Presentation Layouts. Use it as a tool for discussion and navigation on Supplier Ratings, Supplier Availability, Supplier Direct Rate. This template is free to edit as deemed fit for your organization. Therefore download it now.
-
 KPI Dashboard Showing Web Traffic Results Using Analytics Tool
Mentioned slide outlines a comprehensive KPI dashboard highlighting web page results using XYZ analytics tool. The key performance indicators kpis mentioned in the slide are visits, page views, average visit duration, bounce rate, etc. Presenting our well structured KPI Dashboard Showing Web Traffic Results Using Analytics Tool. The topics discussed in this slide are Page Views, Average Visit Duration, Bounce Rate. This is an instantly available PowerPoint presentation that can be edited conveniently. Download it right away and captivate your audience.
-
 Dashboard KPIS Strategic Approach To Supplier Relationship Management
This slide covers the dashboard that depicts procurement quality metrics such as ordered value, supplier rejection rate, emergency purchase rate, spend under management, supplier quality rating, etc.Present the topic in a bit more detail with this Dashboard KPIS Strategic Approach To Supplier Relationship Management Use it as a tool for discussion and navigation on Return To Vendor Costs, Supplier Quality Rating, Project Analysis This template is free to edit as deemed fit for your organization. Therefore download it now.
-
 KPI Dashboard To Monitor Project Quality Assurance Using Agile Methodology IT
Mentioned slide shows software development project management dashboard. KPIs covered in the dashboard are status of project budget, overdue tasks, workload and upcoming deadlines.Deliver an outstanding presentation on the topic using this KPI Dashboard To Monitor Project Quality Assurance Using Agile Methodology IT Dispense information and present a thorough explanation of Projected Launch Date, Project Budget, Upcoming Deadlines using the slides given. This template can be altered and personalized to fit your needs. It is also available for immediate download. So grab it now.
-
 Project Quality Assurance Using Agile Methodology IT Kpi Dashboard To Monitor Software
Following slide displays software development project status monitoring dashboard with KPIS namely overall task status, actual Vs planned budget, pending items.Present the topic in a bit more detail with this Project Quality Assurance Using Agile Methodology IT Kpi Dashboard To Monitor Software Use it as a tool for discussion and navigation on Dissatisfied Customers, Poor Risk Management, Poor Employee Performance This template is free to edit as deemed fit for your organization. Therefore download it now.
-
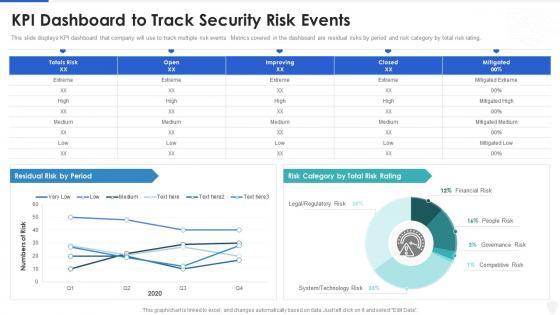 Cybersecurity and digital business risk management kpi dashboard to track security risk events
Present the topic in a bit more detail with this Cybersecurity And Digital Business Risk Management Kpi Dashboard To Track Security Risk Events. Use it as a tool for discussion and navigation on KPI Dashboard To Track Security Risk Events. This template is free to edit as deemed fit for your organization. Therefore download it now.
-
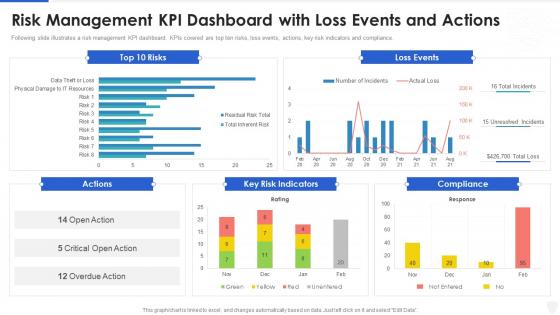 Cybersecurity and digital business risk management risk management kpi dashboard
Following slide illustrates a risk management KPI dashboard. KPIs covered are top ten risks, loss events, actions, key risk indicators and compliance. Deliver an outstanding presentation on the topic using this Cybersecurity And Digital Business Risk Management Risk Management Kpi Dashboard. Dispense information and present a thorough explanation of Risk Management KPI Dashboard With Loss Events And Actions using the slides given. This template can be altered and personalized to fit your needs. It is also available for immediate download. So grab it now.
-
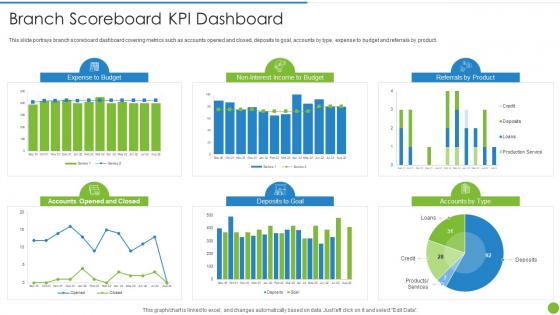 Offering Digital Financial Facility To Existing Customers Branch Scoreboard Kpi Dashboard
This slide portrays branch scoreboard dashboard covering metrics such as accounts opened and closed, deposits to goal, accounts by type, expense to budget and referrals by product. Present the topic in a bit more detail with this Offering Digital Financial Facility To Existing Customers Branch Scoreboard Kpi Dashboard. Use it as a tool for discussion and navigation on Branch Scoreboard Kpi Dashboard. This template is free to edit as deemed fit for your organization. Therefore download it now.
-
 Retail Store Dashboard Snapshot With Sales Kpis
This slide covers a metrics dashboard for tracking retail store sales. It includes KPIs such as sales square foot per location, net profit, revues, shrinkage, customer retention rate, etc. Introducing our Retail Store Dashboard Snapshot With Sales Kpis set of slides. The topics discussed in these slides are Revenues, Net Profit, Customer Retention Rate. This is an immediately available PowerPoint presentation that can be conveniently customized. Download it and convince your audience.
-
 Customer Need Analysis Kpi Dashboard
The following slide highlights the spas to assess customers changing needs and make strategies to improve. It consists of NPS, responses, weekly variations in needs, positive and negative feedback etc. Introducing our Customer Need Analysis Kpi Dashboard set of slides. The topics discussed in these slides are Customer Need Analysis Kpi Dashboard. This is an immediately available PowerPoint presentation that can be conveniently customized. Download it and convince your audience.
-
 Customer Support Kpi Dashboard For Evaluating Sales Bpo Performance
This slide illustrates the customer support KPI dashboard for measuring sales BPO performance and covers elements such as total calls, average answer speed, abandon rate etc. it also provides information about the agents name, overall satisfaction score etc. Introducing our Customer Support Kpi Dashboard For Evaluating Sales Bpo Performance set of slides. The topics discussed in these slides are Performance, Dashboard, Evaluating. This is an immediately available PowerPoint presentation that can be conveniently customized. Download it and convince your audience.
-
 Kpi Dashboard To Get Target Customer Demographic Insights
This slide illustrates a dashboard of target customers through different demographics. It also includes audience age, gender, interests, mobile use and market category. Presenting our well-structured Kpi Dashboard To Get Target Customer Demographic Insights. The topics discussed in this slide are Dashboard, Customer, Demographic. This is an instantly available PowerPoint presentation that can be edited conveniently. Download it right away and captivate your audience.
-
 Talent Assessment KPI Dashboard Snapshot For New Hiring
Following slide outlines talent assessment KPI dashboard snapshot for hiring new employees at workplace. It also provides relevant information about elements like total applicants, shortlisted candidates, hired candidates, cost to hire, applicant details, positions by departments etc. Introducing our Talent Assessment KPI Dashboard For New Hiring set of slides. The topics discussed in these slides are Recruitment Funnel, Applications Received, Sales Executive. This is an immediately available PowerPoint presentation that can be conveniently customized. Download it and convince your audience.
-
 Automating Sales Processes To Improve Revenues Dashboard Depicting Sales KPIs To Track Current
This slide shows the dashboard that depicts sales KPIs to track current status which involves won and lost opportunities, revenues and pipeline by territory, sales by different products, etc. Deliver an outstanding presentation on the topic using this Automating Sales Processes To Improve Revenues Dashboard Depicting Sales KPIs To Track Current. Dispense information and present a thorough explanation of Won Opportunities, Estimated, Revenue By Territory, Total Opportunities, Pipeline By Employee using the slides given. This template can be altered and personalized to fit your needs. It is also available for immediate download. So grab it now.
-
 KPI Dashboard For Asset Tracking With Shipment Status
This slide covers KPI dashboard for asset tracking management. It involves details such as current location of asset, shipment status and tracker event of last 24 hours. Introducing our KPI Dashboard For Asset Tracking With Shipment Status set of slides. The topics discussed in these slides are KPI Dashboard For Asset Tracking With Shipment Status. This is an immediately available PowerPoint presentation that can be conveniently customized. Download it and convince your audience.


