Powerpoint Templates and Google slides for Kpi slide
Save Your Time and attract your audience with our fully editable PPT Templates and Slides.
-
 Supply Chain Kpi Dashboard Powerpoint Presentation Slides
Presenting our supply chain KPI dashboard PowerPoint presentation slides. This PowerPoint design contains fifty-nine slides in it which can be completely customized and edited. It is available for both standard as well as for widescreen formats. This PowerPoint template is compatible with all the presentation software like Microsoft Office, Google Slides, etc. You can download this PPT layout from below.
-
 Hospitality management industry kpi and dashboards powerpoint presentation slides
Presenting our Hospitality Management Industry KPI And Dashboards PowerPoint Presentation Slides. This is a 100% editable and adaptable PPT slide. You can save it in different formats like PDF, JPG, and PNG. It can be edited with different colour, font, font size, and font type of the template as per your requirements. This template supports the standard (4:3) and widescreen (16:9) format. It is also compatible with Google slides.
-
 Measuring Business Performance Using KPIs Powerpoint Presentation Slides
This complete deck covers various topics and highlights important concepts. It has PPT slides which cater to your business needs. This complete deck presentation emphasizes Measuring Business Performance Using KPIs Powerpoint Presentation Slides and has templates with professional background images and relevant content. This deck consists of total of fourty four slides. Our designers have created customizable templates, keeping your convenience in mind. You can edit the color, text and font size with ease. Not just this, you can also add or delete the content if needed. Get access to this fully editable complete presentation by clicking the download button below.
-
 KPIs To Assess Business Performance Powerpoint Presentation Slides
Enthrall your audience with this KPIs To Assess Business Performance Powerpoint Presentation Slides. Increase your presentation threshold by deploying this well-crafted template. It acts as a great communication tool due to its well-researched content. It also contains stylized icons, graphics, visuals etc, which make it an immediate attention-grabber. Comprising fourty three slides, this complete deck is all you need to get noticed. All the slides and their content can be altered to suit your unique business setting. Not only that, other components and graphics can also be modified to add personal touches to this prefabricated set.
-
 Project portfolio management kpi and dashboard powerpoint presentation slides
Presenting our content ready Portfolio Management KPI And Dashboard PowerPoint Presentation Slides. This PowerPoint deck comprises twenty-five fully editable slides. These slides support the standard(4:3) and widescreen(16:9) viewing angles. Alter the color, text, and font size of these layouts. This PPT slideshow is compatible with Google Slides. Convert these templates into various images or document formats like JPEG or PDF.
-
 Hospitality Management KPI And Dashboard Powerpoint Presentation Slides
This complete deck focuses on Hospitality Management KPI And Dashboard Powerpoint Presentation Slides and consists of professionally designed templates with suitable graphics and appropriate content. Our designers have created customizable templates for your convenience. You can make the required changes in the templates like color, text and font size. Other than this, content can be added or deleted from the slide as per the requirement. The templates are compatible with Google Slides so it can be easily accessible. It can be saved into various file formats like PDF, JPG. And PNG. It is available in both standard and widescreen formats.
-
 Financial Assets Management Kpi And Dashboard Powerpoint Presentation Slides
This complete deck focuses on Financial Assets Management Kpi And Dashboard Powerpoint Presentation Slides and consists of professionally designed templates with suitable graphics and appropriate content. This deck has a total of twenty-five slides. Our designers have created customizable templates for your convenience. You can make the required changes in the templates like color, text and font size. The presentation is fully supported by Google Slides. It can be easily converted into JPG or PDF format. When you download this presentation by clicking the download button, you get the presentation in both standard and widescreen formats.
-
 Portfolio investment kpis and dashboard powerpoint presentation slides
This complete deck is oriented to make sure you do not lag in your presentations. Our creatively crafted slides come with apt research and planning. This exclusive deck with twenty-five slides is here to help you to strategize, plan, analyze, or segment the topic with clear understanding and apprehension. This slide is 100% editable in PowerPoint. You can alter the font type, size, diagram color, background color, etc. The presentation can be saved in multiple image formats such as JPEG, PNG, and PDF This presentation deck can be used by all professionals, managers, individuals, internal-external teams involved in any company organization.
-
 Portfolio management kpi and dashboard powerpoint presentation slides
Presenting our content ready Portfolio Management KPI And Dashboard PowerPoint Presentation Slides. This PowerPoint deck comprises twenty-five fully editable slides. These slides support the standard(4:3) and widescreen(16:9) viewing angles. Alter the color, text, and font size of these layouts. This PPT slideshow is compatible with Google Slides. Convert these templates into various images or document formats like JPEG or PDF.
-
 Finance Portfolio Management KPIs And Dashboard Powerpoint Presentation Slides
Presenting our Finance Portfolio Management KPIs And Dashboard PowerPoint Presentation Slides. This is a 100% editable and adaptable PPT slide. You can save it in different formats like PDF, JPG, and PNG. It can be edited with different color, font, font size, and font type of the template as per your requirements. This template supports the standard (4:3) and widescreen (16:9) format. It is also compatible with Google slides.
-
 Customer loyalty kpi powerpoint presentation slides
Presenting customer loyalty KPI PowerPoint presentation slides. Consisting of total of 19 PPT slides. This customer retention scored PPT complete deck comprises of professional templates with appropriate visuals. Each template is well crafted and designed by our PowerPoint experts. Our designers have included all the necessary PowerPoint layouts in this deck. From icons to graphs, this PPT deck has it all. The best part is that these templates are easily customizable. Just click the download button shown below. Edit the color, text, font size, add or delete the content as per the requirement. Download this deck now and learn about your customer’s buying behavior.
-
 E mail safeguard industry report kpi dashboard for e mail security ppt slides guidelines
This graph or chart is linked to excel, and changes automatically based on data. Just left click on it and select edit data. Present the topic in a bit more detail with this E Mail Safeguard Industry Report KPI Dashboard For E Mail Security Ppt Slides Guidelines. Use it as a tool for discussion and navigation on Average Time, Restore Backup, Obsolete User Accounts, Physical Backup, Archive Media, Fully Encrypted. This template is free to edit as deemed fit for your organization. Therefore download it now.
-
 Data Governance KPIS In Powerpoint And Google Slides Cpb
Presenting Data Governance KPIS In Powerpoint And Google Slides Cpb slide which is completely adaptable. The graphics in this PowerPoint slide showcase six stages that will help you succinctly convey the information. In addition, you can alternate the color, font size, font type, and shapes of this PPT layout according to your content. This PPT presentation can be accessed with Google Slides and is available in both standard screen and widescreen aspect ratios. It is also a useful set to elucidate topics like Data Governance KPIS. This well structured design can be downloaded in different formats like PDF, JPG, and PNG. So, without any delay, click on the download button now.
-
 KPI Vendor Management In Powerpoint And Google Slides Cpb
Presenting KPI Vendor Management In Powerpoint And Google Slides Cpb slide which is completely adaptable. The graphics in this PowerPoint slide showcase five stages that will help you succinctly convey the information. In addition, you can alternate the color, font size, font type, and shapes of this PPT layout according to your content. This PPT presentation can be accessed with Google Slides and is available in both standard screen and widescreen aspect ratios. It is also a useful set to elucidate topics like KPI Vendor Management. This well structured design can be downloaded in different formats like PDF, JPG, and PNG. So, without any delay, click on the download button now.
-
 KPIS Product Management In Powerpoint And Google Slides Cpb
Presenting KPIS Product Management In Powerpoint And Google Slides Cpb slide which is completely adaptable. The graphics in this PowerPoint slide showcase six stages that will help you succinctly convey the information. In addition, you can alternate the color, font size, font type, and shapes of this PPT layout according to your content. This PPT presentation can be accessed with Google Slides and is available in both standard screen and widescreen aspect ratios. It is also a useful set to elucidate topics like KPIS Product Management. This well structured design can be downloaded in different formats like PDF, JPG, and PNG. So, without any delay, click on the download button now.
-
 Five UX KPI In Powerpoint And Google Slides Cpb
Presenting Five UX KPI In Powerpoint And Google Slides Cpb slide which is completely adaptable. The graphics in this PowerPoint slide showcase five stages that will help you succinctly convey the information. In addition, you can alternate the color, font size, font type, and shapes of this PPT layout according to your content. This PPT presentation can be accessed with Google Slides and is available in both standard screen and widescreen aspect ratios. It is also a useful set to elucidate topics like Five UX KPI. This well structured design can be downloaded in different formats like PDF, JPG, and PNG. So, without any delay, click on the download button now.
-
 Security KPI Dashboard In Powerpoint And Google Slides Cpb
Presenting Security KPI Dashboard In Powerpoint And Google Slides Cpb slide which is completely adaptable. The graphics in this PowerPoint slide showcase four stages that will help you succinctly convey the information. In addition, you can alternate the color, font size, font type, and shapes of this PPT layout according to your content. This PPT presentation can be accessed with Google Slides and is available in both standard screen and widescreen aspect ratios. It is also a useful set to elucidate topics like Security KPI Dashboard. This well structured design can be downloaded in different formats like PDF, JPG, and PNG. So, without any delay, click on the download button now.
-
 Telecommunications KPI Examples In Powerpoint And Google Slides Cpb
Presenting our Telecommunications KPI Examples In Powerpoint And Google Slides Cpb PowerPoint template design. This PowerPoint slide showcases four stages. It is useful to share insightful information on Telecommunications KPI Examples This PPT slide can be easily accessed in standard screen and widescreen aspect ratios. It is also available in various formats like PDF, PNG, and JPG. Not only this, the PowerPoint slideshow is completely editable and you can effortlessly modify the font size, font type, and shapes according to your wish. Our PPT layout is compatible with Google Slides as well, so download and edit it as per your knowledge.
-
 KPI Examples Information Technology In Powerpoint And Google Slides Cpb
Presenting our KPI Examples Information Technology In Powerpoint And Google Slides Cpb PowerPoint template design. This PowerPoint slide showcases five stages. It is useful to share insightful information on KPI Examples Information Technology This PPT slide can be easily accessed in standard screen and widescreen aspect ratios. It is also available in various formats like PDF, PNG, and JPG. Not only this, the PowerPoint slideshow is completely editable and you can effortlessly modify the font size, font type, and shapes according to your wish. Our PPT layout is compatible with Google Slides as well, so download and edit it as per your knowledge.
-
 Unique leadership development kpi sample powerpoint slides
Presenting unique leadership development kpi sample powerpoint slides. This is a leadership development kpi sample powerpoint slides. This is a five stage process. The stages in this process are vision strategy and culture, finance and operation, human capital alignment, service execution, client relationships.
-
 Download kpis digital marketing analytics measurement strategy diagram ppt slides
Presenting download kpis digital marketing analytics measurement strategy diagram ppt slides. This is a kpis digital marketing analytics measurement strategy diagram ppt slides. This is a six stage process. The stages in this process are increase customer conversion, lead generation, website goal quick and easy purchases, kpl conversion rate purchases, segments revenue per purchase time on site geography, website goal get people to read about the services offered and sign up, kpl e mail sign-up conversion rate target 15 percentage, segments time on site geography 1 2 3 visit tiers.
-
 Custom kpi for operations powerpoint slide examples
Presenting custom kpi for operations powerpoint slide examples. This is a kpi for operations powerpoint slide examples. This is a five stage process. The stages in this process are flexibility, cycle time reduction, labor productivity, capacity improvement, cost reduction.
-
 Pptx online kpi dashboard ppt powerpoint slide deck samples
Presenting pptx online kpi dashboard ppt powerpoint slide deck samples. This is a online kpi dashboard ppt powerpoint slide deck samples. This is a four stage process. The stages in this process are brand awareness, focus on growing audience, reach growth, lead generation, focus on conversations to valuable actions, engagement growth, customer support, ensure rapid, approved response, ensure rapid, approved response, activity engagement, community development, foster community that initiates and sustains and conversations, engagement activity, strangers, prospects, customers, fans.
-
 Download for lean content marketing kpis powerpoint slide themes
Presenting download for lean content marketing kpis powerpoint slide themes. This is a for lean content marketing kpis powerpoint slide themes. This is a four stage process. The stages in this proces are volume, amplification, traffic, leads.
-
 Sales management framework with kpi powerpoint slide ideas
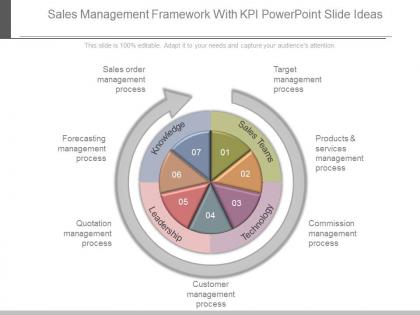
Presenting sales management framework with kpi powerpoint slide ideas. This is a sales management framework with kpi powerpoint slide ideas. This is a seven stage process. The stages in this process are sales order management process, forecasting management process, quotation management process, customer management process, commission management process, products and services management process, target management process, knowledge, sales teams, technology, leadership.
-
 Business kpi dashboard slide powerpoint slides
Presenting business kpi dashboard slide powerpoint slides. This is a business kpi dashboard slide powerpoint slides. This is a four stage process. The stages in this process are kpi tracking, activity planning, targeting, data management.
-
 Kpis and implementation powerpoint slides rules
Presenting kpis and implementation powerpoint slides rules. This is a kpis and implementation powerpoint slides rules. This is a five stage process. The stages in this process are industry benchmarks, baseline measurement, metric identification, scope and governance, define targets.
-
 Risk alignment using kpi for business diagram ppt slides
Presenting risk alignment using kpi for business diagram ppt slides. This is a risk alignment using kpi for business diagram ppt slides. This is a eight stage process. The stages in this process are objectives, threats, opportunities, systemic risk, metrics, risk, resource, strategy.
-
 Employees achievement kpis diagram slides
Presenting employees achievement kpis diagram slides. This is a employees achievement kpis diagram slides. This is a four stage process. The stages in this process are hr professionals, key talent, people managers, business leaders .
-
 Risk identification against kpi ppt powerpoint slide template
Presenting risk identification against kpi ppt powerpoint slide template. This is a risk identification against kpi ppt powerpoint slide template. This is a three stage process. The stages in this process are objectives, threats, opportunities, systemic risks.
-
 Business kpi dashboard layout ppt slide examples
Presenting business kpi dashboard layout ppt slide examples. This is a business kpi dashboard layout ppt slide examples. This is a six stage process. The stages in this process are economic value, brand equity, brand image, marketing activity, overall satisfaction, satisfaction with value for money.
-
 Team kpi tracker powerpoint slide templates
Presenting team kpi tracker powerpoint slide templates. This is a team kpi tracker powerpoint slide templates. This is a four stage process. The stages in this process are successful, no answer, call busy, unavailable, demo booked.
-
 Sales rep kpi tracker ppt slides
Presenting sales rep kpi tracker ppt slides. This is a sales rep kpi tracker ppt slides. This is a four stage process. The stages in this process are mtotal calls attempted, call busy, unavailable, not interested.
-
 Sales rep kpi tracker powerpoint slide background designs
Presenting sales rep kpi tracker powerpoint slide background designs. This is a sales rep kpi tracker powerpoint slide background designs. This is three stage process. The stages in this process are successful, no answer, call busy, disconnected, wrong number, unavailable, not interested, demo booked.
-
 Media kpi development powerpoint slide templates
Presenting media kpi development powerpoint slide templates. This is a media kpi development powerpoint slide templates. This is a four stage process. The stages in this process are buyers journey, awareness, consideration, decision, visitors, leads, marketing qualified leads, sales and marketing process, sales qualified leads.
-
 Channel kpis powerpoint slide background picture
Presenting channel kpis powerpoint slide background picture. This is a channel kpis powerpoint slide background picture. This is a four stage process. The stages in this process are inspiration, evaluation, purchase, after sales, stationary, online, mobile, catalog magazine, call center, instore displays.
-
 Media kpi development powerpoint slide backgrounds
Presenting media kpi development powerpoint slide backgrounds. Presenting media kpi development powerpoint slide backgrounds. This is a media kpi development powerpoint slide backgrounds. This is a four stage process. The stages in this process are kpis, sales and marketing process, buyers journey, visitors, leads, marketing qualified leads, sales qualified leads, awareness, consideration, decision.
-
 Media kpis performance evaluation powerpoint slide backgrounds
Presenting media kpis performance evaluation powerpoint slide backgrounds. Presenting media kpis performance evaluation powerpoint slide backgrounds. This is a media kpis performance evaluation powerpoint slide backgrounds. This is a three stage process. The stages in this process are traffic, engagement, conversion, website visitors, high value actions, video views, purchases, installs, sign ups.
-
 Media kpi development powerpoint slides
Presenting media kpi development powerpoint slides. This is a media kpi development powerpoint slides. This is a four stage process. The stages in this process are kpis, sales and marketing process, buyer journey, awareness, consideration, decision, sales qualified leads, marketing qualified leads, leads, visitors.
-
 Media kpi development ppt examples slides
Presenting media kpi development ppt examples slides. This is a media kpi development ppt examples slides. This is a four stage process. The stages in this process are sales and marketing process, buyer journey, awareness, consideration, decision, visitors, leads, marketing qualified leads, sales qualified leads.
-
 Media kpis performance evaluation powerpoint slide
Presenting media kpis performance evaluation powerpoint slide. This is a media kpis performance evaluation powerpoint slide. This is a three stage process. The stages in this process are traffic, website visitors, engagement, conversion, website visitors, high value actions, video views, installs, purchases, sign ups.
-
 Marketing company kpi evaluation scorecard with current assets ppt slides model
Deliver an outstanding presentation on the topic using this Marketing Company KPI Evaluation Scorecard With Current Assets Ppt Slides Model. Dispense information and present a thorough explanation of Current Assets, Current Liabilities, Total Assets, Total liabilities using the slides given. This template can be altered and personalized to fit your needs. It is also available for immediate download. So grab it now.
-
 Kpis For Measuring Recruitment Marketing Response Cont Inbound Recruiting Ppt Slides Themes
This template covers the recruitment marketing detailed highlights for search engine optimization and email marketing, SMM including twitter, Facebook, Instagram, LinkedIn etc. Present the topic in a bit more detail with this Kpis For Measuring Recruitment Marketing Response Cont Inbound Recruiting Ppt Slides Themes. Use it as a tool for discussion and navigation on Measuring, Recruitment, Marketing. This template is free to edit as deemed fit for your organization. Therefore download it now.
-
 Profit Margin Dashboard Kpis To Assess Business Performance Ppt Slides Deck
Following slide illustrates profit margin dashboard with a 12 months format. It also includes gross profit margin, operating profit margin and net profit margin. Deliver an outstanding presentation on the topic using this Profit Margin Dashboard Kpis To Assess Business Performance Ppt Slides Deck. Dispense information and present a thorough explanation of Gross Profit Margin, Operating Profit Margin, Net Profit Margin using the slides given. This template can be altered and personalized to fit your needs. It is also available for immediate download. So grab it now.
-
 KPIS For Service Delivery Sales And Marketing Optimize Service Delivery Ppt Slides
This slide describes how sales and marketing will be boost by incorporating AI which will further lead to business growth and profits. Present the topic in a bit more detail with this KPIS For Service Delivery Sales And Marketing Optimize Service Delivery Ppt Slides. Use it as a tool for discussion and navigation on Customer Segment, Average Of Elasticity, Category Hierarchy. This template is free to edit as deemed fit for your organization. Therefore download it now.
-
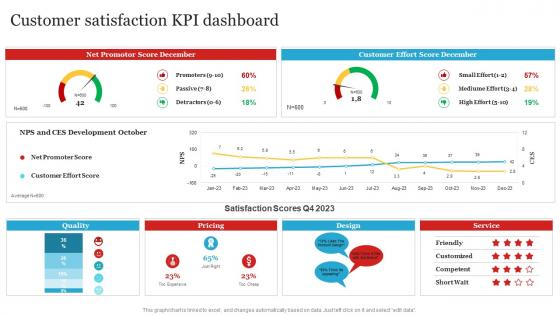 Complete Personal Branding Guide Customer Satisfaction KPI Dashboard Ppt Slides Templates
Deliver an outstanding presentation on the topic using this Complete Personal Branding Guide Customer Satisfaction KPI Dashboard Ppt Slides Templates. Dispense information and present a thorough explanation of Customer Effort Score, Net Promotor Score, Pricing using the slides given. This template can be altered and personalized to fit your needs. It is also available for immediate download. So grab it now.
-
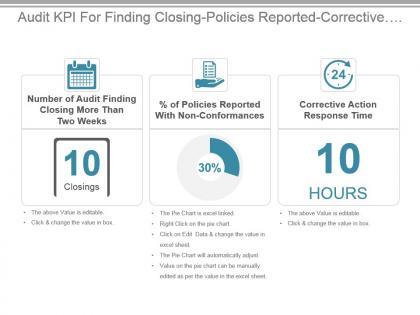 Audit kpi for finding closing policies reported corrective action time ppt slide
Presenting audit kpi for finding closing policies reported corrective action time ppt slide. This presentation slide shows three Key Performance Indicators or KPIs in a Dashboard style design. The first KPI that can be shown is Number of Audit Finding Closing More Than Two Weeks. The second KPI is percentage of Policies Reported With Non Conformances and the third is Corrective Action Response Time. These KPI Powerpoint graphics are all data driven,and the shape automatically adjusts according to your data. Just right click on the KPI graphic,enter the right value and the shape will adjust automatically. Make a visual impact with our KPI slides.
-
 Governance kpi for percentage of strategic objectives achieved powerpoint slide
Presenting governance kpi for percentage of strategic objectives achieved powerpoint slide. This presentation slide shows one Key Performance Indicators or KPIs in a Dashboard style design. The first KPI that can be shown is Percentage of Strategic Objectives Achieved. These KPI Powerpoint graphics are all data driven,and the shape automatically adjusts according to your data. Just right click on the KPI graphic,enter the right value and the shape will adjust automatically. Make a visual impact with our KPI slides.
-
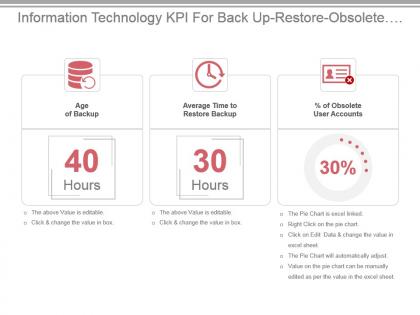 Information technology kpi for back up restore obsolete user accounts presentation slide
Presenting information technology kpi for back up restore obsolete user accounts presentation slide. This presentation slide shows three Key Performance Indicators or KPIs in a Dashboard style design. The first KPI that can be shown is Age of Backup. The second KPI is Average Time to Restore Backup and the third is percentage of Obsolete User Accounts. These KPI Powerpoint graphics are all data driven,and the shape automatically adjusts according to your data. Just right click on the KPI graphic,enter the right value and the shape will adjust automatically. Make a visual impact with our KPI slides.
-
 Kpi for agreed proposals correctly handled neglected compliance issues ppt slide
Presenting kpi for agreed proposals correctly handled neglected compliance issues ppt slide. This presentation slide shows three Key Performance Indicators or KPIs in a Dashboard style design. The first KPI that can be shown is Age of Agreed Upon Recommendations. The second KPI is percentage of Compliance Issues Handled First Time Correctly and the third is percentage of Neglected Compliance Issues. These KPI Powerpoint graphics are all data driven,and the shape automatically adjusts according to your data. Just right click on the KPI graphic,enter the right value and the shape will adjust automatically. Make a visual impact with our KPI slides.
-
 Kpi for average backup time security controls risks identified powerpoint slide
Presenting kpi for average backup time security controls risks identified powerpoint slide. This presentation slide shows three Key Performance Indicators or KPIs in a Dashboard style design. The first KPI that can be shown is Average Time Between Tests of Backup. The second KPI is Proportion of Information Security Risks for Which Satisfactory Controls Have Been Fully Implemented and the third is Relative Proportions of Risks Identified. These KPI Powerpoint graphics are all data driven,and the shape automatically adjusts according to your data. Just right click on the KPI graphic,enter the right value and the shape will adjust automatically. Make a visual impact with our KPI slides.
-
 Kpi for change requests received qar entitlement removal requests presentation slide
Presenting kpi for change requests received qar entitlement removal requests presentation slide. This presentation slide shows two Key Performance Indicators or KPIs in a Dashboard style design. The first KPI that can be shown is of Change Requests Reviewed. The second KPI is QAR Entitlement Removal Requests. These KPI Powerpoint graphics are all data driven,and the shape automatically adjusts according to your data. Just right click on the KPI graphic,enter the right value and the shape will adjust automatically. Make a visual impact with our KPI slides.
-
 Kpi for compliance loe reviewed accounts change request issues resolved presentation slide
Presenting kpi for compliance loe reviewed accounts change request issues resolved presentation slide. This presentation slide shows three Key Performance Indicators or KPIs in a Dashboard style design. The first KPI that can be shown is QAR IT Compliance LOE Quarterly. The second KPI is of Terminated Employee User Accounts Reviewed for Compliance and the third is of Non compliant Change Request Issues Resolved. These KPI Powerpoint graphics are all data driven,and the shape automatically adjusts according to your data. Just right click on the KPI graphic,enter the right value and the shape will adjust automatically. Make a visual impact with our KPI slides.
-
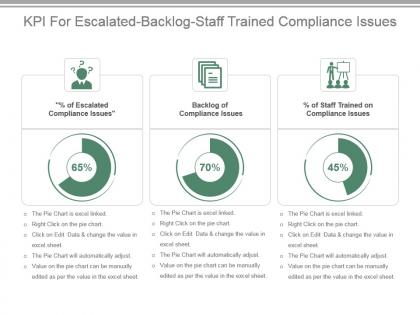 Kpi for escalated backlog staff trained compliance issues presentation slide
Presenting kpi for escalated backlog staff trained compliance issues presentation slide. This presentation slide shows three Key Performance Indicators or KPIs in a Dashboard style design. The first KPI that can be shown is percentage of Escalated Compliance Issues. The second KPI is Backlog of Compliance Issues and the third is percentage of Staff Trained on Compliance Issues. These KPI Powerpoint graphics are all data driven,and the shape automatically adjusts according to your data. Just right click on the KPI graphic,enter the right value and the shape will adjust automatically. Make a visual impact with our KPI slides.
-
 Kpi for flaws identified by external qualification and certification reports ppt slide
Presenting kpi for flaws identified by external qualification and certification reports ppt slide. This presentation slide shows one Key Performance Indicators or KPIs in a Dashboard style design. The first KPI that can be shown is Number of Weaknesses Identified by External Qualification and Certification Reports. These KPI Powerpoint graphics are all data driven,and the shape automatically adjusts according to your data. Just right click on the KPI graphic,enter the right value and the shape will adjust automatically. Make a visual impact with our KPI slides.
-
 Kpi for legal staff per size per billion of revenue powerpoint slide
Presenting kpi for legal staff per size per billion of revenue powerpoint slide. This presentation slide shows two Key Performance Indicators or KPIs in a Dashboard style design. The first KPI that can be shown is Legal Staff Per Size of Revenue. The second KPI is Legal Staff Per Billion of Revenue. These KPI Powerpoint graphics are all data driven,and the shape automatically adjusts according to your data. Just right click on the KPI graphic,enter the right value and the shape will adjust automatically. Make a visual impact with our KPI slides.
-
 Kpi for overdue average open days handling cost compliance issues presentation slide
Presenting kpi for overdue average open days handling cost compliance issues presentation slide. This presentation slide shows three Key Performance Indicators or KPIs in a Dashboard style design. The first KPI that can be shown is percentage of Overdue Compliance Issues. The second KPI is Average Number of Days Open of Compliance Issues and the third is Average Handling Cost Per Compliance Issue. These KPI Powerpoint graphics are all data driven,and the shape automatically adjusts according to your data. Just right click on the KPI graphic,enter the right value and the shape will adjust automatically. Make a visual impact with our KPI slides.
-
 Kpi for percentage of protected systems back up operations ppt slide
Presenting kpi for percentage of protected systems back up operations ppt slide. This presentation slide shows three Key Performance Indicators or KPIs in a Dashboard style design. The first KPI that can be shown is percentage of Systems Covered by Antivirus Antispyware Software. The second KPI is percentage of Systems With Latest Antivirus Antispyware Signatures and the third is percentage of Backup Operations That are Successful. These KPI Powerpoint graphics are all data driven,and the shape automatically adjusts according to your data. Just right click on the KPI graphic,enter the right value and the shape will adjust automatically. Make a visual impact with our KPI slides.
-
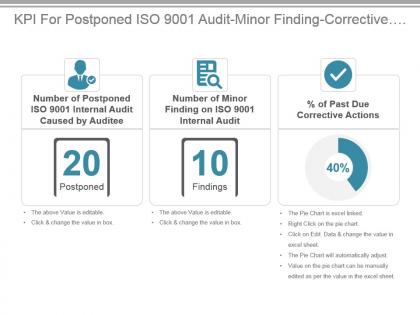 Kpi for postponed iso 9001 audit minor finding corrective actions presentation slide
Presenting kpi for postponed iso 9001 audit minor finding corrective actions presentation slide. This presentation slide shows three Key Performance Indicators or KPIs in a Dashboard style design. The first KPI that can be shown is Number of Postponed ISO 9001 Internal Audit Caused by Auditee. The second KPI is Number of Minor Finding on ISO 9001 Internal Audit and the third is percentage of Past Due Corrective Actions. These KPI Powerpoint graphics are all data driven,and the shape automatically adjusts according to your data. Just right click on the KPI graphic,enter the right value and the shape will adjust automatically. Make a visual impact with our KPI slides.
-
 Kpi for process total coverage postponed iso 9001 internal audit ppt slide
Presenting kpi for process total coverage postponed iso 9001 internal audit ppt slide. This presentation slide shows three Key Performance Indicators or KPIs in a Dashboard style design. The first KPI that can be shown is Effectiveness of Process Audits. The second KPI is percentage Coverage of Total Audit Universe and the third is Number of Postponed ISO 9001 Internal Audit Caused by Auditor. These KPI Powerpoint graphics are all data driven,and the shape automatically adjusts according to your data. Just right click on the KPI graphic,enter the right value and the shape will adjust automatically. Make a visual impact with our KPI slides.


