Powerpoint Templates and Google slides for KPI Reporting And Analysis
Save Your Time and attract your audience with our fully editable PPT Templates and Slides.
-
 Procurement Analysis Report And Analysis Through KPIS And Waterfall Model Ppt Icons
This slide covers reporting and spend analysis waterfall model. It also includes performance comparison based on time, such as last year, last quarte etc. Deliver an outstanding presentation on the topic using this Procurement Analysis Report And Analysis Through KPIS And Waterfall Model Ppt Icons. Dispense information and present a thorough explanation of Report And Analysis Through KPIS And Waterfall Model using the slides given. This template can be altered and personalized to fit your needs. It is also available for immediate download. So grab it now.
-
 Report And Analysis Through KPIs And Waterfall Model Purchasing Analytics Tools And Techniques
This slide covers reporting and spend analysis waterfall model. It also includes performance comparison based on time, such as last year, last quarte etc. Present the topic in a bit more detail with this Report And Analysis Through KPIs And Waterfall Model Purchasing Analytics Tools And Techniques. Use it as a tool for discussion and navigation on Payment Term, Contracts Expiring, Currency Transactions. This template is free to edit as deemed fit for your organization. Therefore download it now.
-
 Report And Analysis Through KPIs And Waterfall Model Procurement Spend Analysis
This slide covers reporting and spend analysis waterfall model. It also includes performance comparison based on time, such as last year, last quarte etc. Deliver an outstanding presentation on the topic using this Report And Analysis Through KPIs And Waterfall Model Procurement Spend Analysis. Dispense information and present a thorough explanation of Report And Analysis, KPIs And Waterfall Model using the slides given. This template can be altered and personalized to fit your needs. It is also available for immediate download. So grab it now.
-
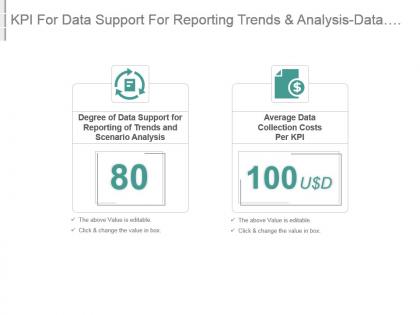
 Kpi for data support for reporting trends and analysis data collection costs powerpoint slide
Presenting kpi for data support for reporting trends and analysis data collection costs powerpoint slide. This presentation slide shows two Key Performance Indicators or KPIs in a Dashboard style design. The first KPI that can be shown is Degree of Data Support for Reporting of Trends and Scenario Analysis. The second KPI is Average Data Collection Costs Per KPI. These KPI Powerpoint graphics are all data driven, and the shape automatically adjusts according to your data. Just right click on the KPI graphic, enter the right value and the shape will adjust automatically. Make a visual impact with our KPI slides.


