Powerpoint Templates and Google slides for Kpi order
Save Your Time and attract your audience with our fully editable PPT Templates and Slides.
-
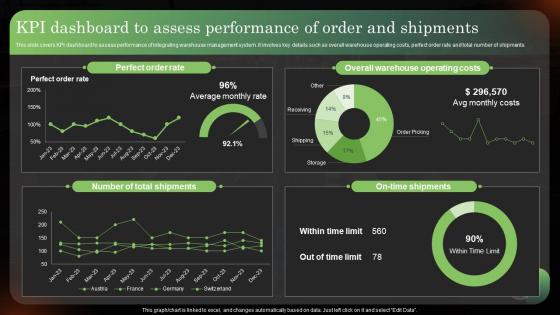 KPI Dashboard To Assess Performance Of Order And Logistics Strategy To Improve Supply Chain
This slide covers KPI dashboard to assess performance of integrating warehouse management system. It involves key details such as overall warehouse operating costs, perfect order rate and total number of shipments. Deliver an outstanding presentation on the topic using this KPI Dashboard To Assess Performance Of Order And Logistics Strategy To Improve Supply Chain. Dispense information and present a thorough explanation of Performance, Operating, Perfect using the slides given. This template can be altered and personalized to fit your needs. It is also available for immediate download. So grab it now.
-
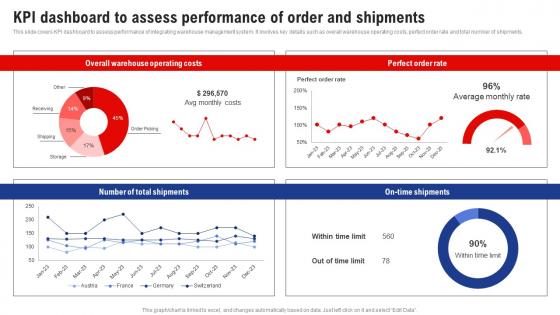 Kpi Dashboard To Assess Performance Of Order And Shipments Logistics And Supply Chain Management
This slide covers KPI dashboard to assess performance of integrating warehouse management system. It involves key details such as overall warehouse operating costs, perfect order rate and total number of shipments. Present the topic in a bit more detail with this Kpi Dashboard To Assess Performance Of Order And Shipments Logistics And Supply Chain Management. Use it as a tool for discussion and navigation on Dashboard, Performance, Shipments. This template is free to edit as deemed fit for your organization. Therefore download it now.
-
 Positive Impact Of Improved Purchase Order KPIS Supplier Negotiation Strategy SS V
This slide provides an overview of the positive impact of procurement strategy on purchase order cycle time and accuracy. The cycle time decreased and accuracy increased by adopting software, vendor development strategy, employee training and prioritizing vendors. Deliver an outstanding presentation on the topic using this Positive Impact Of Improved Purchase Order KPIS Supplier Negotiation Strategy SS V. Dispense information and present a thorough explanation of Purchase Order Cycle Time, Purchase Order Accuracy, Positive Impact using the slides given. This template can be altered and personalized to fit your needs. It is also available for immediate download. So grab it now.
-
 Positive Impact Of Improved Purchase Order KPIs Strategic Sourcing In Supply Chain Strategy SS V
This slide provides an overview of the positive impact of procurement strategy on purchase order cycle time and accuracy. The cycle time decreased and accuracy increased by adopting software, vendor development strategy, employee training and prioritizing vendors. Deliver an outstanding presentation on the topic using this Positive Impact Of Improved Purchase Order KPIs Strategic Sourcing In Supply Chain Strategy SS V. Dispense information and present a thorough explanation of Positive, Improved, Purchase using the slides given. This template can be altered and personalized to fit your needs. It is also available for immediate download. So grab it now.
-
 Positive Impact Of Improved Purchase Order Kpis Steps To Create Effective Strategy SS V
This slide provides an overview of the positive impact of procurement strategy on purchase order cycle time and accuracy. The cycle time decreased and accuracy increased by adopting software, vendor development strategy, employee training and prioritizing vendors. Deliver an outstanding presentation on the topic using this Positive Impact Of Improved Purchase Order Kpis Steps To Create Effective Strategy SS V. Dispense information and present a thorough explanation of Purchase Order Cycle Time, Purchase Order Accuracy using the slides given. This template can be altered and personalized to fit your needs. It is also available for immediate download. So grab it now.
-
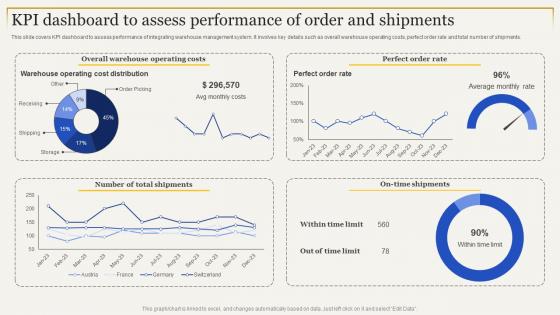 Kpi Dashboard To Assess Performance Of Order Strategies To Enhance Supply Chain Management
This slide covers KPI dashboard to assess performance of integrating warehouse management system. It involves key details such as overall warehouse operating costs, perfect order rate and total number of shipments. Deliver an outstanding presentation on the topic using this Kpi Dashboard To Assess Performance Of Order Strategies To Enhance Supply Chain Management. Dispense information and present a thorough explanation of Dashboard, Performance, Shipments using the slides given. This template can be altered and personalized to fit your needs. It is also available for immediate download. So grab it now.
-
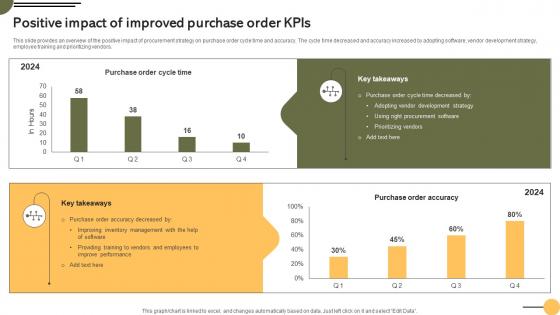 Positive Purchase Order Kpis Achieving Business Goals Procurement Strategies Strategy SS V
This slide provides an overview of the positive impact of procurement strategy on purchase order cycle time and accuracy. The cycle time decreased and accuracy increased by adopting software, vendor development strategy, employee training and prioritizing vendors. Deliver an outstanding presentation on the topic using this Positive Purchase Order Kpis Achieving Business Goals Procurement Strategies Strategy SS V. Dispense information and present a thorough explanation of Development, Strategy, Procurement Software using the slides given. This template can be altered and personalized to fit your needs. It is also available for immediate download. So grab it now.
-
 Cost Reduction Strategies Positive Impact Of Improved Purchase Order KPIS Strategy SS V
This slide provides an overview of the positive impact of procurement strategy on purchase order cycle time and accuracy. The cycle time decreased and accuracy increased by adopting software, vendor development strategy, employee training and prioritizing vendors. Deliver an outstanding presentation on the topic using this Cost Reduction Strategies Positive Impact Of Improved Purchase Order KPIS Strategy SS V. Dispense information and present a thorough explanation of Purchase Order Accuracy, Positive Impact, Improved Purchase using the slides given. This template can be altered and personalized to fit your needs. It is also available for immediate download. So grab it now.
-
 Procurement Negotiation Strategies Positive Impact Of Improved Purchase Order Kpis Strategy SS V
This slide provides an overview of the positive impact of procurement strategy on purchase order cycle time and accuracy. The cycle time decreased and accuracy increased by adopting software, vendor development strategy, employee training and prioritizing vendors. Deliver an outstanding presentation on the topic using this Procurement Negotiation Strategies Positive Impact Of Improved Purchase Order Kpis Strategy SS V. Dispense information and present a thorough explanation of Purchase Order Cycle Time, Purchase Order Accuracy using the slides given. This template can be altered and personalized to fit your needs. It is also available for immediate download. So grab it now.
-
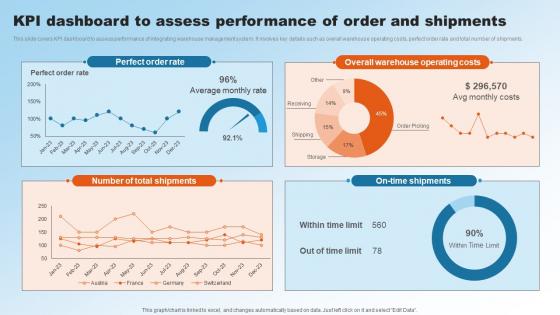 KPI Dashboard To Assess Performance Of Order Implementing Upgraded Strategy To Improve Logistics
This slide covers KPI dashboard to assess performance of integrating warehouse management system. It involves key details such as overall warehouse operating costs, perfect order rate and total number of shipments. Present the topic in a bit more detail with this KPI Dashboard To Assess Performance Of Order Implementing Upgraded Strategy To Improve Logistics. Use it as a tool for discussion and navigation on Perfect Order Rate, Number Of Total Shipments. This template is free to edit as deemed fit for your organization. Therefore download it now.
-
 Kpi Dashboard To Assess Performance Of Order And Shipments Transportation And Fleet Management
This slide covers KPI dashboard to assess performance of integrating warehouse management system. It involves key details such as overall warehouse operating costs, perfect order rate and total number of shipments. Deliver an outstanding presentation on the topic using this Kpi Dashboard To Assess Performance Of Order And Shipments Transportation And Fleet Management. Dispense information and present a thorough explanation of Dashboard, Performance, Management using the slides given. This template can be altered and personalized to fit your needs. It is also available for immediate download. So grab it now.
-
 Sales Order Summary KPI Dashboard Of E Commerce Store Effective Revenue Optimization Strategy SS
The following slide showcases monthly and half-yearly order summary. It includes elements such as revenue days, refund, transaction status, paid, unpaid, subscriptions, current and previous details, etc. Present the topic in a bit more detail with this Sales Order Summary KPI Dashboard Of E Commerce Store Effective Revenue Optimization Strategy SS. Use it as a tool for discussion and navigation on Sales Order Summary, KPI Dashboard, E Commerce Store. This template is free to edit as deemed fit for your organization. Therefore download it now.
-
 Customer Order Management KPI Dashboard Strategies To Optimize Ecommerce
This slide illustrates a dashboard aimed orders to ensure efficiency in deliveries to customers. It covers the following metrics such as out of stock items, return rate, back order rate, carrying costs, inventory turnover etc. Present the topic in a bit more detail with this Customer Order Management KPI Dashboard Strategies To Optimize Ecommerce. Use it as a tool for discussion and navigation on Return Rate, Back Order Rate, Product Details. This template is free to edit as deemed fit for your organization. Therefore download it now.
-
 KPI Dashboard Tracking Orders Receivable Strategies To Optimize Ecommerce
This slide illustrates a dashboard aimed orders receivable to ensure quick deliveries. It covers the following metrics such as perfect order rate, on-time delivery, order count, inventory, receivable and payable days. Present the topic in a bit more detail with this KPI Dashboard Tracking Orders Receivable Strategies To Optimize Ecommerce. Use it as a tool for discussion and navigation on Outstanding Receivable Days, Order Count, Product Details Delivered. This template is free to edit as deemed fit for your organization. Therefore download it now.
-
 KPI Dashboard For Tracking Digital Food Order Food Delivery Service Optimization
Mentioned slide provides information about restaurant weekly order tracking dashboard. It includes key elements such as total restaurants total menu, total customers, total sales, orders status, best selling items, and orders by payment types. Present the topic in a bit more detail with this KPI Dashboard For Tracking Digital Food Order Food Delivery Service Optimization. Use it as a tool for discussion and navigation on Total Restaurants, Total Menus, Total Customers. This template is free to edit as deemed fit for your organization. Therefore download it now.
-
 Increase Average Order Value In Retail KPI
This slide highlights average order value retail KPI to increase sales. This further includes use appealing designs, highlights trending products, free shipping thresholds and special customer offer. Introducing our premium set of slides with Increase Average Order Value In Retail KPI. Ellicudate the four stages and present information using this PPT slide. This is a completely adaptable PowerPoint template design that can be used to interpret topics like Use Appealing Designs, Free Shipping Threshold. So download instantly and tailor it with your information.
-
 Business Order Management Warehouse KPIs
This slide mentions order management KPIs of warehouse to evaluate smooth working of order processing. It includes picking accuracy, backorder rate, on time shipping rate, cost per order and rate of return. Introducing our premium set of slides with Business Order Management Warehouse KPIs. Ellicudate the Four stages and present information using this PPT slide. This is a completely adaptable PowerPoint template design that can be used to interpret topics like Picking Accuracy, Backorder Rate, Cost Per Order. So download instantly and tailor it with your information.
-
 Logistic Order Management Warehouse KPI Icon
Presenting our set of slides with Logistic Order Management Warehouse KPI Icon. This exhibits information on Three stages of the process. This is an easy to edit and innovatively designed PowerPoint template. So download immediately and highlight information on Logistic Order Management, Warehouse KPI Icon.
-
 Kpis To Evaluate Order Dispatch Management
This slide represents various KPIs to evaluate order dispatch management including KPIs such as On-time delivery rate, dispatch efficiency, order accuracy, etc. Introducing our Kpis To Evaluate Order Dispatch Management set of slides. The topics discussed in these slides are Dispatch Efficiency, Driver Utilization, Route Optimization, Delivery Cost Per Order. This is an immediately available PowerPoint presentation that can be conveniently customized. Download it and convince your audience.
-
 Inventory kpis dashboard with lead time and order amount
Presenting our well structured Inventory KPIS Dashboard With Lead Time And Order Amount. The topics discussed in this slide are Material, Stock, Quantity Analysis. This is an instantly available PowerPoint presentation that can be edited conveniently. Download it right away and captivate your audience.
-
 Inventory kpis dashboard with order history and total items
Introducing our Inventory KPIS Dashboard With Order History And Total Items set of slides. The topics discussed in these slides are Inventory Turnover, Stock Value, Stock Sold. This is an immediately available PowerPoint presentation that can be conveniently customized. Download it and convince your audience.
-
 Inventory kpis dashboard snapshot with order rate and shipping time
Introducing our Inventory KPIS Dashboard Snapshot With Order Rate And Shipping Time set of slides. The topics discussed in these slides are Inventory KPIS Dashboard With Order Rate And Shipping Time. This is an immediately available PowerPoint presentation that can be conveniently customized. Download it and convince your audience.
-
 Inventory kpis dashboard with sales order and shipping backlog
Introducing our Inventory KPIS Dashboard With Sales Order And Shipping Backlog set of slides. The topics discussed in these slides are Sales, Customer, Product. This is an immediately available PowerPoint presentation that can be conveniently customized. Download it and convince your audience.
-
 Data KPI Dashboard Of Warehouse With Orders Per Day And Inventory
Introducing our Data KPI Dashboard Of Warehouse With Orders Per Day And Inventory set of slides. The topics discussed in these slides are Data KPI Dashboard Of Warehouse With Orders Per Day And Inventory. This is an immediately available PowerPoint presentation that can be conveniently customized. Download it and convince your audience.
-
 Warehouse Data KPI With Order Performance Dashboard Snapshot
Presenting our well structured Warehouse Data KPI With Order Performance Dashboard Snapshot. The topics discussed in this slide are Perfect Order Rate, Inventory Accuracy, Back Order Rate. This is an instantly available PowerPoint presentation that can be edited conveniently. Download it right away and captivate your audience.
-
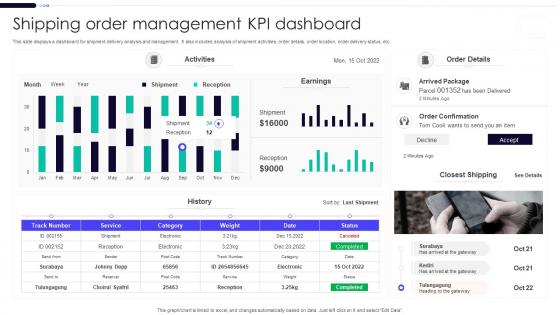 Shipping Order Management KPI Dashboard
This slide displays a dashboard for shipment delivery analysis and management. It also includes analysis of shipment activities, order details, order location, order delivery status, etc. Presenting our well-structured Shipping Order Management KPI Dashboard. The topics discussed in this slide are Shipping Order Management, KPI Dashboard. This is an instantly available PowerPoint presentation that can be edited conveniently. Download it right away and captivate your audience.
-
 KPI Dashboard To Monitor Sales And Orders Performance Brand Extension And Positioning
Following slide displays sales and orders performance monitoring dashboard. Key performance indicators covered in the slide are return reasons, perfect order rate, total orders, top seller by orders. Present the topic in a bit more detail with this KPI Dashboard To Monitor Sales And Orders Performance Brand Extension And Positioning. Use it as a tool for discussion and navigation on Return Reasons, Dashboard, Monitor Sales, Orders Performance. This template is free to edit as deemed fit for your organization. Therefore download it now.
-
 KPI Dashboard To Monitor Sales And Orders Performance Strategic Brand Extension Launching
Following slide displays sales and orders performance monitoring dashboard. Key performance indicators covered in the slide are return reasons, perfect order rate, total orders, top seller by orders.Deliver an outstanding presentation on the topic using this KPI Dashboard To Monitor Sales And Orders Performance Strategic Brand Extension Launching. Dispense information and present a thorough explanation of Return Reasons, Perfect Order, Total Orders using the slides given. This template can be altered and personalized to fit your needs. It is also available for immediate download. So grab it now.
-
 KPI Dashboard To Track Performance Of Order To Cash Process
This slide depicts a dashboard for business managers to keep the track of performance order to cash process for effective decision making. The key elements are orders received, cash receivables, order to cash key performance indicators, days of inventory outstanding etc. Introducing our KPI Dashboard To Track Performance Of Order To Cash Process set of slides. The topics discussed in these slides are Days Of Inventory Outstanding, Inventory Trend, Customer Returns. This is an immediately available PowerPoint presentation that can be conveniently customized. Download it and convince your audience.
-
 Implementing Logistics Strategy Kpi Dashboard To Assess Performance Of Order And Shipments
This slide covers KPI dashboard to assess performance of integrating warehouse management system. It involves key details such as overall warehouse operating costs, perfect order rate and total number of shipments. Present the topic in a bit more detail with this Implementing Logistics Strategy Kpi Dashboard To Assess Performance Of Order And Shipments. Use it as a tool for discussion and navigation on Total Shipments, Warehouse, Operating Costs. This template is free to edit as deemed fit for your organization. Therefore download it now.
-
 E Commerce KPI Dashboard To Track Placed Orders And Sales
This slide brings forth and e commerce KPI dashboard to track the process of placed orders and sales during the month. The key performing indicators are total sales, net sales, sales break down, total orders, item sold, etc. Presenting our well structured E Commerce KPI Dashboard To Track Placed Orders And Sales. The topics discussed in this slide are Total Sales, Items Sold, Sales Break Down. This is an instantly available PowerPoint presentation that can be edited conveniently. Download it right away and captivate your audience.
-
 Order Management System KPI Dashboard Implementing Order Management
This slide represents the key metrics dashboard of the order management system of an enterprise. It includes details related to KPIs such as top selling items, sales order, purchase order etc. Present the topic in a bit more detail with this Order Management System KPI Dashboard Implementing Order Management. Use it as a tool for discussion and navigation on Sales Activity, Product Details, Purchase Order. This template is free to edit as deemed fit for your organization. Therefore download it now.
-
 KPI Dashboard To Monitor Sales And Orders Performance Positioning A Brand Extension
Following slide displays sales and orders performance monitoring dashboard. Key performance indicators covered in the slide are return reasons, perfect order rate, total orders, top seller by orders. Deliver an outstanding presentation on the topic using this KPI Dashboard To Monitor Sales And Orders Performance Positioning A Brand Extension. Dispense information and present a thorough explanation of Return Reasons, Perfect Order Rate, Total Orders using the slides given. This template can be altered and personalized to fit your needs. It is also available for immediate download. So grab it now.
-
 Dashboard To Track Inventory Management Kpis Strategies To Order And Maintain Optimum
This slide showcases KPIs that can help organization to evaluate the efficiency of inventory management process. Its key KPIs are out of stock rate, on time full deliveries, inventory turnover and average time to sell. Deliver an outstanding presentation on the topic using this Dashboard To Track Inventory Management Kpis Strategies To Order And Maintain Optimum. Dispense information and present a thorough explanation of Dashboard, Inventory, Management using the slides given. This template can be altered and personalized to fit your needs. It is also available for immediate download. So grab it now.
-
 Kpi Dashboard Monitor Sales Orders Performance Guide Successful Brand Extension Branding SS
Following slide displays sales and orders performance monitoring dashboard. Key performance indicators covered in the slide are return reasons, perfect order rate, total orders, top seller by orders. Deliver an outstanding presentation on the topic using this Kpi Dashboard Monitor Sales Orders Performance Guide Successful Brand Extension Branding SS. Dispense information and present a thorough explanation of Monitor Sales, Orders Performance using the slides given. This template can be altered and personalized to fit your needs. It is also available for immediate download. So grab it now.
-
 Dashboard To Track Inventory Management Kpis Strategies For Forecasting And Ordering Inventory
This slide showcases KPIs that can help organization to evaluate the efficiency of inventory management process. Its key KPIs areout of stock rate, on time full deliveries, inventory turnover and average time to sell. Deliver an outstanding presentation on the topic using this Dashboard To Track Inventory Management Kpis Strategies For Forecasting And Ordering Inventory Dispense information and present a thorough explanation of Overview 2023, Products Sold Within Freshness Date using the slides given. This template can be altered and personalized to fit your needs. It is also available for immediate download. So grab it now.
-
 Kpi Dashboard To Assess Performance Of Order Key Methods To Enhance
This slide covers KPI dashboard to assess performance of integrating warehouse management system. It involves key details such as overall warehouse operating costs, perfect order rate and total number of shipments. Present the topic in a bit more detail with this Kpi Dashboard To Assess Performance Of Order Key Methods To Enhance Use it as a tool for discussion and navigation on Overall Warehouse Operating Costs, Perfect Order Rate This template is free to edit as deemed fit for your organization. Therefore download it now.
-
 Progress Status Of Order Placed Kpi Dashboard
This template shows the various KPIs for tracking the order progress. The purpose of this slide is to evaluate all the orders on time. It includes KPIs such as orders, global Financial performance, volume of orders, etc. Presenting our well structured Progress Status Of Order Placed Kpi Dashboard The topics discussed in this slide are Volume Today, Global Financial PerformanceThis is an instantly available PowerPoint presentation that can be edited conveniently. Download it right away and captivate your audience.
-
 KPI Dashboard To Assess Performance Of Order Logistics Strategy To Enhance Operations
This slide covers KPI dashboard to assess performance of integrating warehouse management system. It involves key details such as overall warehouse operating costs, perfect order rate and total number of shipments. Present the topic in a bit more detail with this KPI Dashboard To Assess Performance Of Order Logistics Strategy To Enhance Operations Use it as a tool for discussion and navigation on Overall Warehouse, Perfect Order Rate This template is free to edit as deemed fit for your organization. Therefore download it now.
-
 Warehouse kpi for completed correct orders inspection time ppt slide
Presenting warehouse kpi for completed correct orders inspection time ppt slide. This presentation slide shows Three Key Performance Indicators or KPIs in a Dashboard style design. The first KPI that can be shown is Box Order Completeness. The second KPI is Box Order Correctness. The third is Average Dock to Stock Time For Inspection Testing. These KPI Powerpoint graphics are all data driven, and the shape automatically adjusts according to your data. Just right click on the KPI graphic, enter the right value and the shape will adjust automatically. Make a visual impact with our KPI slides.
-
 Warehouse kpi for picked items completed orders correct orders presentation slide
Presenting warehouse kpi for picked items completed orders correct orders presentation slide. This presentation slide shows Three Key Performance Indicators or KPIs in a Dashboard style design. The first KPI that can be shown is Number of Line Items Picked. The second KPI is Pallet Order Completeness. The third is Pallet Order Correctness. These KPI Powerpoint graphics are all data driven, and the shape automatically adjusts according to your data. Just right click on the KPI graphic, enter the right value and the shape will adjust automatically. Make a visual impact with our KPI slides.
-
 Supply chain kpi for safety stock backorders order cycle time presentation slide
Presenting supply chain kpi for safety stock backorders order cycle time presentation slide. This presentation slide shows three Key Performance Indicators or KPIs in a Dashboard style design. The first KPI that can be shown is Size of Safety Stock. The second KPI is percentage of Backorders and the third is Customer Order Cycle Time. These KPI Powerpoint graphics are all data driven, and the shape automatically adjusts according to your data. Just right click on the KPI graphic, enter the right value and the shape will adjust automatically. Make a visual impact with our KPI slides.
-
 Carrying kpi for agreed delivery time free orders cost fuel per package presentation slide
Presenting carrying kpi for agreed delivery time free orders cost fuel per package presentation slide. This presentation slide shows three Key Performance Indicators or KPIs in a Dashboard style design. The first KPI that can be shown is percentage of Agreed Delivery Times Reached. The second KPI is percentage of Free Orders Delivered Cost and the third is Amount of Fuel Per Package. These KPI Powerpoint graphics are all data driven, and the shape automatically adjusts according to your data. Just right click on the KPI graphic, enter the right value and the shape will adjust automatically. Make a visual impact with our KPI slides.
-
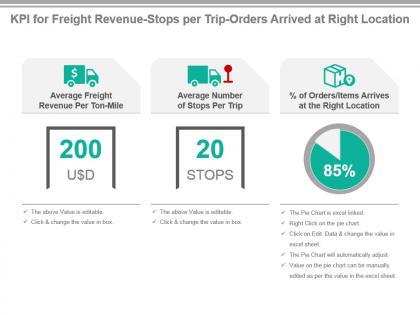 Kpi for freight revenue stops per trip orders arrived at right location presentation slide
Presenting kpi for freight revenue stops per trip orders arrived at right location presentation slide. This presentation slide shows three Key Performance Indicators or KPIs in a Dashboard style design. The first KPI that can be shown is Average Freight Revenue Per Ton Mile. The second KPI is Average Number of Stops Per Trip and the third is percentage of Orders Items Arrives at the Right Location. These KPI Powerpoint graphics are all data driven, and the shape automatically adjusts according to your data. Just right click on the KPI graphic, enter the right value and the shape will adjust automatically. Make a visual impact with our KPI slides.
-
 Transportation kpi for damaged orders on time delivery freight cost ppt slide
Presenting transportation kpi for damaged orders on time delivery freight cost ppt slide. This presentation slide shows three Key Performance Indicators or KPIs in a Dashboard style design. The first KPI that can be shown is percentage of Orders Delivered With Damaged Products Items. The second KPI is on Time Delivery and Pickup Load, Stop and Shipment and the third is Freight Cost Per Unit Shipped. These KPI Powerpoint graphics are all data driven, and the shape automatically adjusts according to your data. Just right click on the KPI graphic, enter the right value and the shape will adjust automatically. Make a visual impact with our KPI slides.
-
 Kpi for average handling cost in order fulfillment powerpoint slide
Presenting kpi for average handling cost in order fulfillment powerpoint slide. This presentation slide shows two Key Performance Indicators or KPIs. The first KPI that can be show is Average Number of Days Open of Orders. The second KPI is Average Handling Cost Per Order. These KPI Powerpoint graphics are all data driven, and the shape automatically adjusts according to your data. Just right click on the KPI graphic, enter the right value and the shape will adjust automatically. Make a visual impact with our KPI slides.
-
 Kpi for committed date order fill rate items picked per hour presentation slide
Presenting kpi for committed date order fill rate items picked per hour presentation slide. This presentation slide shows three Key Performance Indicators or KPIs. The first KPI that can be show is percentage Orders Delivered By Committed Date. The second KPI is Order Fill Rate, Supplier and the third is Picks Per Man Hour. These KPI Powerpoint graphics are all data driven, and the shape automatically adjusts according to your data. Just right click on the KPI graphic, enter the right value and the shape will adjust automatically. Make a visual impact with our KPI slides.
-
 Kpi for customer order fulfilment with lead time analysis ppt slide
Presenting kpi for customer order fulfilment with lead time analysis ppt slide. This presentation slide shows three Key Performance Indicators or KPIs. The first KPI that can be show is Order Fill Rate, Customer. The second KPI is Order Fulfillment Lead Time and the third is percentage of Orders Requiring Rework. These KPI Powerpoint graphics are all data driven, and the shape automatically adjusts according to your data. Just right click on the KPI graphic, enter the right value and the shape will adjust automatically. Make a visual impact with our KPI slides.
-
 Kpi for neglected assigned escalated orders presentation slide
Presenting kpi for neglected assigned escalated orders presentation slide. This presentation slide shows three Key Performance Indicators or KPIs. The first KPI that can be show is percentage of Neglected Orders. The second KPI is percentage of Incorrectly Assigned Orders and the third is percentage of Escalated Orders. These KPI Powerpoint graphics are all data driven, and the shape automatically adjusts according to your data. Just right click on the KPI graphic, enter the right value and the shape will adjust automatically. Make a visual impact with our KPI slides.
-
 Kpi for order entry to shipment delivery errors invoice errors powerpoint slide
Presenting kpi for order entry to shipment delivery errors invoice errors powerpoint slide. This presentation slide shows three Key Performance Indicators or KPIs. The first KPI that can be show is Order Cycle, Order Entry to Shipment. The second KPI is percentage Orders, Delivery Errors and the third is Orders, Nvoice Errors. These KPI Powerpoint graphics are all data driven, and the shape automatically adjusts according to your data. Just right click on the KPI graphic, enter the right value and the shape will adjust automatically. Make a visual impact with our KPI slides.
-
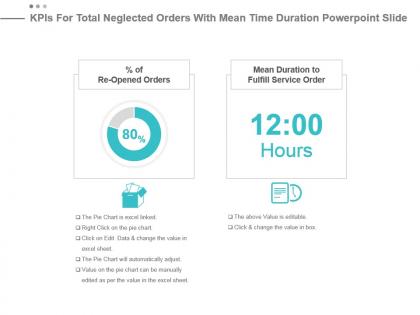 Kpis for total neglected orders with mean time duration powerpoint slide
Presenting kpis for total neglected orders with mean time duration powerpoint slide. This presentation slide shows two Key Performance Indicators or KPIs. The first KPI that can be show is percentage of Re Opened Orders . The second KPI is Mean Duration to Fulfill Service Order. These KPI Powerpoint graphics are all data driven, and the shape automatically adjusts according to your data. Just right click on the KPI graphic, enter the right value and the shape will adjust automatically. Make a visual impact with our KPI slides.
-
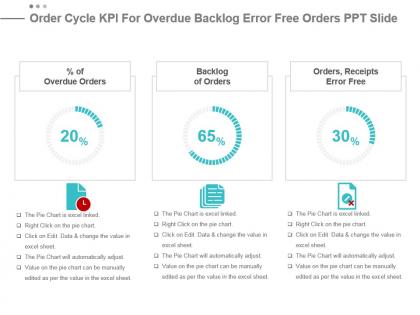 Order cycle kpi for overdue backlog error free orders ppt slide
Presenting order cycle kpi for overdue backlog error free orders ppt slide. This presentation slide shows three Key Performance Indicators or KPIs. The first KPI that can be show is percentage of Overdue Orders. The second KPI is Backlog of Orders and the third is Orders, Receipts Error Free. These KPI Powerpoint graphics are all data driven, and the shape automatically adjusts according to your data. Just right click on the KPI graphic, enter the right value and the shape will adjust automatically. Make a visual impact with our KPI slides.
-
 Ontime value kpi for orders damage shipments ppt slide
Presenting ontime value kpi for orders damage shipments ppt slide. This presentation slide shows two Key Performance Indicators or KPIs in a Dashboard style design. The first KPI that can be shown is Orders, Correct Documentation. The second KPI is Orders, Damage Shipments. These KPI Powerpoint graphics are all data driven, and the shape automatically adjusts according to your data. Just right click on the KPI graphic, enter the right value and the shape will adjust automatically. Make a visual impact with our KPI slides.
-
 Percentage value kpi for edi transactions back orders time presentation slide
Presenting percentage value kpi for edi transactions back orders time presentation slide. This presentation slide shows two Key Performance Indicators or KPIs in a Dashboard style design. The first KPI that can be shown is percentage of EDI transactions. The second KPI is percentage of Time Spent Picking Back Orders. These KPI Powerpoint graphics are all data driven, and the shape automatically adjusts according to your data. Just right click on the KPI graphic, enter the right value and the shape will adjust automatically. Make a visual impact with our KPI slides.
-
 Suppliers kpi for uninterrupted orders forecast accuracy powerpoint slide
Presenting suppliers kpi for uninterrupted orders forecast accuracy powerpoint slide. This presentation slide shows two Key Performance Indicators or KPIs in a Dashboard style design. The first KPI that can be shown is Percentage of Uninterrupted Orders. The second KPI is Forecast Accuracy. These KPI Powerpoint graphics are all data driven, and the shape automatically adjusts according to your data. Just right click on the KPI graphic, enter the right value and the shape will adjust automatically. Make a visual impact with our KPI slides.
-
 Engineering procurement and construction kpi dashboard showing cost of purchase order and cost reduction
You can use this PPT slideshow very easily as it is fully customizable. You can effortlessly insert or remove any diagrammatic representation from the given template. The font size, font color and font style can be easily edited. This graph PPT is linked to excel and changes automatically based on the data you enter. You can save the deck in either PDF or JPG format. To make any changes in the PPT slideshow, simply follow the instructions given in the sample slides. The size, color and orientation of all shapes are 100% customizable, so don’t waste any further time and download this presentation.
-
 Engineering procurement and construction kpi showing production volume and quantity ordered
Presenting this set of slides with name - Engineering Procurement And Construction Kpi Showing Production Volume And Quantity Ordered. This is a four stage process. The stages in this process are Engineering, Procurement And Construction, Construction Management, Engineering, Purchasing And Construction .
-
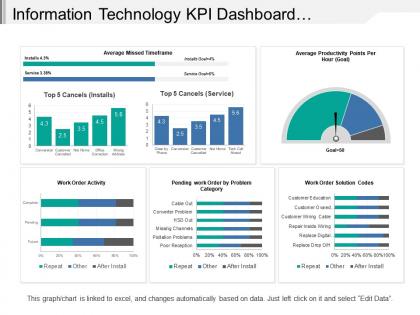 Information technology kpi dashboard showing work order activity
Presenting this set of slides with name - Information Technology Kpi Dashboard Showing Work Order Activity. This is a six stage process. The stages in this process are Information Technology, It, Iot.
-
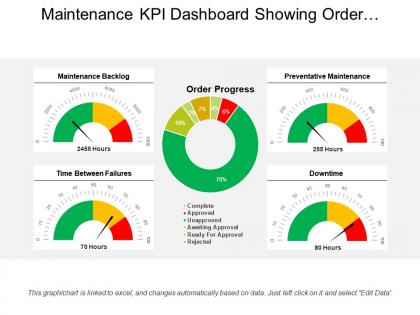 Maintenance kpi dashboard showing order progress and backlog
Presenting our maintenance KPI dashboard showing order progress and backlog. This PPT slide offers you plenty of space to put in titles and sub titles. High resolution-based presentation layout, does not change the image even after resizing. This presentation icon is data driven and template can be downloaded via excel file to incorporate data. Quick downloading speed and simple editing options in color text and fonts.PPT icons can easily be changed into JPEG and PDF applications.
-
 Maintenance kpi dashboard showing overdue work orders by priority and department
Presenting this set of slides with name - Maintenance Kpi Dashboard Showing Overdue Work Orders By Priority And Department. This is a four stage process. The stages in this process are Maintenance, Preservation, Conservation.


