Powerpoint Templates and Google slides for KPI And Dashboard
Save Your Time and attract your audience with our fully editable PPT Templates and Slides.
-
 Compliance and legal kpi dashboard showing outcome comparison
Presenting this set of slides with name - Compliance And Legal Kpi Dashboard Showing Outcome Comparison. This is a three stage process. The stages in this process are Compliance And Legal, Legal Governance, Risk Management.
-
 Compliance and legal kpi dashboard showing overall compliance maturity level
Presenting this set of slides with name - Compliance And Legal Kpi Dashboard Showing Overall Compliance Maturity Level. This is a three stage process. The stages in this process are Compliance And Legal, Legal Governance, Risk Management.
-
 Compliance and legal kpi dashboard showing overall compliance status
Presenting this set of slides with name - Compliance And Legal Kpi Dashboard Showing Overall Compliance Status. This is a three stage process. The stages in this process are Compliance And Legal, Legal Governance, Risk Management.
-
 Compliance and legal kpi dashboard showing regulatory compliance
Presenting this set of slides with name - Compliance And Legal Kpi Dashboard Showing Regulatory Compliance. This is a four stage process. The stages in this process are Compliance And Legal, Legal Governance, Risk Management.
-
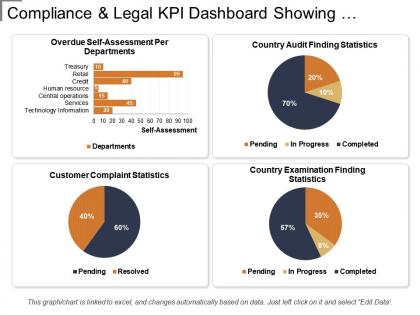 Compliance and legal kpi dashboard showing self-assessment per department
Presenting this set of slides with name - Compliance And Legal Kpi Dashboard Showing Self-Assessment Per Department. This is a four stage process. The stages in this process are Compliance And Legal, Legal Governance, Risk Management.
-
 Compliance and legal kpi dashboard showing total matter value
Presenting this set of slides with name - Compliance And Legal Kpi Dashboard Showing Total Matter Value. This is a six stage process. The stages in this process are Compliance And Legal, Legal Governance, Risk Management.
-
 Compliance and legal kpi dashboard showing violations by devices
Presenting this set of slides with name - Compliance And Legal Kpi Dashboard Showing Violations By Devices. This is a six stage process. The stages in this process are Compliance And Legal, Legal Governance, Risk Management.
-
 Vendor kpi dashboard showing defect rate on-time suppliers and lead time
Presenting this set of slides with name - Vendor Kpi Dashboard Showing Defect Rate On-Time Suppliers And Lead Time. This is a stage process. The stages in this process are Vendor, Supplier, Retailer.
-
 Vendor kpi dashboard showing gross sales earnings sold and sales report
Presenting this set of slides with name - Vendor Kpi Dashboard Showing Gross Sales Earnings Sold And Sales Report. This is a four stage process. The stages in this process are Vendor, Supplier, Retailer.
-
 Vendor kpi dashboard showing missing percentage unmatched serials and control percentage
Presenting this set of slides with name - Vendor Kpi Dashboard Showing Missing Percentage Unmatched Serials And Control Percentage. This is a five stage process. The stages in this process are Vendor, Supplier, Retailer.
-
 Vendor kpi dashboard showing order detail inventory and orders to ship today
Presenting this set of slides with name - Vendor Kpi Dashboard Showing Order Detail Inventory And Orders To Ship Today. This is a four stage process. The stages in this process are Vendor, Supplier, Retailer.
-
 Vendor kpi dashboard showing role holder alerts and specialization chart
Presenting Vendor KPI Dashboard Showing Role Holder Alerts And Specialization Chart Pictures PPT slide. This presentation design has been professionally designed, is fully editable in PowerPoint and is compatible with Google slides as well. The font type, font size, colors of the diagrams, background color are customizable and the company logo can be added too. High quality graphs, charts, tables and icons ensure that there is no deteriorating in quality on enlarging their size. Fast download at click of a button.
-
 Vendor kpi dashboard showing store analytics sales by product and product stats
Presenting this set of slides with name - Vendor Kpi Dashboard Showing Store Analytics Sales By Product And Product Stats. This is a four stage process. The stages in this process are Vendor, Supplier, Retailer.
-
 Vendor kpi dashboard showing supplier compliance stats and procurement cycle time
Presenting this set of slides with name - Vendor Kpi Dashboard Showing Supplier Compliance Stats And Procurement Cycle Time. This is a four stage process. The stages in this process are Vendor, Supplier, Retailer.
-
 Agriculture and forestry kpi dashboard showing average milk yield per lactation
Exhibiting agriculture and forestry KPI dashboard showing average milk yield per lactation PPT design. Speedy download with easy to save options. Effortless to put in corporation name, logo and image. Presentation template can be shared with Google slides as easily merge with them. PowerPoint graphic can be showcased in standard and widescreen view. Preference to download and present with different nodes and stages. PPT diagram can be modify easily as some components are editable.
-
 Agriculture and forestry kpi dashboard showing crop production and chemical fertilizers consumptions
Displaying agriculture and forestry KPI dashboard showing crop production and chemical fertilizers consumptions presentation slide. Modify the design with trademark and picture. PowerPoint diagram is well-matched with Google slides. Colors and text can be amended as the PPT graphic comes with easy to use editing options. Presentation design can be delivered in both standard and widescreen display view. Flexible with other software options such as PDF or JPG formats as can be converted effortlessly.
-
 Agriculture and forestry kpi dashboard showing deforestation restoration of degraded lands
Stunning agriculture and forestry KPI dashboard showing deforestation restoration of degraded lands PowerPoint template. Choice to display PowerPoint template in standard and widescreen view. Presentation designs are well-suited with Google slides or MS Office PowerPoint programs. Can be transformed into JPG and PDF format. Trouble-free replacement of your company’s logo. Access to open on a big screen display. Perfect for business professionals, managers and industry leaders. Customize the fonts, colors, layout, etc.as per your requirements and business needs.
-
 Agriculture and forestry kpi dashboard showing milk production cost by number of cows
Readymade agriculture and forestry KPI dashboard showing milk production cost by number of cows PPT template. Attuned with Microsoft office software’s as well as Google slides. Amend and customize the PPT slide by adding the corporate trademark. Assistance to make changes has been provided in the slide. Useful for sales leaders, marketers, business professionals, analysts, strategists, etc. Effortlessly and fluently adjustable by any user at any time without even having any expertize. Fast to download, share and insert in the presentation.
-
 Agriculture and forestry kpi dashboard showing most common tree types height of the tree
Highlighting agriculture and forestry KPI dashboard showing most common tree types height of the tree PPT template. An easy access to make the desired changes or edit it anyways. Wide screen view of the slides. Easy conversion into Jpeg or Pdf format. The PPT images offer compatibility with Google slides. Valuable for business professionals, sales representatives, marketing professionals, students and selling investigators. High quality charts and visuals used in the designing process. They enhance the performance of the presentation.
-
 Agriculture and forestry kpi dashboard showing planting progress and seeds planted
Introducing agriculture and forestry KPI dashboard showing planting progress and seeds planted PPT template. The presentation template can be downloaded and saved in any desired format. Valuable for the business presenters and entrepreneurs as they can showcase their business success in a creative way. Privilege of insertion of logo and trademarks for more personalization. Adaptable to wide screen view without the problem of pixilation. Can be used with Google slides. Beneficial for industry professionals, managers, executives, researchers, sales people, etc.
-
 Agriculture and forestry kpi dashboard showing production cost and working capital sow
Presenting agriculture and forestry KPI dashboard showing production cost and working capital sow PPT slideshow. Easy and convenient downloading by following simple steps. They have an amazing view to grab the attention if the viewer. They are popular and in demand due to their easy use and accessibility. They maintain the professionalism of the presentation. Fully compatible with Google slides. Have the tendency to enhance the overall impact of your presentation. User friendly PPT templates. Presented to be saved in jpg or pdf format if required.
-
 Agriculture and forestry kpi dashboard showing productivity per crop and farm
Pre-designed agriculture and forestry KPI dashboard showing productivity per crop and farm PPT template. Beneficial for managers, professors, marketers, etc. Flexible option for conversion in PDF or JPG formats. Useful for making business plan and strategies. Can also be used with Google slides. Replace the images, text and the content in the slide design. Change the size, style and orientation of the slides. Use your company’s name or brand name to make it your own presentation template.
-
 Agriculture and forestry kpi dashboard showing roi per crop production and industry claim count
Presenting agriculture and forestry KPI dashboard showing ROI per crop production and industry claim count PowerPoint slide. Unaffected high-resolution PowerPoint slide. Include or exclude slide content as per your individual need. Personalize the presentation with individual company name and logo. Beneficial for industry professionals, managers, executives, researchers, sales people, etc. This template is available in both Standard and Widescreen slide size. Easy and quick downloading process. Flexible option for conversion in PDF or JPG formats. Compatible with Google slides.
-
 Agriculture and forestry kpi dashboard showing us gdp production target
Highlighting agricultural and forestry KPI dashboard showing us gdp production target PowerPoint slide. Useful tool for students, business analysts, sales people, sales managers and professionals of any industry. Precise and easy to comprehend information on PPT sample. Useful for marketing and business-related presentations. Wide screen projection does not affect the output adversely. Access to save in the JPG or PDF format. Increase the level of personalization with your company logo and name. Compatible with all software and can be saved in any format.
-
 Environmental sustainability kpi dashboard showing carbon footprint and electricity usage
Presenting the environmental sustainability KPI dashboard PowerPoint slide. This presentation slide is fully editable in PowerPoint. It is customizable according to your requirement. The font color, style, size, diagram color and background color of slide can be changed as per your requirement. You can conveniently replace the sample content in text placeholders with your presentation content. This template is suitable for use with Google Slides. It can be saved in JPG or PDF formats. It is available in both standard size and wide screen size. Download it quickly at the click of a button.
-
 Environmental sustainability kpi dashboard showing global carbon emission and gdp growth
Presenting this set of slides with name - Environmental Sustainability Kpi Dashboard Showing Global Carbon Emission And Gdp Growth. This is a four stage process. The stages in this process are Environment Sustainability, Environment Continual, Environment Feasibility.
-
 Environmental sustainability kpi dashboard showing instant power cost carbon and consumption
Presenting this set of slides with name - Environmental Sustainability Kpi Dashboard Showing Instant Power Cost Carbon And Consumption. This is a three stage process. The stages in this process are Environment Sustainability, Environment Continual, Environment Feasibility.
-
 Environmental sustainability kpi dashboard showing social footprint and supply chain category
Presenting this set of slides with name - Environmental Sustainability Kpi Dashboard Showing Social Footprint And Supply Chain Category. This is a six stage process. The stages in this process are Environment Sustainability, Environment Continual, Environment Feasibility.
-
 Wholesale and retail kpi dashboard showing average transaction size and customer retention
Presenting this set of slides with name - Wholesale And Retail Kpi Dashboard Showing Average Transaction Size And Customer Retention. This is a four stage process. The stages in this process are Wholesale And Retail, Extensive And Retail, Wholesale And Distribute.
-
 Wholesale and retail kpi dashboard showing distribution centers product revenue
Presenting this set of slides with name - Wholesale And Retail Kpi Dashboard Showing Distribution Centers Product Revenue. This is a four stage process. The stages in this process are Wholesale And Retail, Extensive And Retail, Wholesale And Distribute.
-
 Wholesale and retail kpi dashboard showing gross margin as a percentage of selling price
Presenting this set of slides with name - Wholesale And Retail Kpi Dashboard Showing Gross Margin As A Percentage Of Selling Price. This is a three stage process. The stages in this process are Wholesale And Retail, Extensive And Retail, Wholesale And Distribute.
-
 Wholesale and retail kpi dashboard showing inventory level by category sales revenue month
Presenting the retail business slide for PowerPoint. This presentation template is 100% modifiable in PowerPoint and is designed by professionals. You can edit the objects in the slide like font size and font color very easily. This presentation slide is fully compatible with Google Slide and can be saved in JPG or PDF file format without any fuss. Click on the download button to download this template in no time.
-
 Wholesale and retail kpi dashboard showing revenue operating costs net profit
Presenting the KPI dashboard presentation template. This PowerPoint slide is fully editable in PowerPoint and is professionally designed. The user can bring changes to edit the objects in the slide like font size and font color without going through any hassle. This presentation slide is 100% compatible with Google Slide and can be saved in JPG or PDF file format without any fuss. Fast download this at the click of the button.
-
 Wholesale and retail kpi dashboard showing revenue vs units sold
Presenting the retail business template for PowerPoint. This PowerPoint template is 100% editable in PowerPoint and is professionally designed. You can edit the objects in the slide like font size and font color very easily. This presentation slide is 100% compatible with Google Slide and can be saved in JPG or PDF file format without any fuss. Fast download this at the click of the button.
-
 Wholesale and retail kpi dashboard showing sales revenue customers and out of stock items
Presenting the KPI dashboard presentation template. This PPT template is 100% customizable in MS PowerPoint and is designed under the strict supervision of professionals. The user can edit the objects in the slide like font size and font color without any hassle. This presentation template is 100% compatible with Google Slide and can be saved in JPG or PDF file format easily. Click on the download tab to download this presentation template.
-
 Wholesale and retail kpi dashboard showing shopify total amount sold percentage sales by product category
Presenting the retail business presentation template for PowerPoint. This PowerPoint template is 100% editable in PowerPoint and is professionally designed. You can edit the objects in the slide like font size and font color very easily. This presentation template is 100% compatible with Google Slide and can be saved in JPG or PDF file format without any fuss. Fast download this at the click of the button.
-
 Wholesale and retail kpi dashboard showing total sales per labor hour sales by unit area
Presenting the KPI dashboard template for PowerPoint. This PPT template is 100% customizable in MS PowerPoint and is professionally designed. You can edit the objects in the slide like font size and font color very easily. This presentation template is 100% compatible with Google Slide and can be saved in JPG or PDF file format without any fuss. Click on the download button to download this presentation template.
-
 Wholesale and retail kpi dashboard showing total stores by type employee turnover by city
Presenting the KPI dashboard presentation template. This PPT template is 100% editable in MS PowerPoint and is designed professionally. You can edit the objects in the slide like font size and font color very easily. This presentation template is 100% compatible with Google Slide and can be saved in JPG or PDF file format easily. Click on the download tab to download this presentation template.
-
 Executing reporting kpi dashboard showing sales opportunity and sales booking
Presenting this set of slides with name - Executing Reporting Kpi Dashboard Showing Sales Opportunity And Sales Booking. This is a four stage process. The stages in this process are Executive Reporting, Executive Analysis, Executive Performance.
-
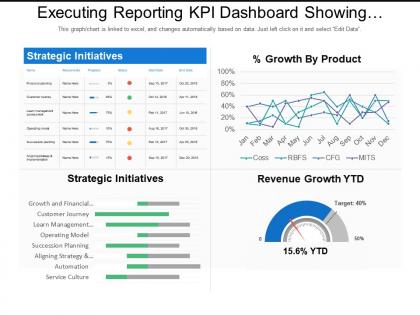 Executing reporting kpi dashboard showing strategic initiatives and percentage growth by product
Presenting this set of slides with name - Executing Reporting Kpi Dashboard Showing Strategic Initiatives And Percentage Growth By Product. This is a four stage process. The stages in this process are Executive Reporting, Executive Analysis, Executive Performance.
-
 Executing reporting kpi dashboard showing trading summary performance summary and sales ratio
Presenting this set of slides with name - Executing Reporting Kpi Dashboard Showing Trading Summary Performance Summary And Sales Ratio. This is a four stage process. The stages in this process are Executive Reporting, Executive Analysis, Executive Performance.
-
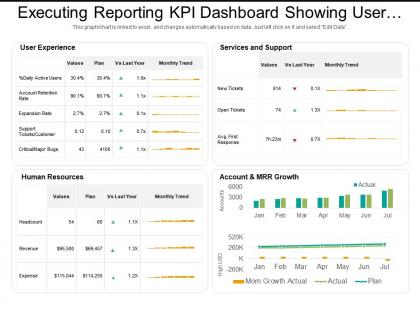 Executing reporting kpi dashboard showing user experience and human resources
Presenting this set of slides with name - Executing Reporting Kpi Dashboard Showing User Experience And Human Resources. This is a five stage process. The stages in this process are Executive Reporting, Executive Analysis, Executive Performance.
-
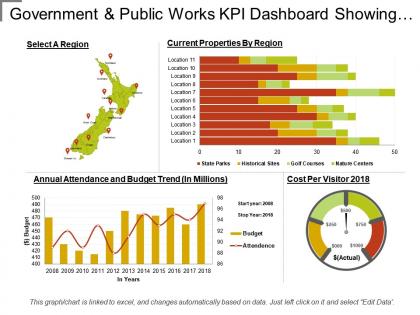 Government and public works kpi dashboard showing annual attendance and budget
Presenting this set of slides with name - Government And Public Works Kpi Dashboard Showing Annual Attendance And Budget. This is a four stage process. The stages in this process are Government And Public Works, Government And Public Tasks.
-
 Government and public works kpi dashboard showing criminal records
Presenting this set of slides with name - Government And Public Works Kpi Dashboard Showing Criminal Records. This is a eight stage process. The stages in this process are Government And Public Works, Government And Public Tasks.
-
 Government and public works kpi dashboard showing requests per day and city stats
Presenting this set of slides with name - Government And Public Works Kpi Dashboard Showing Requests Per Day And City Stats. This is a five stage process. The stages in this process are Government And Public Works, Government And Public Tasks.
-
 Government and public works kpi dashboard showing revenue and expenditure overview
Presenting this set of slides with name - Government And Public Works Kpi Dashboard Showing Revenue And Expenditure Overview. This is a four stage process. The stages in this process are Government And Public Works, Government And Public Tasks.
-
 Government and public works kpi dashboard showing sentiment trending topics and issues
Presenting this set of slides with name - Government And Public Works Kpi Dashboard Showing Sentiment Trending Topics And Issues. This is a six stage process. The stages in this process are Government And Public Works, Government And Public Tasks.
-
 Government and public works kpi dashboard showing service request count and time to close
Presenting this set of slides with name - Government And Public Works Kpi Dashboard Showing Service Request Count And Time To Close. This is a five stage process. The stages in this process are Government And Public Works, Government And Public Tasks.
-
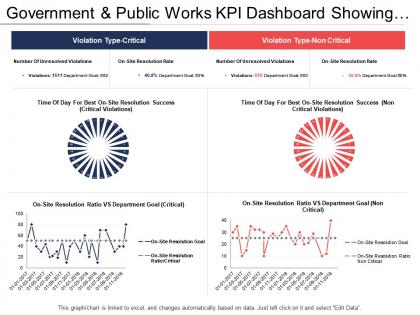 Government and public works kpi dashboard showing violation type and departmental goals
Presenting this set of slides with name - Government And Public Works Kpi Dashboard Showing Violation Type And Departmental Goals. This is a four stage process. The stages in this process are Government And Public Works, Government And Public Tasks.
-
 Government and public works kpi dashboard showing water sewerage department
Presenting the KPI dashboard PPT template. This KPI presentation layout is 100% modifiable and is designed professionally. You can edit the objects in this slide like font color and font size without going through any fuss. This presentation template is 100% compatible with Google Slide and can be saved in JPG or PDF file format hassle-free. To download this, click on the button below.
-
 Government and public works kpi dashboard showing work assignment and due dates
Presenting the KPI dashboard presentation slide. This KPI presentation template is completely modifiable and is designed professionally. You can edit the objects in this slide like font color and font size without going through any fuss. This presentation slide is fully compatible with Google Slide and can be saved in JPG or PDF file format hassle-free. To download this, click on the button below.
-
 Government and public works kpi dashboard showing work order by category and status
Presenting the KPI dashboard presentation layout. This dashboard template is completely customizable and is professionally designed. You can modify the objects in the template like font color and font size without going through any fuss. This presentation slide is fully compatible with Google Slide and can be saved in JPG or PDF file format without any hassle. Fast download this at the click of the button.
-
 Health and safety kpi dashboard for organizations
Presenting this set of slides with name - Health And Safety Kpi Dashboard For Organizations. This is a four stage process. The stages in this process are Health And Safety, Health And Security, Health And Protection.
-
 Health and safety kpi dashboard showing event classification breakdown
Presenting the modern dashboard PPT template. This dashboard PPT design is 100% editable and is created by professionals. You can bring changes to the objects in the template like font size and font color very easily. This presentation slide is fully compatible with Google Slide and can be saved in JPG or PDF file format without any hassle. Fast download this at the click of the button.
-
 Health and safety kpi dashboard showing event source analysis
Presenting the colorful dashboard presentation layout. This modern dashboard design is fully editable and is created under the strict supervision of professionals. You can bring changes to the objects in the slide like font size and font color hassle-free. This presentation slide is fully compatible with Google Slide and can be saved in JPG or PDF file format without any hassle. Fast download this at the click of the button.
-
 Health and safety kpi dashboard showing events by category
Presenting health and safety presentation template. This modern dashboard design is fully editable and is created under the strict supervision of professionals. You can bring changes to the objects in the slide like font size and font color hassle-free. This presentation slide is fully compatible with Google Slide and can be saved in JPG or PDF file format without any hassle. Fast download this at the click of the button.
-
 Health and safety kpi dashboard showing incident by type and frequency rates
Presenting the dashboard presentation slide. This KPI dashboard is fully editable and is designed by professionals looking for professional presentation design. You can edit the objects in the slide like font size and font color easily. This presentation slide is fully compatible with Google Slide and can be saved in JPG or PDF file format without any hassle. Click on the download button below.
-
 Health and safety kpi dashboard showing incidents severity and consequences
Presenting the health and safety PPT slide. This PPT slide is fully editable and is designed by professionals looking for a professional presentation. You can edit the objects in the slide like font size and font color easily. This presentation slide is fully compatible with Google Slide and can be saved in JPG or PDF file format easily. Click on the download button below.
-
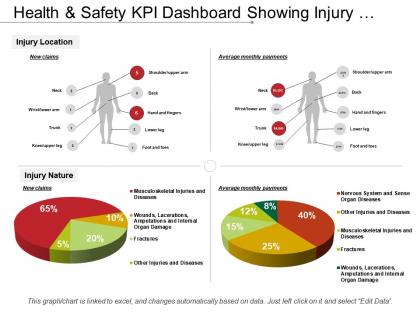 Health and safety kpi dashboard showing injury location and injury nature
Presenting the KPI dashboard PPT slide. This PPT template is fully editable and is designed by professionals looking for a professional presentation. You can edit the objects in the slide like font size and font color easily. This presentation slide is fully compatible with Google Slide and can be saved in JPG or PDF file format easily. Click on the download button below.
-
 Health and safety kpi dashboard showing inspections and injuries
Presenting this set of slides with name - Health And Safety Kpi Dashboard Showing Inspections And Injuries. This is a five stage process. The stages in this process are Health And Safety, Health And Security, Health And Protection.


