Powerpoint Templates and Google slides for KPI And Dashboard
Save Your Time and attract your audience with our fully editable PPT Templates and Slides.
-
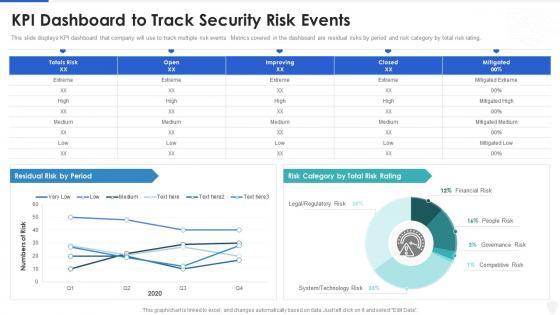 Cybersecurity and digital business risk management kpi dashboard to track security risk events
Present the topic in a bit more detail with this Cybersecurity And Digital Business Risk Management Kpi Dashboard To Track Security Risk Events. Use it as a tool for discussion and navigation on KPI Dashboard To Track Security Risk Events. This template is free to edit as deemed fit for your organization. Therefore download it now.
-
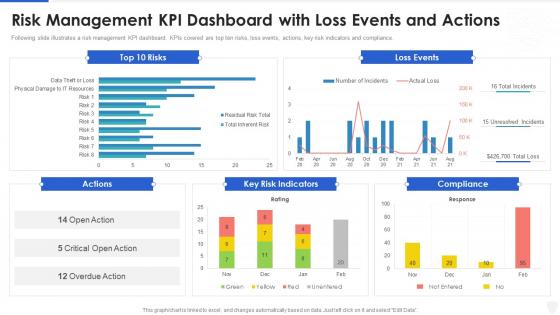 Cybersecurity and digital business risk management risk management kpi dashboard
Following slide illustrates a risk management KPI dashboard. KPIs covered are top ten risks, loss events, actions, key risk indicators and compliance. Deliver an outstanding presentation on the topic using this Cybersecurity And Digital Business Risk Management Risk Management Kpi Dashboard. Dispense information and present a thorough explanation of Risk Management KPI Dashboard With Loss Events And Actions using the slides given. This template can be altered and personalized to fit your needs. It is also available for immediate download. So grab it now.
-
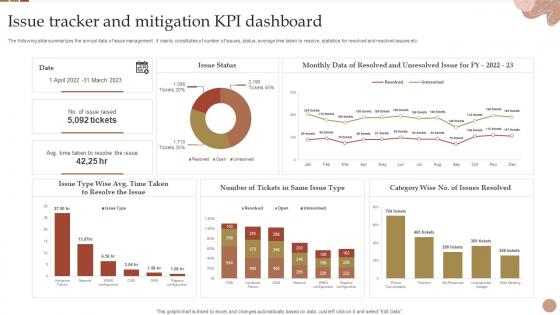 Issue Tracker And Mitigation KPI Dashboard
The following slide summarizes the annual data of issue management. It mainly constitutes of number of issues, status, average time taken to resolve, statistics for resolved and resolved issues etc. Presenting our well-structured Issue Tracker And Mitigation KPI Dashboard. The topics discussed in this slide are Issue Tracker, Mitigation KPI Dashboard. This is an instantly available PowerPoint presentation that can be edited conveniently. Download it right away and captivate your audience.
-
 Offline And Online Merchandising KPI Dashboard To Analyze In Store Merchandising Strategy
The following slide outlines KPI metrics dashboard which can be used to measure the effectiveness of online marketing on retail store. The metrics covered in the slide are new orders, total income, expense, new users, best selling products, etc. Present the topic in a bit more detail with this Offline And Online Merchandising KPI Dashboard To Analyze In Store Merchandising Strategy. Use it as a tool for discussion and navigation on Summary, Selling Products, Total Income, New Orders. This template is free to edit as deemed fit for your organization. Therefore download it now.
-
 Offline And Online Merchandising KPI Metrics Dashboard To Measure Online Merchandising
The following slide outlines a performance key performance indicator KPI dashboard used to evaluate the effectiveness of in-store merchandising strategy. The kpis covered in the slide are total sales, average inventory, active stores, distinct products sold, etc. Deliver an outstanding presentation on the topic using this Offline And Online Merchandising KPI Metrics Dashboard To Measure Online Merchandising. Dispense information and present a thorough explanation of Distinct Products Sold, Average Selling Price, Products using the slides given. This template can be altered and personalized to fit your needs. It is also available for immediate download. So grab it now.
-
 Ecommerce KPI Dashboard With P And L Statement Improving Financial Management Process
This slide showcases ecommerce key performance indicators KPI dashboard with financial statement. It provides information about total sales, orders, net profit, net profit margin, average order value, channels, etc. Deliver an outstanding presentation on the topic using this Ecommerce KPI Dashboard With P And L Statement Improving Financial Management Process. Dispense information and present a thorough explanation of Ecommerce, KPI Dashboard, P And L Statement using the slides given. This template can be altered and personalized to fit your needs. It is also available for immediate download. So grab it now.
-
 Marketing Team Training And Development Program Kpi Dashboard
This slide represents the checklist of the training program conducted for the development of the marketing team of the organization. It includes activities related to conduct of marketing teams training program. Introducing our Marketing Team Training And Development Program Kpi Dashboard set of slides. The topics discussed in these slides are Dashboard, Development, Marketing. This is an immediately available PowerPoint presentation that can be conveniently customized. Download it and convince your audience.
-
 Employee Engagement And Company Culture Dashboard Kpis To Assess Business Performance
Following slide shows employee engagement and company culture dashboard. It includes employee details, engagement score, total given recognition, previous seven days performance and radar chart to measure employee performance. Deliver an outstanding presentation on the topic using this Employee Engagement And Company Culture Dashboard Kpis To Assess Business Performance. Dispense information and present a thorough explanation of Engagement, Dashboard, Performance using the slides given. This template can be altered and personalized to fit your needs. It is also available for immediate download. So grab it now.
-
 Revenue And Employment Cost Dashboard Kpis To Assess Business Performance
Mentioned slide covers revenue and employment cost dashboard. It includes details like full time employee number, total employment cost, total revenue and average revenue per FTE. Deliver an outstanding presentation on the topic using this Revenue And Employment Cost Dashboard Kpis To Assess Business Performance. Dispense information and present a thorough explanation of Revenue, Employment, Cost Dashboard using the slides given. This template can be altered and personalized to fit your needs. It is also available for immediate download. So grab it now.
-
 Sales And Operations KPI Dashboard To Increase Efficiency
This slide covers sales and operations KPI dashboard to increase efficiency. It involves performance, increase in profit, target, monthly profit and quarterly revenue trend. Introducing our Sales And Operations KPI Dashboard To Increase Efficiency set of slides. The topics discussed in these slides are Increase In Profit, Quartely Revenue Trend, Account In Arrear. This is an immediately available PowerPoint presentation that can be conveniently customized. Download it and convince your audience.
-
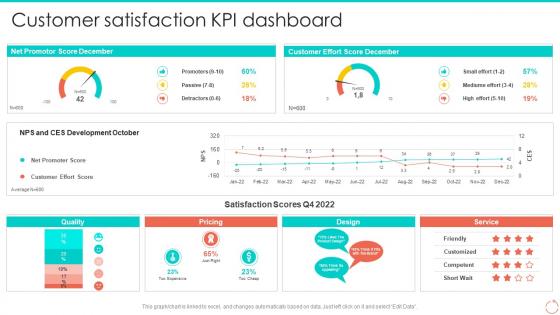 Customer Satisfaction Kpi Dashboard Personal Branding Guide For Professionals And Enterprises
Deliver an outstanding presentation on the topic using this Customer Satisfaction Kpi Dashboard Personal Branding Guide For Professionals And Enterprises. Dispense information and present a thorough explanation of Customer, Satisfaction, Dashboardusing the slides given. This template can be altered and personalized to fit your needs. It is also available for immediate download. So grab it now.
-
 Education Dashboard With Absenteeism And Grade Details KPI
This slide covers dashboard for tracking causes and rates of student absenteeism. It also include metrics such as average grades by subject and department. Introducing our Education Dashboard With Absenteeism And Grade Details KPI set of slides. The topics discussed in these slides are Information Systems, Economic Informatics, Education Dashboard. This is an immediately available PowerPoint presentation that can be conveniently customized. Download it and convince your audience.
-
 Education Dashboard With Enrollment And Retention KPI
This slide displays student enrollment and attendance KPI tracking dashboard. It also include metrics such as student attendance percentage, course completion rate, freshman retention, teacher-to-student ratio, enrollment by gender, ethnicity, courses, age group, etc. Introducing our Education Dashboard With Enrollment And Retention KPI set of slides. The topics discussed in these slides are Education Dashboard, Enrollment And Retention KPI. This is an immediately available PowerPoint presentation that can be conveniently customized. Download it and convince your audience.
-
 Education Dashboard With Fees Collection And Expense KPI
This slide covers education key performance indicators tracking dashboard. It also include metrics such as total students, teachers, parents, total earrings, social media followers, event calendar, fees collection, and expenses. Presenting our well structured Education Dashboard With Fees Collection And Expense KPI. The topics discussed in this slide are Education Dashboard, Fees Collection, Expense KPI. This is an instantly available PowerPoint presentation that can be edited conveniently. Download it right away and captivate your audience.
-
 Education Dashboard With Student Attendance And Detention KPI
This slide showcases the student enrollment and suspension KPI tracker. It includes KPIs such as enrollment status, attendance percentage, suspension rate, etc. Introducing our Education Dashboard With Student Attendance And Detention KPI set of slides. The topics discussed in these slides are Current Enrollment, Suspension Rate, Attendance. This is an immediately available PowerPoint presentation that can be conveniently customized. Download it and convince your audience.
-
 Education KPI Dashboard For Tracking Student Ethnicity And Specially Abled Characteristics
This slide covers the education key performance indicator tracker. It include metrics such as total applications, conversion rate, offers year to date, applications by ethnicity and disabilities, etc. Introducing our Education KPI Dashboard For Tracking Student Ethnicity And Specially Abled Characteristics set of slides. The topics discussed in these slides are Education KPI Dashboard, Tracking Student Ethnicity, Specially Abled Characteristics. This is an immediately available PowerPoint presentation that can be conveniently customized. Download it and convince your audience.
-
 Training And Education KPI Tracking Dashboard
This slide showcases dashboard for tracking training programs details. It include metrics such as training to invited percentage, unique trained, training man days, total program names, etc. Introducing our Training And Education KPI Tracking Dashboard set of slides. The topics discussed in these slides are Training And Education, KPI Tracking Dashboard. This is an immediately available PowerPoint presentation that can be conveniently customized. Download it and convince your audience.
-
 Business Performance Monitoring KPI Dashboard Mergers And Acquisitions Process Playbook
Following slide illustrates the KPI dashboard for tracking business performance. KPIS covered in the dashboard are net profit margin, income and expenses, accounts receivable, quick and current ratios.Deliver an outstanding presentation on the topic using this Business Performance Monitoring KPI Dashboard Mergers And Acquisitions Process Playbook. Dispense information and present a thorough explanation of Accounts Receivable, Accounts Payable, Income Expenses using the slides given. This template can be altered and personalized to fit your needs. It is also available for immediate download. So grab it now.
-
 Performance KPI Dashboard To Plan And Manage Ecommerce Project
Mentioned slide highlights a comprehensive dashboard which can be used by eCommerce businesses to plan and manage its various projects. The template provides information about total visitors in the current year, sales history of various products, result of the marketing campaign, etc. Introducing our Performance KPI Dashboard To Plan And Manage Ecommerce Project set of slides. The topics discussed in these slides are Performance KPI Dashboard, Plan, Manage Ecommerce Project. This is an immediately available PowerPoint presentation that can be conveniently customized. Download it and convince your audience.
-
 Financial Performance KPI Dashboard With Liquidity And Turnover Ratios
This slide shows dashboard financial performance KPIs. It covers quick ratios, current ratios, cash balance, days sales, inventory and payable outstanding. Presenting our well-structured Financial Performance KPI Dashboard With Liquidity And Turnover Ratios. The topics discussed in this slide are Sales Outstanding, Inventory Outstanding, Payable Outstanding. This is an instantly available PowerPoint presentation that can be edited conveniently. Download it right away and captivate your audience.
-
 Financial Performance KPI Dashboard With Working Capital And Cash Conversion Ratios
This slide shows dashboard of finance KPIs. It covers working capital, cash conversion cycle, vendor payment error rate, current assets and liabilities. Introducing our Financial Performance KPI Dashboard With Working Capital And Cash Conversion Ratios set of slides. The topics discussed in these slides are Current Assets, Current Working Capital, Current Liabilities. This is an immediately available PowerPoint presentation that can be conveniently customized. Download it and convince your audience.
-
 Health And Safety Performance KPI Dashboard
The slide highlights the health and safety performance kpi dashboard illustrating key headings which includes kpi, period, root causes, result matrix and at risk employment. Where kpi depicts lost time incidents, medically treated, with injuries, injured people and total incidents Presenting our well-structured Health And Safety Performance KPI Dashboard. The topics discussed in this slide are Root Causes, Result Matrix, At Risk Employment. This is an instantly available PowerPoint presentation that can be edited conveniently. Download it right away and captivate your audience.
-
 BPA Tools For Process Improvement And Cost Reduction KPI Metrics Dashboard To Measure Automation
The following slide outlines a comprehensive KPI dashboard which can be used by the organization to measure the automation performance in customer support department. It covers kpis such as customer retention, costs per support, customer satisfaction, etc. Present the topic in a bit more detail with this BPA Tools For Process Improvement And Cost Reduction KPI Metrics Dashboard To Measure Automation. Use it as a tool for discussion and navigation on Request Answered 2022, Total Requests 2022, Total Revenue 2022. This template is free to edit as deemed fit for your organization. Therefore download it now.
-
 KPI Dashboard Highlighting Automation Results BPA Tools For Process Improvement And Cost Reduction
The following slide outlines a comprehensive dashboard depicting the business process automation BPA results in the supply chain. Information covered in the slide is related to average order processing days, average shipping days, etc. Present the topic in a bit more detail with this KPI Dashboard Highlighting Automation Results BPA Tools For Process Improvement And Cost Reduction. Use it as a tool for discussion and navigation on Shipment Status, Late Deliveries, Warehouse, Product. This template is free to edit as deemed fit for your organization. Therefore download it now.
-
 KPI Dashboard To Measure Work Place Accident And Workers Safety
This slide signifies key performance indicator dashboard to evaluate work accident. It includes information about total incident occurred by role and by department along with leave status. Presenting our well-structured KPI Dashboard To Measure Work Place Accident And Workers Safety. The topics discussed in this slide are KPI Dashboard, Measure Work Place, Accident, Workers Safety. This is an instantly available PowerPoint presentation that can be edited conveniently. Download it right away and captivate your audience.
-
 Kpi Dashboard For Human Resource Employee Succession Planning And Management
Mentioned slide shows key performance indicator dashboard for human resource. Metrics covered in the dashboard are headcount by seniority and gender, open positions, headcount, termination, hires and turnover. Deliver an outstanding presentation on the topic using this Kpi Dashboard For Human Resource Employee Succession Planning And Management. Dispense information and present a thorough explanation of Human Resource, Dashboard, Termination using the slides given. This template can be altered and personalized to fit your needs. It is also available for immediate download. So grab it now.
-
 Supply Planning KPI Dashboard Depicting Inventory And Costs
This slide delineates supply planning key performance indicator KPI dashboard depicting inventory and costs which can assist logistics manager in determining demand and supply of products. It includes information about transaction based on units, out of stock products, inventory turnover and month to date expenditures. Presenting our well-structured Supply Planning KPI Dashboard Depicting Inventory And Costs. The topics discussed in this slide are Supply Planning, KPI Dashboard, Depicting Inventory, Costs. This is an instantly available PowerPoint presentation that can be edited conveniently. Download it right away and captivate your audience.
-
 Ecommerce Kpi Dashboard With P And L Statement Practices For Enhancing Financial Administration Ecommerce
This slide showcases ecommerce key performance indicators KPI dashboard with financial statement. It provides information about total sales, orders, net profit, net profit margin, average order value, channels, etc. Deliver an outstanding presentation on the topic using this Ecommerce Kpi Dashboard With P And L Statement Practices For Enhancing Financial Administration Ecommerce. Dispense information and present a thorough explanation of Ecommerce, Dashboard, Statement using the slides given. This template can be altered and personalized to fit your needs. It is also available for immediate download. So grab it now.
-
 Financial KPI Dashboard With Liquidity Ratios And Current Assets Breakdown
This showcases KPI dashboard the can help organization to evaluate the financial performance and analyze the liquidity ratios. Its key components are vendor payment error rate, budget variance and cash conversion cycle Introducing our Financial KPI Dashboard With Liquidity Ratios And Current Assets Breakdown set of slides. The topics discussed in these slides are Quick Ratio, Current Ratio, New Profit Margin. This is an immediately available PowerPoint presentation that can be conveniently customized. Download it and convince your audience.
-
 Project Risk Remediation And Management KPI Dashboard
The following slide highlights the project risk management dashboard to evaluate key preforming areas KPAs. It includes elements such as tasks status, progress, time, risk etc. Introducing our Project Risk Remediation And Management KPI Dashboard set of slides. The topics discussed in these slides are Project, Risk Remediation, Management KPI Dashboard. This is an immediately available PowerPoint presentation that can be conveniently customized. Download it and convince your audience.
-
 KPI Metrics Dashboard To Monitor Mobile SEO Guide Internal And External Measures To Optimize
The purpose of this slide is to outline key performance indicator KPI dashboard which will assist the marketer to analyze mobile search engine optimization SEO performance. The key metrics mentioned in the slide are total sessions, search engine rankings etc. Present the topic in a bit more detail with this KPI Metrics Dashboard To Monitor Mobile SEO Guide Internal And External Measures To Optimize. Use it as a tool for discussion and navigation on KPI Metrics, Dashboard Monitor, Mobile SEO Performance. This template is free to edit as deemed fit for your organization. Therefore download it now.
-
 Change Deploy And Release Management KPI Dashboard
This slide represents the dashboard showing change deploy and release management in an IT firm. It includes details related to summary by components, release status, tasks by priority, completed story points trend by sprints etc. Introducing our Change Deploy And Release Management KPI Dashboard set of slides. The topics discussed in these slides are Tasks, Remaining, Sprints. This is an immediately available PowerPoint presentation that can be conveniently customized. Download it and convince your audience.
-
 Customer Service KPI Dashboard For Email And Chat
This slide showcases dashboard for customer service KPI that can help to identify the customer satisfaction score plus implement strategies in case of decline. Its key KPIs are first response time, requester wait time, first response time and time to close. Presenting our well-structured Customer Service KPI Dashboard For Email And Chat. The topics discussed in this slide are Customer Service, KPI Dashboard, Email Chat. This is an instantly available PowerPoint presentation that can be edited conveniently. Download it right away and captivate your audience.
-
 Cyber Security Incident And Privacy Analysis With KPI Dashboard
The following slide highlights some kpas of cyber security incidents to evaluate and monitor threats. It includes elements such as open incidents, warnings by severity, average response time, warnings pending for inspection etc. Introducing our Cyber Security Incident And Privacy Analysis With KPI Dashboard set of slides. The topics discussed in these slides are Cyber Security, Incident And Privacy Analysis, KPI Dashboard. This is an immediately available PowerPoint presentation that can be conveniently customized. Download it and convince your audience.
-
 Brand Extension And Positioning KPI Dashboard To Measure Brand Marketing Ppt Topics
Mentioned slide illustrates KPI dashboard that can be used by organizations to track the performance of their brand performance. Brand, advertising and purchase are the metrics covered in the dashboard. Present the topic in a bit more detail with this Brand Extension And Positioning KPI Dashboard To Measure Brand Marketing Ppt Topics. Use it as a tool for discussion and navigation on Brand Awareness, Advertising Awareness, Market Share. This template is free to edit as deemed fit for your organization. Therefore download it now.
-
 KPI Dashboard To Monitor Sales And Orders Performance Brand Extension And Positioning
Following slide displays sales and orders performance monitoring dashboard. Key performance indicators covered in the slide are return reasons, perfect order rate, total orders, top seller by orders. Present the topic in a bit more detail with this KPI Dashboard To Monitor Sales And Orders Performance Brand Extension And Positioning. Use it as a tool for discussion and navigation on Return Reasons, Dashboard, Monitor Sales, Orders Performance. This template is free to edit as deemed fit for your organization. Therefore download it now.
-
 Kpi Dashboard For Supplier Monitoring Strategic Sourcing And Vendor Quality Enhancement Plan
The slide depicts the KPI dashboard for the supplier monitoring. It provides information regarding the monthly purchase value, number of contracted suppliers, scheduled and completed audits along with vendors quality performance. Present the topic in a bit more detail with this Kpi Dashboard For Supplier Monitoring Strategic Sourcing And Vendor Quality Enhancement Plan. Use it as a tool for discussion and navigation on Dashboard, Provides Information, Performance. This template is free to edit as deemed fit for your organization. Therefore download it now.
-
 Using Bpm Tool To Drive Value For Business Revenues And Customers Overview Kpi Dashboard For Banks
Following slide illustrates revenue and customers overview kip dashboard for banks. KPIs covered in the dashboard are revenue actual vs. target, number of new customers, customer acquisition cost vs. customer lifetime value. Present the topic in a bit more detail with this Using Bpm Tool To Drive Value For Business Revenues And Customers Overview Kpi Dashboard For Banks. Use it as a tool for discussion and navigation on Revenues, Dashboard, Overview. This template is free to edit as deemed fit for your organization. Therefore download it now.
-
 Measuring Business Performance Using Kpis Employee Engagement And Company Culture Dashboard
Following slide shows employee engagement and company culture dashboard. It includes employee details, engagement score, total given recognition, previous seven days performance and radar chart to measure employee performance. Present the topic in a bit more detail with this Measuring Business Performance Using Kpis Employee Engagement And Company Culture Dashboard. Use it as a tool for discussion and navigation on Engagement, Dashboard, Measure . This template is free to edit as deemed fit for your organization. Therefore download it now.
-
 Measuring Business Performance Using Kpis Revenue And Employment Cost Dashboard
Mentioned slide covers revenue and employment cost dashboard. It includes details like full time employee number, total employment cost, total revenue and average revenue per FTE. Present the topic in a bit more detail with this Measuring Business Performance Using Kpis Revenue And Employment Cost Dashboard. Use it as a tool for discussion and navigation on Revenue, Employment, Dashboard. This template is free to edit as deemed fit for your organization. Therefore download it now.
-
 Business Performance Monitoring KPI Dashboard Guide To M And A
Following slide illustrates the KPI dashboard for tracking business performance. KPIS covered in the dashboard are net profit margin, income and expenses, accounts receivable, quick and current ratios. Deliver an outstanding presentation on the topic using this Business Performance Monitoring KPI Dashboard Guide To M And A. Dispense information and present a thorough explanation of Statement, Net Profit Margin, Income And Expenses using the slides given. This template can be altered and personalized to fit your needs. It is also available for immediate download. So grab it now.
-
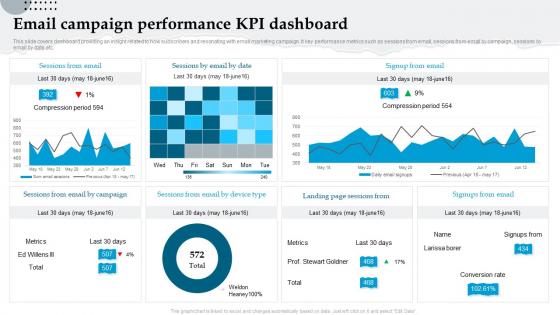 Email Campaign Performance Kpi Dashboard Analyzing And Implementing Management System
This slide covers dashboard providing an insight related to how subscribers and resonating with email marketing campaign. It key performance metrics such as sessions from email, sessions from email by campaign, sessions by email by date etc. Deliver an outstanding presentation on the topic using this Email Campaign Performance Kpi Dashboard Analyzing And Implementing Management System. Dispense information and present a thorough explanation of Performance, Dashboard, Marketing using the slides given. This template can be altered and personalized to fit your needs. It is also available for immediate download. So grab it now.
-
 KPI Metrics Dashboard Highlighting Profitability And Liquidity Ultimate Guide To Financial Planning
The following slide outlines key performance indicator KPI dashboard showcasing various financial metrics of the organization. The key metrics are gross revenue, product revenue, service revenue, gross profit, net profit etc. Present the topic in a bit more detail with this KPI Metrics Dashboard Highlighting Profitability And Liquidity Ultimate Guide To Financial Planning. Use it as a tool for discussion and navigation on Gross Revenue, Gross Profit, Product Revenue. This template is free to edit as deemed fit for your organization. Therefore download it now.
-
 Revenues And Customers Overview KPI Dashboard For Banks Selecting The Suitable BPM Tool For Efficiently
Following slide illustrates revenue and customers overview kpi dashboard for banks. KPIs covered in the dashboard are revenue actual vs. target, number of new customers, customer acquisition cost vs. customer lifetime value.Present the topic in a bit more detail with this Revenues And Customers Overview KPI Dashboard For Banks Selecting The Suitable BPM Tool For Efficiently. Use it as a tool for discussion and navigation on Actual Revenue, Target Revenue, Total Achievement. This template is free to edit as deemed fit for your organization. Therefore download it now.
-
 Revenues And Customers Overview Kpi Dashboard For Banks Improving Business Efficiency Using
Following slide illustrates revenue and customers overview kpi dashboard for banks. Kpis covered in the dashboard are revenue actual vs Target, number of new customers, customer acquisition cost vs Customer lifetime value.Present the topic in a bit more detail with this Revenues And Customers Overview Kpi Dashboard For Banks Improving Business Efficiency Using. Use it as a tool for discussion and navigation on Actual Revenue, Compared Previous, Customers Target. This template is free to edit as deemed fit for your organization. Therefore download it now.
-
 Financial Kpi Dashboard To Evaluate Fundraising Impact Evaluating Debt And Equity
This slide showcases dashboard that can help organization to evaluate key changes in financial kpis post fundraising. Its key components are net profit margin, revenue, gross profit margin, debt to equity and return on equity. Present the topic in a bit more detail with this Financial Kpi Dashboard To Evaluate Fundraising Impact Evaluating Debt And Equity. Use it as a tool for discussion and navigation on Revenue, Gross Profit Margin, Net Profit Margin. This template is free to edit as deemed fit for your organization. Therefore download it now.
-
 Business Performance Monitoring Kpi Dashboard Guide For A Successful M And A Deal
Following slide illustrates the KPI dashboard for tracking business performance. KPIS covered in the dashboard are net profit margin, income and expenses, accounts receivable, quick and current ratios. Present the topic in a bit more detail with this Business Performance Monitoring Kpi Dashboard Guide For A Successful M And A Deal. Use it as a tool for discussion and navigation on Business, Performance, Monitoring. This template is free to edit as deemed fit for your organization. Therefore download it now.
-
 Ecommerce Accounting Management Ecommerce KPI Dashboard With P And L Statement
This slide showcases ecommerce key performance indicators KPI dashboard with financial statement. It provides information about total sales, orders, net profit, net profit margin, average order value, channels, etc. Deliver an outstanding presentation on the topic using this Ecommerce Accounting Management Ecommerce KPI Dashboard With P And L Statement. Dispense information and present a thorough explanation of Sales Price, Warehouse Costs, Sales By Location using the slides given. This template can be altered and personalized to fit your needs. It is also available for immediate download. So grab it now.
-
 KPI Dashboard To Monitor Financial Budget Allocation And Distribution
This slide signifies the key performance indicator dashboard on organisation financial budget distribution within various department. It includes budget allocation, monthly performance, top suppliers etc.Introducing our KPI Dashboard To Monitor Financial Budget Allocation And Distribution set of slides. The topics discussed in these slides are Budget Remaining, Payable Account, Budget Distributed, Budget Allocated. This is an immediately available PowerPoint presentation that can be conveniently customized. Download it and convince your audience.
-
 Ecommerce Kpi Dashboard With P And L Statement How Ecommerce Financial Process Can Be Improved
This slide showcases ecommerce key performance indicators KPI dashboard with financial statement. It provides information about total sales, orders, net profit, net profit margin, average order value, channels, etc. Deliver an outstanding presentation on the topic using this Ecommerce Kpi Dashboard With P And L Statement How Ecommerce Financial Process Can Be Improved. Dispense information and present a thorough explanation of Dashboard, Ecommerce, Statement using the slides given. This template can be altered and personalized to fit your needs. It is also available for immediate download. So grab it now.
-
 Brand Awareness Measuring KPI Dashboard Guide To Build And Measure Brand Value
Following slide illustrates KPI dashboard that can be used to track the awareness level of a specific brand. KPIs covered in the slide are traffic, attention, authority, inbound channel performance etc. Present the topic in a bit more detail with this Brand Awareness Measuring KPI Dashboard Guide To Build And Measure Brand Value. Use it as a tool for discussion and navigation on Brand Awareness, Measuring KPI Dashboard. This template is free to edit as deemed fit for your organization. Therefore download it now.
-
 Financial KPI Dashboard Guide To Build And Measure Brand Value
Mentioned slide showcases KPI dashboard that can be used to check the financial performance of a brand. Metrics covered in the dashboard are return on assets, working capital ratio, return on equity etc. Deliver an outstanding presentation on the topic using this Financial KPI Dashboard Guide To Build And Measure Brand Value. Dispense information and present a thorough explanation of Working Capital Ratio, Return On Assets, Return On Equity using the slides given. This template can be altered and personalized to fit your needs. It is also available for immediate download. So grab it now.
-
 KPI Metrics Dashboard Highlighting Organization Introduction To Corporate Financial Planning And Analysis
The following slide outlines key performance indicator KPI dashboard showcasing various financial metrics of the organization. The key metrics are gross revenue, product revenue, service revenue, gross profit, net profit etc. Deliver an outstanding presentation on the topic using this KPI Metrics Dashboard Highlighting Organization Introduction To Corporate Financial Planning And Analysis. Dispense information and present a thorough explanation of Revenues, Profitability, Liquidity using the slides given. This template can be altered and personalized to fit your needs. It is also available for immediate download. So grab it now.
-
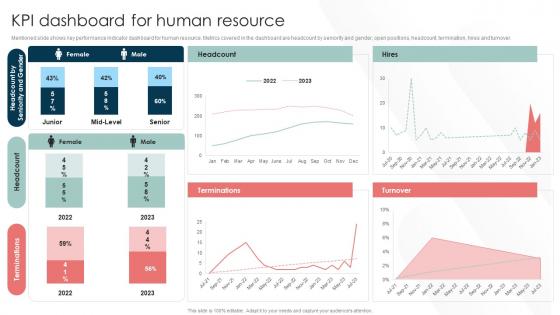 Talent Management And Succession KPI Dashboard For Human Resource Ppt Icon Example Introduction
Mentioned slide shows key performance indicator dashboard for human resource. Metrics covered in the dashboard are headcount by seniority and gender, open positions, headcount, termination, hires and turnover. Deliver an outstanding presentation on the topic using this Talent Management And Succession KPI Dashboard For Human Resource Ppt Icon Example Introduction. Dispense information and present a thorough explanation of Terminations, Headcount, Seniority And Gender using the slides given. This template can be altered and personalized to fit your needs. It is also available for immediate download. So grab it now.
-
 KPI Dashboard To Plan And Effectively Monitor Project Progress
Mentioned slide outlines a key performance indicator KPI dashboard to plan and measure project progress. Information covered in this slide is related to project names, start and end date, progress details, planned vs actual hours, and issues and risks involved. Introducing our KPI Dashboard To Plan And Effectively Monitor Project Progress set of slides. The topics discussed in these slides are KPI Dashboard To Plan, Effectively Monitor, Project Progress. This is an immediately available PowerPoint presentation that can be conveniently customized. Download it and convince your audience.
-
 Dashboards To Track Health And Safety Kpis Implementation Of Safety Management Workplace Injuries
The following slide showcases the dashboard to track health and safety kpis like lost time incidence by gender, incidence frequency rate in last months, incidence by type etc. Present the topic in a bit more detail with this Dashboards To Track Health And Safety Kpis Implementation Of Safety Management Workplace Injuries. Use it as a tool for discussion and navigation on Dashboards, Incidence, Frequency. This template is free to edit as deemed fit for your organization. Therefore download it now.
-
 Monthly Profit And Loss Analysis Dashboard With Cost Breakdown KPI
This slide includes profit and loss analysis dashboard with cost breakdown KPI. The kpis used herein are revenue, COGS, expenditure and net profit. Presenting our well structured Monthly Profit And Loss Analysis Dashboard With Cost Breakdown KPI. The topics discussed in this slide are Revenue Expenditure, Net Profit, Revenue. This is an instantly available PowerPoint presentation that can be edited conveniently. Download it right away and captivate your audience.
-
 Internal Audit KPI Dashboard Snapshot And Status
This slide covers the key performance indicator dashboard snapshot and status for internal audit. It includes information related to the audit status and risk rating. Presenting our well structured Internal Audit KPI Dashboard And Status. The topics discussed in this slide are Auditable Entry, Risk Rating, Corrective Actions. This is an instantly available PowerPoint presentation that can be edited conveniently. Download it right away and captivate your audience.
-
 Call Center Metrics And KPI Dashboard With Tickets Raised
Mentioned slide outlines a KPI dashboard showcasing the call center performance. The metrics covered in the slide are total dropped calls, waiting calls, total calls, team performance, recurring calls, tickets raised. Introducing our Call Center Metrics And KPI Dashboard With Tickets Raised set of slides. The topics discussed in these slides are Management Data, Statical, Team Performance. This is an immediately available PowerPoint presentation that can be conveniently customized. Download it and convince your audience.
-
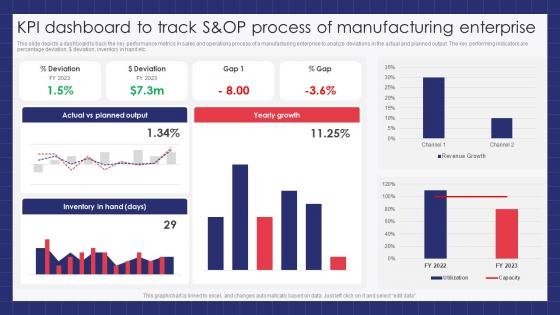 KPI Dashboard To Track S and OP Process Of Manufacturing Enterprise
This slide depicts a dashboard to track the key performance metrics in sales and operations process of a manufacturing enterprise to analyze deviations in the actual and planned output. The key performing indicators are percentage deviation, dollar deviation, inventory in hand etc. Presenting our well structured KPI Dashboard To Track S and OP Process Of Manufacturing Enterprise. The topics discussed in this slide are KPI Dashboard To Track, S and OP Process, Manufacturing Enterprise. This is an instantly available PowerPoint presentation that can be edited conveniently. Download it right away and captivate your audience.


