Powerpoint Templates and Google slides for IT Operations Dashboard
Save Your Time and attract your audience with our fully editable PPT Templates and Slides.
-
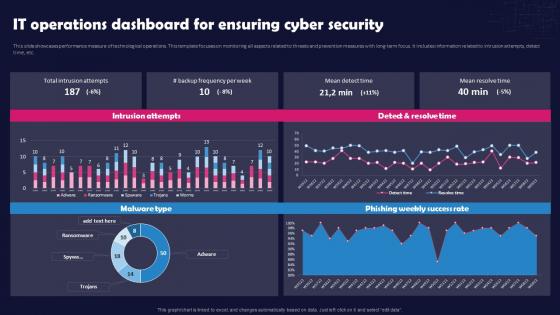 Unlocking The Impact Of Technology It Operations Dashboard For Ensuring Cyber Security
This slide showcases performance measure of technological operations. This template focuses on monitoring all aspects related to threats and prevention measures with long-term focus. It includes information related to intrusion attempts, detect time, etc. Present the topic in a bit more detail with this Unlocking The Impact Of Technology It Operations Dashboard For Ensuring Cyber Security. Use it as a tool for discussion and navigation on IT Operations Dashboard, Ensuring Cyber Security, Threats And Prevention, Technological Operations. This template is free to edit as deemed fit for your organization. Therefore download it now.
-
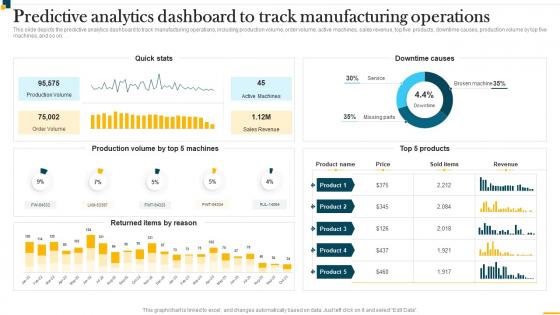 IT In Manufacturing Industry V2 Predictive Analytics Dashboard To Track Manufacturing Operations
This slide depicts the predictive analytics dashboard to track manufacturing operations, including production volume, order volume, active machines, sales revenue, top five products, downtime causes, production volume by top five machines, and so on. Present the topic in a bit more detail with this IT In Manufacturing Industry V2 Predictive Analytics Dashboard To Track Manufacturing Operations. Use it as a tool for discussion and navigation on Predictive Analytics Dashboard, Track Manufacturing Operations, Production Volume. This template is free to edit as deemed fit for your organization. Therefore download it now.
-
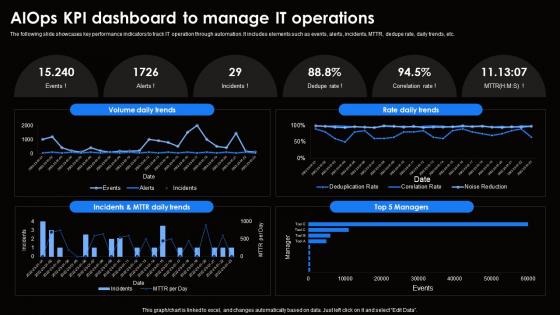 AIOps Kpi Dashboard To Manage It Ai For Effective It Operations Management AI SS V
The following slide showcases key performance indicators to track IT operation through automation. It includes elements such as events, alerts, incidents, MTTR, dedupe rate, daily trends, etc.Present the topic in a bit more detail with this AIOps Kpi Dashboard To Manage It Ai For Effective It Operations Management AI SS V. Use it as a tool for discussion and navigation on Volume Daily Trends, Rate Daily Trends, Daily Trends. This template is free to edit as deemed fit for your organization. Therefore download it now.
-
 Aiops Kpi Dashboard To Manage It Operations Introduction To Aiops AI SS V
The following slide showcases key performance indicators to track IT operation through automation. It includes elements such as events, alerts, incidents, MTTR, dedupe rate, daily trends, etc. Deliver an outstanding presentation on the topic using this Aiops Kpi Dashboard To Manage It Operations Introduction To Aiops AI SS V. Dispense information and present a thorough explanation of Volume Daily Trends, Rate Daily Trends using the slides given. This template can be altered and personalized to fit your needs. It is also available for immediate download. So grab it now.
-
 AIOps Kpi Dashboard To Manage It Operations Comprehensive Guide To Begin AI SS V
The following slide showcases key performance indicators to track IT operation through automation. It includes elements such as events, alerts, incidents, MTTR, dedupe rate, daily trends, etc.Deliver an outstanding presentation on the topic using this AIOps Kpi Dashboard To Manage It Operations Comprehensive Guide To Begin AI SS V. Dispense information and present a thorough explanation of Correlation Rate, Volume Daily Trends, Daily Trends using the slides given. This template can be altered and personalized to fit your needs. It is also available for immediate download. So grab it now.
-
 AIOps Kpi Dashboard To Manage IT Operations IT Operations Automation An AIOps AI SS V
The following slide showcases key performance indicators to track IT operation through automation. It includes elements such as events, alerts, incidents, MTTR, dedupe rate, daily trends, etc.Deliver an outstanding presentation on the topic using this AIOps Kpi Dashboard To Manage IT Operations IT Operations Automation An AIOps AI SS V. Dispense information and present a thorough explanation of Volume Daily Trends, Rate Daily Trends, Incidents Trends using the slides given. This template can be altered and personalized to fit your needs. It is also available for immediate download. So grab it now.
-
 Application Health Monitoring Kpi Dashboard IT Operations Automation An AIOps AI SS V
The following slide showcases key performance indicators to monitor app performance and improve user experience. It includes elements such as problems, hosts, services, database, response time, transactions, etc.Deliver an outstanding presentation on the topic using this Application Health Monitoring Kpi Dashboard IT Operations Automation An AIOps AI SS V. Dispense information and present a thorough explanation of Quick Overview, Cloud Infrastructure, Application Health using the slides given. This template can be altered and personalized to fit your needs. It is also available for immediate download. So grab it now.
-
 KPI Dashboard To Manage Incidents And IT Operations Automation An AIOps AI SS V
The following slide showcases key performance indicators to review incidents and alerts. It includes elements such as noise reduction, auto remediation, alert heat map, noise trend, etc.Present the topic in a bit more detail with this KPI Dashboard To Manage Incidents And IT Operations Automation An AIOps AI SS V. Use it as a tool for discussion and navigation on Auto Remediation, Incidents Trend, Noise Reduction. This template is free to edit as deemed fit for your organization. Therefore download it now.
-
 IT Cybersecurity Operation Reporting Dashboard
This slide depicts the reporting dashboard to track companys IT and cybersecurity measures. The purpose of this slide is to help the business safeguard its networks through the analysis of its current measures. It includes elements such as intrusion attempts, mean detection time, etc. Introducing our IT Cybersecurity Operation Reporting Dashboard set of slides. The topics discussed in these slides are Cyber Security, Advanced, Average Resolution Time. This is an immediately available PowerPoint presentation that can be conveniently customized. Download it and convince your audience.
-
 Artificial intelligence for IT operations dashboard snapshot ppt introduction
This slide shows the dashboard for AIOps that covers the details of Cloud DevOps team performance, including the total number of currently assigned situations, acknowledged, resolved, and the number of recent comments. Present the topic in a bit more detail with this artificial intelligence for IT operations dashboard snapshot ppt introduction. Use it as a tool for discussion and navigation on Assigned Situations, Acknowledged Situations, Resolved Situations. This template is free to edit as deemed fit for your organization. Therefore download it now.
-
 IT Operations Dashboard For Project Management
This slide focuses on dashboard that provides information about the information technology operations for managing IT project which covers the investments, billed amount, time taken to complete the project, customer satisfaction, monthly expenses, service level agreement status, etc. Presenting our well structured IT Operations Dashboard For Project Management. The topics discussed in this slide are IT Operations Dashboard, For Project Management. This is an instantly available PowerPoint presentation that can be edited conveniently. Download it right away and captivate your audience.
-
 IT Department Operational Issues Analytics Dashboard
This slide represents the dashboard showing operational analysis of issues faced by the IT team of the organization. It shows data related to uptime and downtime of servers, downtime issues, IT support employee per thousand end user over time etc. Introducing our IT Department Operational Issues Analytics Dashboard set of slides. The topics discussed in these slides are Support Employee, Downtime Server, Count Percentage. This is an immediately available PowerPoint presentation that can be conveniently customized. Download it and convince your audience.
-
 IT Operational Analytics With Tickets Management Dashboard
This slide represents the dashboard showing analysis report of tickets management by the IT support service team. It shows details related to no. of support requests, average hours spent to resolve issues, support status, total resolved and unresolved tickets by month etc. Introducing our IT Operational Analytics With Tickets Management Dashboard set of slides. The topics discussed in these slides are Resolve Issue, Ticket Resolved, Support Status. This is an immediately available PowerPoint presentation that can be conveniently customized. Download it and convince your audience.
-
 IT Project Change Management Operations Analytics Dashboard
This slide shows the dashboard representing the operational analysis related to change management of an IT project. It shows details related to top requesting groups, outstanding change requests, outstanding age breakdown etc. Presenting our well structured IT Project Change Management Operations Analytics Dashboard. The topics discussed in this slide are Untheorized Change, Outstanding Requests, Monthly Breakdown. This is an instantly available PowerPoint presentation that can be edited conveniently. Download it right away and captivate your audience.
-
 IT Project Operational Analytics And Performance Dashboard
This slide represents the dashboard showing the operational analysis of an IT project. It includes details related to bugs status, planned vs completed work items, work item type by priority, active bugs by severity, sprint velocity and analysis by assignee. Introducing our IT Project Operational Analytics And Performance Dashboard set of slides. The topics discussed in these slides are Work Item Type, Active Bugs Severity, Sprint Velocity. This is an immediately available PowerPoint presentation that can be conveniently customized. Download it and convince your audience.
-
 IT Software Development Project Operational Analytics Dashboard
This slide represents the dashboard showing the operational analysis of the software development project undertaken by the IT team. It shows details related to overall progress, planning, design, development, testing, risks, budget, overdue tasks etc. related to the project. Presenting our well structured IT Software Development Project Operational Analytics Dashboard. The topics discussed in this slide are Overdue Tasks, Upcoming Deadlines, Project Budget. This is an instantly available PowerPoint presentation that can be edited conveniently. Download it right away and captivate your audience.
-
 IT Team Project Operational Analytics Dashboard
This slide represents the dashboard showing the operational analysis of the team project of the IT department. It shows details related to investment, billed amount, completion of project, revenue by month, total days spent on project completion, customer satisfaction etc. Introducing our IT Team Project Operational Analytics Dashboard set of slides. The topics discussed in these slides are Complete Each Project, Customer Satisfaction, Monthly Expenses. This is an immediately available PowerPoint presentation that can be conveniently customized. Download it and convince your audience.
-
 Dashboard For IT Operations Data Analysis
This slide exhibits IT operations dashboard. It covers number of cases, weekly open and close cases, open case status, case priority by divisions, time distribution of tickets. Introducing our Dashboard For IT Operations Data Analysis set of slides. The topics discussed in these slides are Case Priority, Distribution Of Tickets, Open Case Status. This is an immediately available PowerPoint presentation that can be conveniently customized. Download it and convince your audience.
-
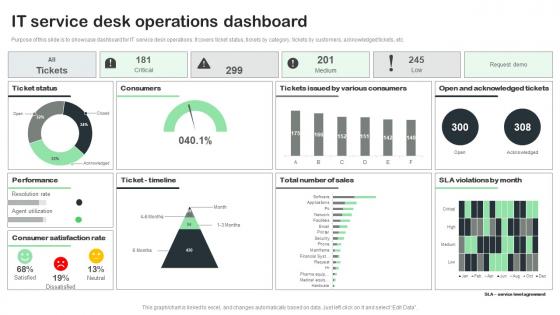 IT Service Desk Operations Dashboard
Purpose of this slide is to showcase dashboard for IT service desk operations. It covers ticket status, tickets by category, tickets by customers, acknowledged tickets, etc. Presenting our well structured IT Service Desk Operations Dashboard. The topics discussed in this slide are Ticket Status, Consumers, Performance, Consumer Satisfaction Rate. This is an instantly available PowerPoint presentation that can be edited conveniently. Download it right away and captivate your audience.
-
 IT Operations Dashboard For Issues Management
The slide illustrates various KPIs to manage and track IT operations in business. Various elements included in the dashboard are month wise issue status, types of issues, average resolution time, overall status and resolved issues. Introducing our IT Operations Dashboard For Issues Management set of slides. The topics discussed in these slides are Overall Status, Resolved Issues, Resolution Time. This is an immediately available PowerPoint presentation that can be conveniently customized. Download it and convince your audience.
-
 AIOPS Dashboard To Monitor It Operations Implementing Artificial Intelligence In It Process
The following slide highlights the various key performance indicators of the AIOp, these can be problem quick review, cloud and infrastructure and applications health.Present the topic in a bit more detail with this AIOPS Dashboard To Monitor It Operations Implementing Artificial Intelligence In It Process. Use it as a tool for discussion and navigation on Cloud Infrastructure, Demo Environment, Smartscape. This template is free to edit as deemed fit for your organization. Therefore download it now.
-
 AIOps Dashboard To Monitor IT Operations Artificial Intelligence In IT Operations
The following slide highlights the various key performance indicators of the AIOp, these can be problem quick review, cloud and infrastructure and applications health. Present the topic in a bit more detail with this AIOps Dashboard To Monitor IT Operations Artificial Intelligence In IT Operations. Use it as a tool for discussion and navigation on Cloud And Infrastructure, Quick Overview, Application Health. This template is free to edit as deemed fit for your organization. Therefore download it now.
-
 Customer Service Dashboard Through Ai Artificial Intelligence In IT Operations
The following slide highlights the customer service dashboard that shows the use of AI in customer satisfaction. Deliver an outstanding presentation on the topic using this Customer Service Dashboard Through Ai Artificial Intelligence In IT Operations. Dispense information and present a thorough explanation of Customer Service, Dashboard, Through AI using the slides given. This template can be altered and personalized to fit your needs. It is also available for immediate download. So grab it now.
-
 AIOps Industry Report AIOps Dashboard To Monitor IT Operations Ppt Microsoft
The following slide highlights the various key performance indicators of the AIOp, these can be problem quick review, cloud and infrastructure and applications health. Present the topic in a bit more detail with this AIOps Industry Report AIOps Dashboard To Monitor IT Operations Ppt Microsoft. Use it as a tool for discussion and navigation on Quick Overview, Cloud And Infrastructure, Application Health. This template is free to edit as deemed fit for your organization. Therefore download it now.
-
 AIOps Dashboard To Monitor It Operations Operational Strategy For Machine Learning
The following slide highlights the various key performance indicators of the AIOps, these can be problem quick review, cloud and infrastructure and applications health. Present the topic in a bit more detail with this AIOps Dashboard To Monitor It Operations Operational Strategy For Machine Learning. Use it as a tool for discussion and navigation on Quick Overview, Application Health, User Experience. This template is free to edit as deemed fit for your organization. Therefore download it now.
-
 AIOps Dashboard To Monitor Industry Report AI Implementation In IT Operations
The following slide highlights the various key performance indicators of the AIOp, these can be problem quick review, cloud and infrastructure and applications health. Present the topic in a bit more detail with this AIOps Dashboard To Monitor Industry Report AI Implementation In IT Operations. Use it as a tool for discussion and navigation on Quick Overview, Application Health, User Experience. This template is free to edit as deemed fit for your organization. Therefore download it now.
-
 IT In Manufacturing Industry Predictive Analytics Dashboard To Track Manufacturing Operations
This slide depicts the predictive analytics dashboard to track manufacturing operations, including production volume, order volume, active machines, sales revenue, top five products, downtime causes, production volume by top five machines, and so on. Deliver an outstanding presentation on the topic using this IT In Manufacturing Industry Predictive Analytics Dashboard To Track Manufacturing Operations. Dispense information and present a thorough explanation of Sales Revenue, Production Volume, Revenue using the slides given. This template can be altered and personalized to fit your needs. It is also available for immediate download. So grab it now.
-
 AIOps Dashboard To Monitor It Operations Management With Machine Learning
The following slide highlights the various key performance indicators of the AIOp, these can be problem quick review, cloud and infrastructure and applications health. Present the topic in a bit more detail with this AIOps Dashboard To Monitor It Operations Management With Machine Learning. Use it as a tool for discussion and navigation on Website, Applications, Services. This template is free to edit as deemed fit for your organization. Therefore download it now.
-
 Customer Service Dashboard Through Ai It Operations Management With Machine Learning
The following slide highlights the customer service dashboard that shows the use of AI in customer satisfaction. Deliver an outstanding presentation on the topic using this Customer Service Dashboard Through Ai It Operations Management With Machine Learning. Dispense information and present a thorough explanation of Total Case Breakdown, Case Priority, Case Tracking using the slides given. This template can be altered and personalized to fit your needs. It is also available for immediate download. So grab it now.
-
 Application IT Operation Performance Monitoring Dashboard
The slide highlights operational dashboard that helps to control operational activity and ensure that core processes are completed in time effective manner. The key metrices include HTTP status codes, response time percentiles, HTTP methods, etc. Presenting our well structured Application IT Operation Performance Monitoring Dashboard. The topics discussed in this slide are Response Time Breakdown, Requests Per Second, Monitoring Dashboard. This is an instantly available PowerPoint presentation that can be edited conveniently. Download it right away and captivate your audience.
-
 IT Operation Monitoring Dashboard For Immediate Response
This slide covers dashboard of IT operations to monitor the issues in the central database. It enables team members to identify, implement, and track solutions. The key Elements are issue type, issue category, Issue status. Presenting our well structured IT Operation Monitoring Dashboard For Immediate Response. The topics discussed in this slide are Support Status, Operation Monitoring, Immediate Response. This is an instantly available PowerPoint presentation that can be edited conveniently. Download it right away and captivate your audience.
-
 BI Dashboard For IT Operations In Organization
This slide showcases business intelligence dashboard to track various aspects of IT functions, security issues and technology costs. It further includes metrics such as applications by spend, clusters, cloud accounts, cost, efficiency score, etc. Introducing our BI Dashboard For IT Operations In Organization set of slides. The topics discussed in these slides are Clusters Cost, Cloud Cost, Cost Breakdown. This is an immediately available PowerPoint presentation that can be conveniently customized. Download it and convince your audience.
-
 Customer Service Dashboard Through Ai Artificial Intelligence It Infrastructure Operations
The following slide highlights the customer service dashboard that shows the use of AI in customer satisfaction.Present the topic in a bit more detail with this Customer Service Dashboard Through Ai Artificial Intelligence It Infrastructure Operations. Use it as a tool for discussion and navigation on Total Cases, Resolutions, Escalations. This template is free to edit as deemed fit for your organization. Therefore download it now.
-
 IoT In Manufacturing IT Predictive Analytics Dashboard To Track Manufacturing Operations
This slide depicts the predictive analytics dashboard to track manufacturing operations, including production volume, order volume, active machines, sales revenue, top five products, downtime causes, production volume by top five machines, and so on. Present the topic in a bit more detail with this IoT In Manufacturing IT Predictive Analytics Dashboard To Track Manufacturing Operations. Use it as a tool for discussion and navigation on Analytics, Manufacturing, Operations. This template is free to edit as deemed fit for your organization. Therefore download it now.
-
 Artificial Intelligence IT Infrastructure AIOps Dashboard To Monitor It Operations
The following slide highlights the various key performance indicators of the AIOp, these can be problem quick review, cloud and infrastructure and applications health.Present the topic in a bit more detail with this Artificial Intelligence IT Infrastructure AIOps Dashboard To Monitor It Operations. Use it as a tool for discussion and navigation on Quick Overview, Cloud Infrastructure, Application Health. This template is free to edit as deemed fit for your organization. Therefore download it now.
-
 Dashboard To Track Post Bpm It Customer Service Operations Bpm Lifecycle Implementation Process
This slide covers dashboard to record system generated customer service requests in an organization. It includes elements such as average response time, ticket volume, resolution time, ticket backlogs, net promoter score, CSAT score, employee wise ticket resolved, etc.Deliver an outstanding presentation on the topic using this Dashboard To Track Post Bpm It Customer Service Operations Bpm Lifecycle Implementation Process. Dispense information and present a thorough explanation of Average Response, Ticket Volume, Contract Value using the slides given. This template can be altered and personalized to fit your needs. It is also available for immediate download. So grab it now.
-
 It application and managed services dashboard operating systems ppt powerpoint presentation
Presenting this set of slides with name It Application And Managed Services Dashboard Operating Systems Ppt Powerpoint Presentation. The topics discussed in these slides are Application Whitelisting, Patch Applications, Patch Operating Systems, Restrict Admin Privileges, Disable Untrusted Microsoft Office Macros . This is a completely editable PowerPoint presentation and is available for immediate download. Download now and impress your audience.
-
 It application and managed services dashboard patch operating systems powerpoint slides
This slide is covering its applications and services KPIs such as multi-factor authentication, daily backup of important data and user application handling. Presenting this set of slides with name It Application And Managed Services Dashboard Patch Operating Systems Powerpoint Slides. The topics discussed in these slides are It Application, Managed Services, Dashboard Patch, Operating Systems. This is a completely editable PowerPoint presentation and is available for immediate download. Download now and impress your audience.
-
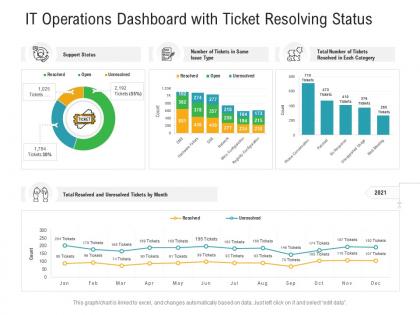 It operations dashboard with ticket resolving status
Presenting our well-structured It Operations Dashboard With Ticket Resolving Status. The topics discussed in this slide are Support Status, Number Of Tickets In Same Issue Type, Total Number Of Tickets Resolved In Each Category. This is an instantly available PowerPoint presentation that can be edited conveniently. Download it right away and captivate your audience.
-
 It security operations dashboard ppt powerpoint presentation summary
Present the topic in a bit more detail with this IT Security Operations Dashboard Ppt Powerpoint Presentation Summary. Use it as a tool for discussion and navigation on Dashboard. This template is free to edit as deemed fit for your organization. Therefore download it now.
-
 It security operations determine security risks dashboard ppt powerpoint summary themes
This slide provides information regarding the dashboard which is used to track and monitor various security risks and threats identified. Present the topic in a bit more detail with this IT Security Operations Determine Security Risks Dashboard Ppt Powerpoint Summary Themes. Use it as a tool for discussion and navigation on Moderate Inherent Risk, High Inherent Risk, Very High Inherent Risk. This template is free to edit as deemed fit for your organization. Therefore download it now.
-
 It security operations secops dashboard to track vulnerabilities ppt powerpoint gallery outfit
This slide provides information regarding the SecOps dashboard which is used to track and monitor various vulnerabilities identified. Present the topic in a bit more detail with this IT Security Operations Secops Dashboard To Track Vulnerabilities Ppt Powerpoint Gallery Outfit. Use it as a tool for discussion and navigation on Assets, Vulnerabilities, Severity. This template is free to edit as deemed fit for your organization. Therefore download it now.
-
 Infrastructure kpi dashboard showing project revenue it operations management ppt styles format
Present the topic in a bit more detail with this Infrastructure KPI Dashboard Showing Project Revenue IT Operations Management Ppt Styles Format. Use it as a tool for discussion and navigation on Household, Textiles, Plastic, Rubble, Paper, Asphalt. This template is free to edit as deemed fit for your organization. Therefore download it now.
-
 Infrastructure kpi dashboard showing resource allocation it operations management ppt ideas
Deliver an outstanding presentation on the topic using this Infrastructure KPI Dashboard Showing Resource Allocation IT Operations Management Ppt Ideas. Dispense information and present a thorough explanation of Days Per Project, Project Financial, Resource Allocation, Delivery Timeline And Resources using the slides given. This template can be altered and personalized to fit your needs. It is also available for immediate download. So grab it now.


