Powerpoint Templates and Google slides for Indica
Save Your Time and attract your audience with our fully editable PPT Templates and Slides.
-
 Team Management Dashboard Indicating Agreement Details
This slide illustrates team management dashboard indicating agreement details which contains annual value, suppliers, types, renewals, categories, etc.Introducing our premium set of slides with Team Management Dashboard Indicating Agreement Details. Ellicudate the one stage and present information using this PPT slide. This is a completely adaptable PowerPoint template design that can be used to interpret topics like Agreement Focus, Management Consulting, Agreement Renewal. So download instantly and tailor it with your information.
-
 Stock Market Dashboard Indicating Candlestick Time Series
Following slide showcase stock market KPI dashboard which will assist company to understand stock performance. It provides information about open, close, highest and lowest price of stock on particular day, candlestick time series etc. Introducing our Stock Market Dashboard Indicating Candlestick Time Series set of slides. The topics discussed in these slides are Candlestick Time Series, IBM. This is an immediately available PowerPoint presentation that can be conveniently customized. Download it and convince your audience.
-
 Share Market Dashboard Indicating Candlestick Time Series
Following slide showcase stock market KPI dashboard which will assist company to understand stock performance. It provides information about open, close, highest and lowest price of stock on particular day, candlestick time series etc. Introducing our Share Market Dashboard Indicating Candlestick Time Series set of slides. The topics discussed in these slides are Stock Change, Candlestick Time Series. This is an immediately available PowerPoint presentation that can be conveniently customized. Download it and convince your audience.
-
 Product Launch And Promotional Sales By Lead Source Performance Indicator
Present the topic in a bit more detail with this Product Launch And Promotional Sales By Lead Source Performance Indicator. Use it as a tool for discussion and navigation on Referral Marketing, Social Media Marketing, Email Marketing. This template is free to edit as deemed fit for your organization. Therefore download it now.
-
 Global Supply Planning For E Commerce Supplier Planning Dashboard Indicating
This slide showcases the supplier planning dashboard which includes the fleet status, delivery status, profit by county, average delivery time with average loading time. Present the topic in a bit more detail with this Global Supply Planning For E Commerce Supplier Planning Dashboard Indicating. Use it as a tool for discussion and navigation on Revenue, Supplier Planning, Dashboard Indicating. This template is free to edit as deemed fit for your organization. Therefore download it now.
-
 Call Center Process Key Performance Indicator Dashboard
This slide showcases call center process measurements and key performance indicators so managers and teams can keep track of and improve performance . It includes received calls, calculating speed of answering calls , ended calls before starting conversations , average calls per minute etc. Presenting our well structured Call Center Process Key Performance Indicator Dashboard. The topics discussed in this slide are Agents, Conversation, Calculated Speed. This is an instantly available PowerPoint presentation that can be edited conveniently. Download it right away and captivate your audience.
-
 Overview Of Quarterly Financial Indicators Performance
This slide presents the result variance of different key financials between two quarters of a organization. It includes revenue, gross margin, operating profit, operating margin quarterly performance variation. Presenting our well structured Overview Of Quarterly Financial Indicators Performance. The topics discussed in this slide are Overview Of Quarterly, Financial Indicators Performance. This is an instantly available PowerPoint presentation that can be edited conveniently. Download it right away and captivate your audience.
-
 Digital Transformation Agenda And Key Performance Indicators
The slide shows a pie chart presenting objectives of conducting digital advancement in organization with KPIs. It includes KPIs like user satisfaction, economic, productive, trader control metrics, risk metrics, saving goals and advancements. Presenting our well structured Digital Transformation Agenda And Key Performance Indicators. The topics discussed in this slide are Transformation, Performance, Satisfaction. This is an instantly available PowerPoint presentation that can be edited conveniently. Download it right away and captivate your audience.
-
 Comparative Analysis Of Product Demand Indicating Customer Willingness To Pay
This slide graphically provides information about customer willingness to pay for different products of the headphone-producing company. It includes products, percentage of willingness to pay, and key insights. Presenting our well structured Comparative Analysis Of Product Demand Indicating Customer Willingness To Pay. The topics discussed in this slide are Product Demand Indicating, Customer Willingness. This is an instantly available PowerPoint presentation that can be edited conveniently. Download it right away and captivate your audience.
-
 Graph Indicating Increase In Overall Implementation Of Cost Efficiency Methods For Increasing Business
The slide highlights the lack of cost efficiency in the company that leads to increase in overall business expenses. It includes comparison of previous year costs to evaluate the rise in total business expenditure. Present the topic in a bit more detail with this Graph Indicating Increase In Overall Implementation Of Cost Efficiency Methods For Increasing Business. Use it as a tool for discussion and navigation on Business Costs. This template is free to edit as deemed fit for your organization. Therefore download it now.
-
 Current Key Account Management Performance Indicators Ppt Icon Designs Download
The following slide provides information about the current key account management KPIs of the company which are shown in the form of graphs and for the past 5 years. The KPIs are key account satisfaction rate, key account interaction rate, key account churn rate and key account upsell rate. Present the topic in a bit more detail with this Current Key Account Management Performance Indicators Ppt Icon Designs Download. Use it as a tool for discussion and navigation on Current Key Account, Management, Performance Indicators. This template is free to edit as deemed fit for your organization. Therefore download it now.
-
 Addressing Performance Indicators To Determine Security Strategic Organizational Security Plan
This slide provides information about performance indicators in order to determine security standards at workplace in terms of incidents, offender management, risk assessments. Deliver an outstanding presentation on the topic using this Addressing Performance Indicators To Determine Security Strategic Organizational Security Plan. Dispense information and present a thorough explanation of Incidents, Offender Management, Risk Assessments using the slides given. This template can be altered and personalized to fit your needs. It is also available for immediate download. So grab it now.
-
 Major Performance Indicators For Order To Cash Flow Process
This slide showcases various performance indicators for order to cash flow process which help recognize performance and overall customer experience. It provides information about KPIs such as cyclic time, information sales, full time equivalent employees, on time delivery and total cost. Introducing our Major Performance Indicators For Order To Cash Flow Process set of slides. The topics discussed in these slides are Major Performance, Indicators For Order, Cash Flow Process, Growth Opportunities. This is an immediately available PowerPoint presentation that can be conveniently customized. Download it and convince your audience.
-
 Guide For Effective Event Marketing Sales By Lead Source Performance Indicator
Deliver an outstanding presentation on the topic using this Guide For Effective Event Marketing Sales By Lead Source Performance Indicator. Dispense information and present a thorough explanation of SEO Marketing, Referral Marketing, Social Media Marketing using the slides given. This template can be altered and personalized to fit your needs. It is also available for immediate download. So grab it now.
-
 Supplier Planning Dashboard Indicating Supply Chain Management And Advanced Planning
This slide showcases the supplier planning dashboard which includes the fleet status, delivery status, profit by county, average delivery time with average loading time.Deliver an outstanding presentation on the topic using this Supplier Planning Dashboard Indicating Supply Chain Management And Advanced Planning. Dispense information and present a thorough explanation of Maintenance, Delivery Time, Fleet Efficiency using the slides given. This template can be altered and personalized to fit your needs. It is also available for immediate download. So grab it now.
-
 Water Sustainability Graph With Key Indicators
The following slide showcases formulation of for water maintenance index which helps to meet present needs without compromising ability of future needs. It presents information related to water stress, withdrawal etc. Presenting our well structured Water Sustainability Graph With Key Indicators. The topics discussed in this slide are Water Sustainability Graph, Key Indicators. This is an instantly available PowerPoint presentation that can be edited conveniently. Download it right away and captivate your audience.
-
 Supplier Planning Dashboard Indicating Fleet Status Supply Chain Planning And Management
This slide showcases the supplier planning dashboard which includes the fleet status, delivery status, profit by county, average delivery time with average loading time. Deliver an outstanding presentation on the topic using this Supplier Planning Dashboard Indicating Fleet Status Supply Chain Planning And Management. Dispense information and present a thorough explanation of Revenue, Shipments, Supplier Planning using the slides given. This template can be altered and personalized to fit your needs. It is also available for immediate download. So grab it now.
-
 Sales By Lead Source Performance Indicator Event Advertising Via Social Media Channels MKT SS V
Present the topic in a bit more detail with this Sales By Lead Source Performance Indicator Event Advertising Via Social Media Channels MKT SS V Use it as a tool for discussion and navigation on SEO Marketing, Offline Marketing, Referral Marketing This template is free to edit as deemed fit for your organization. Therefore download it now.
-
 Analyzing Major Performance Indicators Post Extension Strategies Apple Brand Extension
This slide showcases analyzing major performance indicators which can help branding managers to assess extension strategy KPIs. It provides details about market share, product line, launch, variants, color, size, net promotor score NPS, etc. Deliver an outstanding presentation on the topic using this Analyzing Major Performance Indicators Post Extension Strategies Apple Brand Extension. Dispense information and present a thorough explanation of Amongst Competitors, Extension Strategies, Increased Sales using the slides given. This template can be altered and personalized to fit your needs. It is also available for immediate download. So grab it now.
-
 Sales By Lead Source Performance Indicator Engaging Audience Through Virtual Event Marketing MKT SS V
Deliver an outstanding presentation on the topic using this Sales By Lead Source Performance Indicator Engaging Audience Through Virtual Event Marketing MKT SS V. Dispense information and present a thorough explanation of Sales, Source, Performance using the slides given. This template can be altered and personalized to fit your needs. It is also available for immediate download. So grab it now.
-
 Customer Self Service Dashboard With Key Performance Indicators
The following slide highlights key performance indicators dashboard for customer self service. It includes elements such as tickets raised, tickets opened, tickets solved, average reply time, tagged safety, customer satisfaction, recent tweets, follower count etc. Introducing our Customer Self Service Dashboard With Key Performance Indicators set of slides. The topics discussed in these slides are Raised Today, Daily Tickets. This is an immediately available PowerPoint presentation that can be conveniently customized. Download it and convince your audience.
-
 Key Performance Indicators Highlighting Current Problems Software Deployment Plan
This slide represents the key performance indicators to track the problems faced by organization and draw effective strategies to tackle the problems. It includes key performance indicators of decline in organizational sales and customer engagement rate. Present the topic in a bit more detail with this Key Performance Indicators Highlighting Current Problems Software Deployment Plan. Use it as a tool for discussion and navigation on Organizational, Customer Engagement. This template is free to edit as deemed fit for your organization. Therefore download it now.
-
 Elearning Key Performance Indicator Dashboard
This slide showcases the eLearning dashboard measuring whether learning activities are effective can also aid in finding areas of opportunity to boost the likelihood of meeting these business level KPI objectives. It also includes pass rate, the total number of users, location, etc. Introducing our Elearning Key Performance Indicator Dashboard set of slides. The topics discussed in these slides are Daily Activities, Global Trends. This is an immediately available PowerPoint presentation that can be conveniently customized. Download it and convince your audience.
-
 Learning Analytics Key Performance Indicator Dashboard
This slide showcases a learning analytics dashboard useful in optimizing the learning process. It also includes key indicators such as the number of enrolled students, average marks scored, etc. Introducing our Learning Analytics Key Performance Indicator Dashboard set of slides. The topics discussed in these slides are Students Performance, Comparing Scores . This is an immediately available PowerPoint presentation that can be conveniently customized. Download it and convince your audience.
-
 Sales By Lead Source Performance Indicator Social Media Marketing To Increase MKT SS V
Deliver an outstanding presentation on the topic using this Sales By Lead Source Performance Indicator Social Media Marketing To Increase MKT SS V. Dispense information and present a thorough explanation of SEO Marketing, Offline Marketing, Social Media Marketing, Email Marketing using the slides given. This template can be altered and personalized to fit your needs. It is also available for immediate download. So grab it now.
-
 Graph Indicating Increase In Overall Business Costs Key Strategies For Improving Cost Efficiency
The slide highlights the lack of cost efficiency in the company that leads to increase in overall business expenses. It includes comparison of previous year costs to evaluate the rise in total business expenditure. Present the topic in a bit more detail with this Graph Indicating Increase In Overall Business Costs Key Strategies For Improving Cost Efficiency. Use it as a tool for discussion and navigation on Graph Indicating Increase, Overall Business Costs This template is free to edit as deemed fit for your organization. Therefore download it now.
-
 Ad Campaign Performance Indicators Tracking Comprehensive Guide To Linkedln Marketing Campaign MKT SS
This slide covers dashboard to measure the performance of ad campaigns on LinkedIn platform. The purpose of this template is to provide the company an overview on the outcomes of running ad campaigns on LinkedIn. It includes performance based on impressions, CTR, engagement rates, CPC, CPM, etc. Present the topic in a bit more detail with this Ad Campaign Performance Indicators Tracking Comprehensive Guide To Linkedln Marketing Campaign MKT SS. Use it as a tool for discussion and navigation on Performance, Dashboard, Engagement This template is free to edit as deemed fit for your organization. Therefore download it now.
-
 Sales By Lead Source Performance Indicator Techniques To Create Successful Event MKT SS V
Present the topic in a bit more detail with this Sales By Lead Source Performance Indicator Techniques To Create Successful Event MKT SS V. Use it as a tool for discussion and navigation on Offline Marketing, Referral Marketing, Social Media Marketing, Email Marketing This template is free to edit as deemed fit for your organization. Therefore download it now.
-
 IoT Technologies For Logistics Vehicle Maintenance Dashboard Indicating Trips And Compliances
This slide showcases dashboard which can help fleet managers in carefully monitoring their vehicle status. It provides details about vehicle conditions, free vehicles, moving vehicles, insurance, permit, license validity, trip alerts, etc. Present the topic in a bit more detail with this IoT Technologies For Logistics Vehicle Maintenance Dashboard Indicating Trips And Compliances. Use it as a tool for discussion and navigation on Vehicle Maintenance, Dashboard Indicating, Trips And Compliances. This template is free to edit as deemed fit for your organization. Therefore download it now.
-
 Key Performance Indicator Dashboard Of Centralized CRM
This slide shows various key performance indicator of customer relationship management dashboard to monitor various function of business. This includes sales action , response rate etc. Introducing our Key Performance Indicator Dashboard Of Centralized CRM set of slides. The topics discussed in these slides are Sales Action, Value By Lead Source. This is an immediately available PowerPoint presentation that can be conveniently customized. Download it and convince your audience.
-
 Recruitment Funnel Dashboard Indicating Multiple Stages Digital Recruitment For Efficient
This slide showcases recruitment funnel dashboard which helps recruiters access multiple stages of hiring. It provides details about applied, evaluation, review, interview, offer acceptance, etc. Present the topic in a bit more detail with this Recruitment Funnel Dashboard Indicating Multiple Stages Digital Recruitment For Efficient Use it as a tool for discussion and navigation on Recruitment Funnel, Age Of Applications This template is free to edit as deemed fit for your organization. Therefore download it now.
-
 Gq tablet with business progress design indication powerpoint template
Presenting gq tablet with business progress design indication powerpoint template. This Power Point template diagram has been crafted with graphic of tablet and business progress chart. This PPT diagram contains the concept of business progress indication. Use this PPT diagram for business and marketing related presentations.
-
 Three staged business team network indication diagram powerpoint template slide
Well Adapted to all software for smooth running. Effortless conversion to JPG and PDF. Well compatible with Google slides. Easy widescreen viewing without PPT graphics pixilation. Attach company logo, name and trademark lucidly. Greatly customizable layout including font, text, color and design. High resolution PPT graphics for improved clarity. Applicable to business, project management, NGO’s. Strategic organization and education sector.
-
 Three circular rings for business process indication powerpoint template slide
We are proud to present our three circular rings for business process indication powerpoint template slide. Graphic of three circular rings has been used to design this power point template diagram. This PPT diagram contains the concept of business process indication. Use this PPT diagram for business and marketing related presentations.
-
 Nl three steps for data flow indication powerpoint temptate
Presenting nl three steps for data flow indication powerpoint temptate. Three steps diagram has been used to craft this power point template diagram. This PPT diagram contains the concept of business data flow representation. Use this PPT diagram for business and marketing related presentations.
-
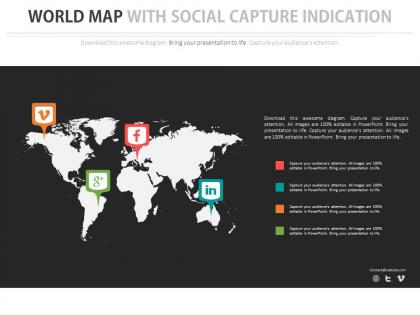 World map with social media capture indication powerpoint slides
Presenting world map with social media capture indication powerpoint slides. This Power Point template slide has been crafted with graphic of world map and social media icons .This PPT slide contains the concept of social media capture indication. Use this PPT slide for business and social media related presentations.
-
 Globe with flag for business location indication ppt presentation slides
Presenting globe with flag for business location indication ppt presentation slides. This Power Point template slide has been crafted with graphic of globe with flags .This PPT slide contains the concept of global business location indication . Use this PPT side for business and finance related presentations.
-
 Website visitors key performance indicators report ppt slide
Presenting website visitors key performance indicators report ppt slide. This presentation slide shows three Key Performance Indicators or KPIs in a Dashboard style design. The first KPI that can be shown is Number of Visitors of Web Site. The second KPI is Number of Unique Visitors of Web Site and the third is Average Time Spent on Website For Member. These KPI Powerpoint graphics are all data driven, and the shape automatically adjusts according to your data. Just right click on the KPI graphic, enter the right value and the shape will adjust automatically. Make a visual impact with our KPI slides.
-
 Business kpi showing employee analysing the graph of companys performance indicator
Presenting this set of slides with name - Business Kpi Showing Employee Analysing The Graph Of Companys Performance Indicator. This is a four stage process. The stages in this process are Business Kpi, Business Dashboard, Business Metrics.
-
 Low high moderate radio texting distractions with indicator
Presenting this set of slides with name - Low High Moderate Radio Texting Distractions With Indicator. This is a four stage process. The stages in this process are Distraction, Diversion, Interruption, Disturbance.
-
 Engagement survey meter with indicator and score
Presenting this set of slides with name - Engagement Survey Meter With Indicator And Score. This is a five stage process. The stages in this process are Engagement Survey, Engagement Observation, Engagement View.
-
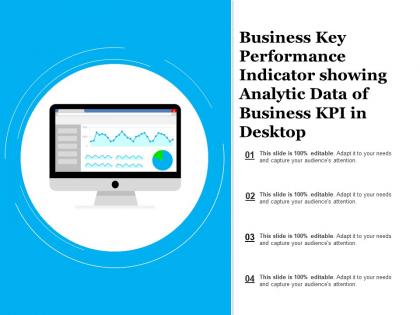 Business key performance indicator showing analytic data of business kpi in desktop
Presenting this set of slides with name - Business Key Performance Indicator Showing Analytic Data Of Business Kpi In Desktop. This is a four stage process. The stages in this process are Business Kpi, Business Dashboard, Business Metrics.
-
 Business kpi showing graphs key performance indicator in tablets and documents
Presenting this set of slides with name - Business Kpi Showing Graphs Key Performance Indicator In Tablets And Documents. This is a four stage process. The stages in this process are Business Kpi, Business Dashboard, Business Metrics.
-
 Business kpi showing key performance indicator of company through target point and line graph
Presenting this set of slides with name - Business Kpi Showing Key Performance Indicator Of Company Through Target Point And Line Graph. This is a three stage process. The stages in this process are Business Kpi, Business Dashboard, Business Metrics.
-
 Business kpi showing summary of key performance indicator data representation in line graph and pie chart
Presenting this set of slides with name - Business Kpi Showing Summary Of Key Performance Indicator Data Representation In Line Graph And Pie Chart. This is a three stage process. The stages in this process are Business Kpi, Business Dashboard, Business Metrics.
-
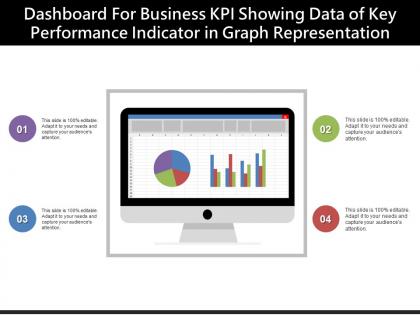 Dashboard for business kpi showing data of key performance indicator in graph representation
Presenting this set of slides with name - Dashboard For Business Kpi Showing Data Of Key Performance Indicator In Graph Representation. This is a four stage process. The stages in this process are Business Kpi, Business Dashboard, Business Metrics.
-
 Logistics dashboard showing single digital value arc indicator
Presenting Logistics Dashboard Showing Single Digital Value Arc Indicator PPT slide. The sales growth digital value PowerPoint template designed professionally by the team of SlideTeam to present formulation as well as execution of business finance strategy. The different icons such as arc indicator, dot symbol and many other, as well as text in the sale growth dashboard slide. This slide is customizable in PowerPoint and can help you in sharing the values in digital format. The logistics digital dashboard slide is compatible with Google Slide. A user can make changes in the font size, font type, color and dimensions of the different icons to present the desired digital values.
-
 Disaster recovery rapid decision making key performance indicators cpb
This is an editable three stages graphic that deals with topics like Disaster Recovery, Rapid Decision Making, Key Performance Indicators to help convey your message better graphically. This product is a premium product available for immediate download, and is 100 percent editable in Powerpoint. Download this now and use it in your presentations to impress your audience.
-
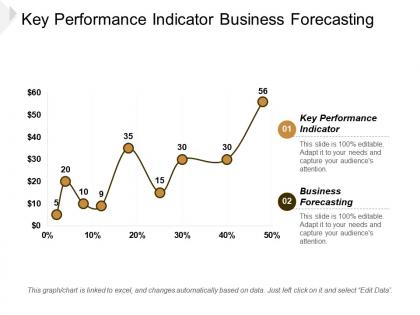 Key performance indicator business forecasting nist risk management cpb
This is an editable one stages graphic that deals with topics like Key Performance Indicator, Business Forecasting, Nist Risk Management to help convey your message better graphically. This product is a premium product available for immediate download, and is 100 percent editable in Powerpoint. Download this now and use it in your presentations to impress your audience.
-
 Performance indicators percentage circle
Presenting this set of slides with name - Performance Indicators Percentage Circle. This is a eleven stage process. The stages in this process are Percentage Circle, Percentage Round, Pie Chart.
-
 Project performance indicators percentage circle
Presenting this set of slides with name - Project Performance Indicators Percentage Circle. This is a five stage process. The stages in this process are Percentage Circle, Percentage Round, Pie Chart.
-
 Customer satisfaction indicators ppt powerpoint presentation gallery example cpb
Presenting this set of slides with name - Customer Satisfaction Indicators Ppt Powerpoint Presentation Gallery Example Cpb. This is an editable four stages graphic that deals with topics like Customer Satisfaction Indicators to help convey your message better graphically. This product is a premium product available for immediate download, and is 100 percent editable in Powerpoint. Download this now and use it in your presentations to impress your audience.
-
 Large Arrow Indicates Coffee Shop
Presenting this set of slides with name Large Arrow Indicates Coffee Shop. The topics discussed in these slides are Arrow Large, Arrow Charts, Arrow Graph. This is a completely editable PowerPoint presentation and is available for immediate download. Download now and impress your audience.
-
 Employee morale scorecard scorecard indicating employee morale measured
Present the topic in a bit more detail with this Employee Morale Scorecard Scorecard Indicating Employee Morale Measured. Use it as a tool for discussion and navigation on Scorecard Indicating Employee Morale Measured Across Multiple Factors. This template is free to edit as deemed fit for your organization. Therefore download it now.
-
 Economic health indicators ppt powerpoint presentation pictures file formats cpb
Presenting Economic Health Indicators Ppt Powerpoint Presentation Pictures File Formats Cpb slide which is completely adaptable. The graphics in this PowerPoint slide showcase four stages that will help you succinctly convey the information. In addition, you can alternate the color, font size, font type, and shapes of this PPT layout according to your content. This PPT presentation can be accessed with Google Slides and is available in both standard screen and widescreen aspect ratios. It is also a useful set to elucidate topics like Economic Health Indicators. This well structured design can be downloaded in different formats like PDF, JPG, and PNG. So, without any delay, click on the download button now.
-
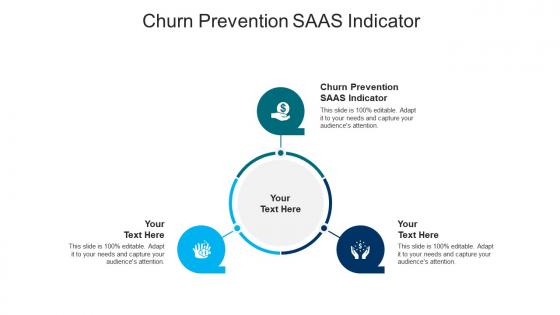 Churn prevention saas indicator ppt powerpoint presentation outline icon cpb
Presenting Churn Prevention Saas Indicator Ppt Powerpoint Presentation Outline Icon Cpb slide which is completely adaptable. The graphics in this PowerPoint slide showcase three stages that will help you succinctly convey the information. In addition, you can alternate the color, font size, font type, and shapes of this PPT layout according to your content. This PPT presentation can be accessed with Google Slides and is available in both standard screen and widescreen aspect ratios. It is also a useful set to elucidate topics like Churn Prevention Saas Indicator. This well structured design can be downloaded in different formats like PDF, JPG, and PNG. So, without any delay, click on the download button now.
-
 Influence of engagement strategies key performance indicators related to talent
The slide shows the key Performance Indicator KPI s which will help the company to track the success rate of implemented strategies. Major KPIs include number of employee recruitment , number of employee leaves, churn rate, employee satisfaction rate etc. Present the topic in a bit more detail with this Influence Of Engagement Strategies Key Performance Indicators Related To Talent. Use it as a tool for discussion and navigation on Performance, Management, Engagement. This template is free to edit as deemed fit for your organization. Therefore download it now.
-
 Demand supply indicator stock market ppt powerpoint presentation slides topics cpb
Presenting our Demand Supply Indicator Stock Market Ppt Powerpoint Presentation Slides Topics Cpb PowerPoint template design. This PowerPoint slide showcases four stages. It is useful to share insightful information on Demand Supply Indicator Stock Market This PPT slide can be easily accessed in standard screen and widescreen aspect ratios. It is also available in various formats like PDF, PNG, and JPG. Not only this, the PowerPoint slideshow is completely editable and you can effortlessly modify the font size, font type, and shapes according to your wish. Our PPT layout is compatible with Google Slides as well, so download and edit it as per your knowledge.
-
 Economic indicators ppt powerpoint presentation layouts portrait cpb
Presenting Economic Indicators Ppt Powerpoint Presentation Layouts Portrait Cpb slide which is completely adaptable. The graphics in this PowerPoint slide showcase nine stages that will help you succinctly convey the information. In addition, you can alternate the color, font size, font type, and shapes of this PPT layout according to your content. This PPT presentation can be accessed with Google Slides and is available in both standard screen and widescreen aspect ratios. It is also a useful set to elucidate topics like Economic Indicators. This well-structured design can be downloaded in different formats like PDF, JPG, and PNG. So, without any delay, click on the download button now.
-
 Cyber threat management workplace addressing indicators associated insider
This slide provides details regarding indicators associated to insider threats in terms of traits, demeanor and goals, etc. Deliver an outstanding presentation on the topic using this Cyber Threat Management Workplace Addressing Indicators Associated Insider. Dispense information and present a thorough explanation of Demeanor, goals, Traits, Data Exfiltration, Financial Stress using the slides given. This template can be altered and personalized to fit your needs. It is also available for immediate download. So grab it now.


