Powerpoint Templates and Google slides for Graphs Icon
Save Your Time and attract your audience with our fully editable PPT Templates and Slides.
-
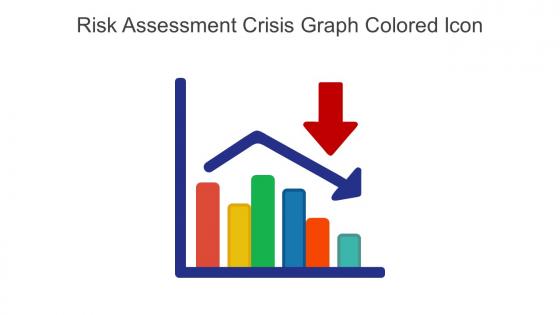 Risk Assessment Crisis Graph Colored Icon In Powerpoint Pptx Png And Editable Eps Format
This coloured PowerPoint icon is a visual representation of a crisis situation. It features a graph with a downward arrow, representing a decline, and a bright colour palette to draw attention and emphasize the urgency of the situation. Its perfect for presentations on economic downturns, natural disasters, and other crisis scenarios.
-
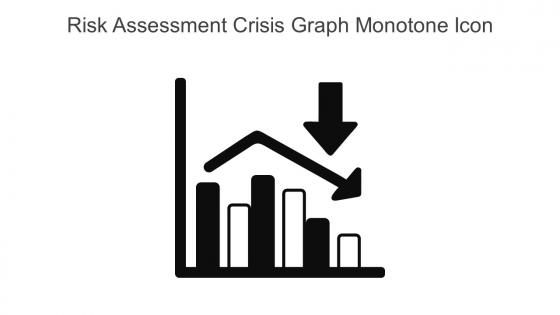 Risk Assessment Crisis Graph Monotone Icon In Powerpoint Pptx Png And Editable Eps Format
This Monotone Powerpoint Icon on Crisis Graph is an essential tool for businesses to help them identify and understand the impact of crises on their operations. It provides a visual representation of the current state of the organization and the potential risks associated with the crisis. It is easy to use and can be used to create a comprehensive report to help guide business decisions.
-
 Risk Mitigation Crisis Graph Colored Icon In Powerpoint Pptx Png And Editable Eps Format
This coloured PowerPoint icon is a visual representation of a crisis situation. It features a graph with a downward arrow, representing a decline, and a bright colour palette to draw attention and emphasize the urgency of the situation. Its perfect for presentations on economic downturns, natural disasters, and other crisis scenarios.
-
 Risk Mitigation Crisis Graph Monotone Icon In Powerpoint Pptx Png And Editable Eps Format
This Monotone Powerpoint Icon on Crisis Graph is an essential tool for businesses to help them identify and understand the impact of crises on their operations. It provides a visual representation of the current state of the organization and the potential risks associated with the crisis. It is easy to use and can be used to create a comprehensive report to help guide business decisions.
-
 Threat Assessment Crisis Graph Colored Icon In Powerpoint Pptx Png And Editable Eps Format
This coloured PowerPoint icon is a visual representation of a crisis situation. It features a graph with a downward arrow, representing a decline, and a bright colour palette to draw attention and emphasize the urgency of the situation. Its perfect for presentations on economic downturns, natural disasters, and other crisis scenarios.
-
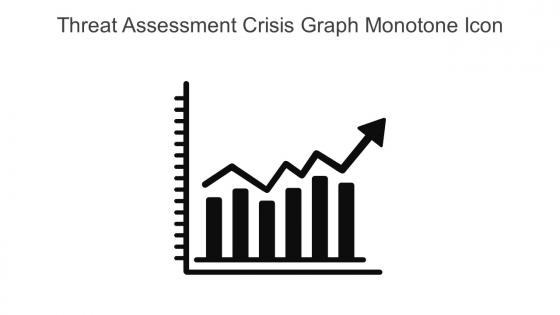 Threat Assessment Crisis Graph Monotone Icon In Powerpoint Pptx Png And Editable Eps Format
This Monotone Powerpoint Icon on Crisis Graph is an essential tool for businesses to help them identify and understand the impact of crises on their operations. It provides a visual representation of the current state of the organization and the potential risks associated with the crisis. It is easy to use and can be used to create a comprehensive report to help guide business decisions.
-
 Data Virtualisation Graph Database Colored Icon In Powerpoint Pptx Png And Editable Eps Format
Enhance your presentations with this eye-catching PowerPoint icon featuring a colourful graph line symbolizing the power of data virtualisation. Perfect for showcasing the benefits and capabilities of this innovative technology in a visually appealing way. Grab your audiences attention and elevate your slides with this vibrant icon.
-
 Data Virtualisation Graph Database Monotone Icon In Powerpoint Pptx Png And Editable Eps Format
This Monotone powerpoint icon features a sleek and modern design of a graph line, representing data virtualisation. It is perfect for presentations and documents related to data management, analytics, and virtualisation. The icon is easily recognizable and adds a professional touch to any visual representation of data virtualisation.
-
 Icons Slide For Gojek Business Model Ppt Diagram Graph Charts BMC SS
Introducing our well researched set of slides titled Icons Slide For Gojek Business Model Ppt Diagram Graph Charts BMC SS. It displays a hundred percent editable icons. You can use these icons in your presentation to captivate your audiences attention. Download now and use it multiple times.
-
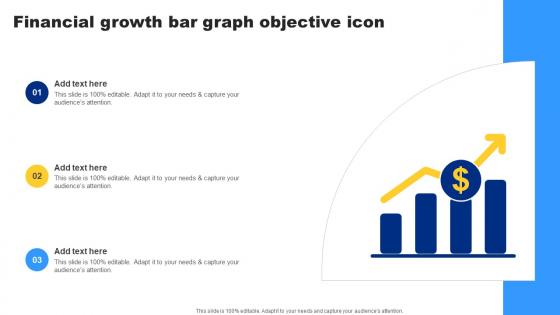 Financial Growth Bar Graph Objective Icon
Introducing our premium set of slides with Financial Growth Bar Graph Objective Icon Ellicudate the three stages and present information using this PPT slide. This is a completely adaptable PowerPoint template design that can be used to interpret topics like Financial Growth, Bar Graph, Objective Icon So download instantly and tailor it with your information.
-
 Data Virtualisation Through Graph Line Icon
Introducing our premium set of slides with Data Virtualisation Through Graph Line Icon. Ellicudate the four stages and present information using this PPT slide. This is a completely adaptable PowerPoint template design that can be used to interpret topics like Data Virtualization, Through Graph Line, Icon. So download instantly and tailor it with your information.
-
 User Audience Graph Analysis Icon
Introducing our premium set of slides with User Audience Graph Analysis Icon Ellicudate the three stages and present information using this PPT slide. This is a completely adaptable PowerPoint template design that can be used to interpret topics like User Audience, Graph Analysis. So download instantly and tailor it with your information.
-
 Graph Showcasing Annual Gross Profit Icon
Introducing our premium set of slides with Graph Showcasing Annual Gross Profit Icon. Ellicudate the three stages and present information using this PPT slide. This is a completely adaptable PowerPoint template design that can be used to interpret topics like Graph, Showcasing Annual, Gross Profit Icon. So download instantly and tailor it with your information.
-
 Trading Account Opening Icon Showing Revenue Graphs
Introducing our premium set of slides with Trading Account Opening Icon Showing Revenue Graphs Ellicudate the Three stages and present information using this PPT slide. This is a completely adaptable PowerPoint template design that can be used to interpret topics like Trading Account Opening, Icon Showing Revenue Graphs. So download instantly and tailor it with your information.
-
 Augmented Analytics Graph Icon Using AI
Presenting our set of slides with Augmented Analytics Graph Icon Using Ai This exhibits information on Three stages of the process. This is an easy to edit and innovatively designed PowerPoint template. So download immediately and highlight information on Augmented Analytics Graph Icon Using Ai
-
 Project Documentation Icon With Chart Graphs
Presenting our set of slides with name Project Documentation Icon With Chart Graphs. This exhibits information on three stages of the process. This is an easy to edit and innovatively designed PowerPoint template. So download immediately and highlight information on Project Documentation, Icon With Chart Graphs.
-
 Briefcase Documents With Statistics Graph Colored Icon In Powerpoint Pptx Png And Editable Eps Format
This vibrant PowerPoint icon features a colorful design that will add a professional touch to your service portfolio presentations. With its eye catching colors and sleek design, this icon is perfect for showcasing your companys range of services and impressing potential clients. Enhance your portfolio with this dynamic and modern icon.
-
 Briefcase Documents With Statistics Graph Monotone Icon In Powerpoint Pptx Png And Editable Eps Format
This Monotone PowerPoint icon is the perfect addition to your service portfolio presentation. With its sleek and modern design, it will enhance the visual appeal of your slides and make your service offerings stand out. The icon is easy to use and will add a professional touch to your presentation.
-
 Financial Business Planning Icon With Graph And Checklist
Introducing our premium set of slides with Financial Business Planning Icon With Graph And Checklist. Ellicudate the three stages and present information using this PPT slide. This is a completely adaptable PowerPoint template design that can be used to interpret topics like Financial Business Planning, Icon, Graph And Checklist. So download instantly and tailor it with your information.
-
 Graph Icon Representing Data Intelligence Industry Report
Presenting our set of slides with Graph Icon Representing Data Intelligence Industry Report This exhibits information on three stages of the process. This is an easy to edit and innovatively designed PowerPoint template. So download immediately and highlight information on Graph Icon Representing Data, Intelligence Industry Report
-
 Business Price Segmentation Graph Icon
Introducing our Business Price Segmentation Graph Icon set of slides. The topics discussed in these slides are Business, Segmentation. This is an immediately available PowerPoint presentation that can be conveniently customized. Download it and convince your audience.
-
 Customer Lifetime Value Graph Icon
Presenting our well structured Customer Lifetime Value Graph Icon The topics discussed in this slide are Customer Lifetime Value Graph IconThis is an instantly available PowerPoint presentation that can be edited conveniently. Download it right away and captivate your audience.
-
 Eu six staged bar graph and icons powerpoint template
Presenting eu six staged bar graph and icons powerpoint template. Six staged bar graph and icons has been used to craft this power point template diagram. This PPT diagram contains the concept of business result analysis representation. This PPT diagram can be used for business and marketing related presentations.
-
 Six staged bar graph with icons powerpoint template slide
We are proud to present our six staged bar graph with icons powerpoint template slide. Six staged bar graph diagram with icons has been used to craft this power point template diagram. This PPT diagram contains the concept of business result analysis. Use this PPT diagram for business and marketing related presentations.
-
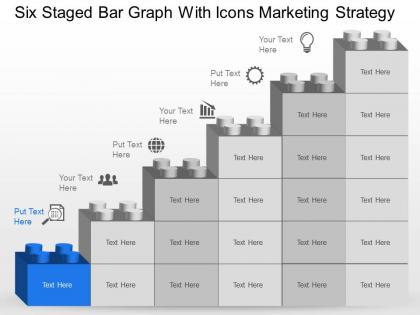 Nb six staged bar graph with icons marketing strategy powerpoint template slide
Presenting nb six staged bar graph with icons marketing strategy powerpoint template slide. Six staged bar graph and icons has been used to craft this power point template diagram. This PPT diagram contains the concept of marketing strategy. Use this PPT diagram for marketing and business related presentation.
-
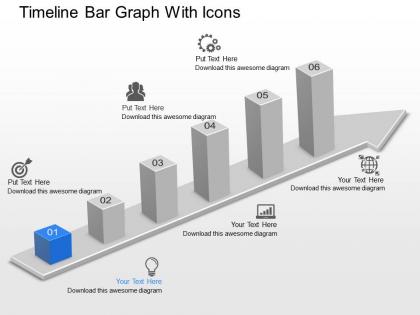 Du timeline bar graph with icons powerpoint template
Presenting du timeline bar graph with icons powerpoint template. Presenting du timeline bar graph with icons powerpoint template. Presenting du timeline bar graph with icons powerpoint template. This Power Point template diagram has been crafted with graphic of timeline and bar graph diagram. This PPT diagram contains the concept of business result analysis. Use this PPT diagram for business and marketing related presentations.
-
 Ai five staged bar graph and icons powerpoint template
Presenting ai five staged bar graph and icons powerpoint template. Five staged bar graph diagram and icons has been used to craft this power point template diagram. This PPT diagram contains the concept of sales result analysis. Use this PPT diagram for business and sales related presentations.
-
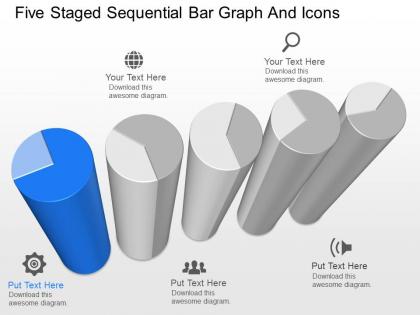 Km five staged sequential bar graph and icons powerpoint template
Presenting km five staged sequential bar graph and icons powerpoint template. Five staged sequential bar graph diagram and icons has been used to craft this Power Point template diagram. This PPT diagram contains the concept of business data representation. Use this PPT diagram for business and finance related presentations.
-
 Fg five staged arrow graph and icons diagram powerpoint template
Presenting fg five staged arrow graph and icons diagram powerpoint template. Five staged arrow graph and icons has been used to craft this Power Point template diagram. This PPT diagram contains the concept of process flow. Use this PPT diagram for business and finance related presentations.
-
 Gq key diagram with text pie graph and icons powerpoint template
High resolution PPT diagrams. 100 percent editable format. Easy inclusion and exclusion of information as per individual choice. Adaptable and convertible into various formats. Simple to download. For more of personalization one may easily add the company name, logo or trademark. Productive set of PowerPoint icon images for entrepreneurs, investors, internal and external stakeholders, researchers, business analysts and education professionals.
-
 Is five staged bar graph and icons powerpoint template
Presenting is five staged bar graph and icons powerpoint template. Graphic of five staged bar graph and icons has been used to craft this power point template diagram. This PPT diagram contains concept of business result analysis representation. Use this PPT diagram for business and marketing related presentations.
-
 Iw five staged pie graph with icons result analysis powerpoint template
Presenting iw five staged pie graph with icons result analysis powerpoint template. Five staged pie graph and icons has been used to craft this power point template diagram. This PPT diagram contains the concept of result analysis representation. Use this PPT diagram for business and marketing related presentations.
-
 Lp four stage book design bar graph and icons powerpoint template
Presenting lp four stage book design bar graph and icons powerpoint template. Four staged book design bar graph diagram has been used to craft this power point template diagram. This PPT diagram contains the concept of business result analysis representation. Use this PPT diagram for business and marketing related presentations.
-
 Ks four staged gear bar graph and icons powerpoint template
Presenting ks four staged gear bar graph and icons powerpoint template. Four staged gear, bar graph and icons has been used to craft this Power Point template diagram. This PPT diagram contains the concept of process control and result analysis representation. Use this PPT diagram for business and marketing related presentations.
-
 Mq four staged lego blocks bar graph with icons powerpoint template slide
Presenting mq four staged lego blocks bar graph with icons powerpoint template slide. Four staged Lego block and bar graph has been used to craft this power point template diagram. This PPT diagram contains the concept of business strategy and result analysis. Use this PPT diagram for marketing and business related presentations.
-
 Mt four steps lego blocks bar graph with icons powerpoint template slide
Presenting mt four steps lego blocks bar graph with icons powerpoint template slide. Four staged Lego block and bar graph with icons has been used to craft this power point template diagram. This PPT diagram contains the concept of business planning and result analysis. Use this PPT diagram for marketing and business related presentations.
-
 Company sales graph business management ppt icon model
Present the topic in a bit more detail with this Company Sales Graph Business Management Ppt Icon Model. Use it as a tool for discussion and navigation on Company Sales Graph. This template is free to edit as deemed fit for your organization. Therefore download it now.
-
 Bar Graph Traditional Marketing Guide To Engage Potential Audience Ppt Icon Designs Download
Present the topic in a bit more detail with this Bar Graph Traditional Marketing Guide To Engage Potential Audience Ppt Icon Designs Download. Use it as a tool for discussion and navigation on Bar Graph, Product, Edit Data. This template is free to edit as deemed fit for your organization. Therefore download it now.
-
 Bar graph and sphere on top with icons powerpoint template slide
We are proud to present our bar graph and sphere on top with icons powerpoint template slide. Graphic of bar graph and sphere on top with icons has been used to craft this power point template diagram. This PPT diagram contains the concept of analysis. Use this PPT diagram for business and marketing related presentations.
-
 Np three staged lego blocks bar graph with icons powerpoint template slide
Presenting np three staged lego blocks bar graph with icons powerpoint template slide. Three staged Lego block, bar graph with icons has been used to craft this power point template diagram. This PPT diagram contains the concept of business planning and result analysis. Use this PPT diagram for marketing and business related presentations.
-
 3d graphs business bar chart and pie chart with icons
Presenting this set of slides with name - 3d Graphs Business Bar Chart And Pie Chart With Icons. This is a two stage process. The stages in this process are Paint Brush, Art, Coloring.
-
 Business powerpoint templates blue pieces of strategy puzzle icon graph sales ppt slides
It is all there in bits and pieces. Individual components well researched and understood in their place. Now you need to get it all together to form the complete picture and reach the goal. You have the ideas and plans on how to go about it. Use this template to illustrate your method, piece by piece, and interlock the whole process in the minds of your audience. It is a 16x15 240 pieces 3D Rectangular Jigsaw Puzzle Matrix.
-
 0914 business plan bar graph cube bars icons image slide powerpoint presentation template
We are proud to present our 0914 business plan bar graph cube bars icons image slide powerpoint presentation template. This image slide displays abstract 3d four options cube bars. Use this image slide, in your presentations to express views on progress, growth and steps. It may also be used for analyzing market research. This image slide will enhance the quality of your presentations.
-
 Population ecologists follower theory graph ppt powerpoint presentation icon background images cpb
Presenting our Population Ecologists Follower Theory Graph Ppt Powerpoint Presentation Icon Background Images Cpb PowerPoint template design. This PowerPoint slide showcases three stages. It is useful to share insightful information on Population Ecologists Follower Theory Graph This PPT slide can be easily accessed in standard screen and widescreen aspect ratios. It is also available in various formats like PDF, PNG, and JPG. Not only this, the PowerPoint slideshow is completely editable and you can effortlessly modify the font size, font type, and shapes according to your wish. Our PPT layout is compatible with Google Slides as well, so download and edit it as per your knowledge.
-
 Statistics graph icon showing financial forecast
Presenting our set of slides with Statistics Graph Icon Showing Financial Forecast. This exhibits information on four stages of the process. This is an easy-to-edit and innovatively designed PowerPoint template. So download immediately and highlight information on Statistics Graph Icon Showing Financial Forecast.
-
 Statistics icon of data analytics using bar graph
Presenting our set of slides with Statistics Icon Of Data Analytics Using Bar Graph. This exhibits information on four stages of the process. This is an easy-to-edit and innovatively designed PowerPoint template. So download immediately and highlight information on Statistics Icon Of Data Analytics Using Bar Graph.
-
 Statistics icon of poll graph depicting elections result
Introducing our Statistics Icon Of Poll Graph Depicting Elections Result set of slides. The topics discussed in these slides are Statistics Icon Of Poll Graph Depicting Elections Result. This is an immediately available PowerPoint presentation that can be conveniently customized. Download it and convince your audience.
-
 Frictional unemployment graph ppt powerpoint presentation icon graphics tutorials cpb
Presenting our Frictional Unemployment Graph Ppt Powerpoint Presentation Icon Graphics Tutorials Cpb PowerPoint template design. This PowerPoint slide showcases four stages. It is useful to share insightful information on Frictional Unemployment Graph This PPT slide can be easily accessed in standard screen and widescreen aspect ratios. It is also available in various formats like PDF, PNG, and JPG. Not only this, the PowerPoint slideshow is completely editable and you can effortlessly modify the font size, font type, and shapes according to your wish. Our PPT layout is compatible with Google Slides as well, so download and edit it as per your knowledge.
-
 Graph comparison icon for financial ratios
Presenting our set of slides with Graph Comparison Icon For Financial Ratios. This exhibits information on three stages of the process. This is an easy to edit and innovatively designed PowerPoint template. So download immediately and highlight information on Graph Comparison Icon For Financial Ratios.
-
 Graph icon for price to earning ratio
Presenting our set of slides with Graph Icon For Price To Earning Ratio. This exhibits information on four stages of the process. This is an easy to edit and innovatively designed PowerPoint template. So download immediately and highlight information on Graph Icon For Price To Earning Ratio.
-
 Hierarchical graph ppt powerpoint presentation icon graphics download cpb
Presenting Hierarchical Graph Ppt Powerpoint Presentation Icon Graphics Download Cpb slide which is completely adaptable. The graphics in this PowerPoint slide showcase four stages that will help you succinctly convey the information. In addition, you can alternate the color, font size, font type, and shapes of this PPT layout according to your content. This PPT presentation can be accessed with Google Slides and is available in both standard screen and widescreen aspect ratios. It is also a useful set to elucidate topics like Hierarchical Graph. This well structured design can be downloaded in different formats like PDF, JPG, and PNG. So, without any delay, click on the download button now.
-
 Graphing data ppt powerpoint presentation icon portrait cpb
Presenting our Graphing Data Ppt Powerpoint Presentation Icon Portrait Cpb PowerPoint template design. This PowerPoint slide showcases six stages. It is useful to share insightful information on Graphing Data. This PPT slide can be easily accessed in standard screen and widescreen aspect ratios. It is also available in various formats like PDF, PNG, and JPG. Not only this, the PowerPoint slideshow is completely editable and you can effortlessly modify the font size, font type, and shapes according to your wish. Our PPT layout is compatible with Google Slides as well, so download and edit it as per your knowledge.
-
 Product cost reduction analysis graph icon
Introducing our Product Cost Reduction Analysis Graph Icon set of slides. The topics discussed in these slides are Product Cost Reduction Analysis Graph Icon. This is an immediately available PowerPoint presentation that can be conveniently customized. Download it and convince your audience.
-
 Tax wedge graph ppt powerpoint presentation icon clipart cpb
Presenting our Tax Wedge Graph Ppt Powerpoint Presentation Icon Clipart Cpb PowerPoint template design. This PowerPoint slide showcases five stages. It is useful to share insightful information on Tax Wedge Graph This PPT slide can be easily accessed in standard screen and widescreen aspect ratios. It is also available in various formats like PDF, PNG, and JPG. Not only this, the PowerPoint slideshow is completely editable and you can effortlessly modify the font size, font type, and shapes according to your wish. Our PPT layout is compatible with Google Slides as well, so download and edit it as per your knowledge.
-
 Icons Slide For PSM Certification Training IT Ppt Diagram Graph Charts
Presenting our well crafted Icons Slide For PSM Certification Training IT Ppt Diagram Graph Charts set of slides. The slides include icons that are innovatively designed by our team of experts. The icons are easy to edit so you can conveniently increase or decrease their size without any loss in resolution. Therefore, grab them instantly.
-
 Employee Performance Improvement Plan Icon With Bar Graph
Introducing our premium set of slides with Employee Performance Improvement Plan Icon With Bar Graph. Ellicudate the three stages and present information using this PPT slide. This is a completely adaptable PowerPoint template design that can be used to interpret topics like Employee Performance Improvement Plan Icon With Bar Graph. So download instantly and tailor it with your information.
-
 Project Management Plan Icon With Graph And Gear Symbol
Introducing our Project Management Plan Icon With Graph And Gear Symbol set of slides. The topics discussed in these slides are Project Management Plan Icon With Graph And Gear Symbol. This is an immediately available PowerPoint presentation that can be conveniently customized. Download it and convince your audience.
-
 Foreign Outsourcing Graph Ppt Powerpoint Presentation Icon Example Topics Cpb
Presenting our Foreign Outsourcing Graph Ppt Powerpoint Presentation Icon Example Topics Cpb PowerPoint template design. This PowerPoint slide showcases three stages. It is useful to share insightful information on Foreign Outsourcing Graph This PPT slide can be easily accessed in standard screen and widescreen aspect ratios. It is also available in various formats like PDF, PNG, and JPG. Not only this, the PowerPoint slideshow is completely editable and you can effortlessly modify the font size, font type, and shapes according to your wish. Our PPT layout is compatible with Google Slides as well, so download and edit it as per your knowledge.
-
 Icon Of Earned Value Graph For Project Management
Introducing our premium set of slides with Icon Of Earned Value Graph For Project Management. Ellicudate the one stage and present information using this PPT slide. This is a completely adaptable PowerPoint template design that can be used to interpret topics like Icon Of Earned Value Graph For Project Management. So download instantly and tailor it with your information.
-
 Frequency distribution graph ppt powerpoint presentation icon gallery cpb
Presenting Frequency Distribution Graph Ppt Powerpoint Presentation Icon Gallery Cpb slide which is completely adaptable. The graphics in this PowerPoint slide showcase three stages that will help you succinctly convey the information. In addition, you can alternate the color, font size, font type, and shapes of this PPT layout according to your content. This PPT presentation can be accessed with Google Slides and is available in both standard screen and widescreen aspect ratios. It is also a useful set to elucidate topics like Frequency Distribution Graph. This well structured design can be downloaded in different formats like PDF, JPG, and PNG. So, without any delay, click on the download button now.


