Powerpoint Templates and Google slides for Graphs Icon
Save Your Time and attract your audience with our fully editable PPT Templates and Slides.
-
 Progress Icon Circle Arrow Bar Graph Dollar Sign Graph Gear
It covers all the important concepts and has relevant templates which cater to your business needs. This complete deck has PPT slides on Progress Icon Circle Arrow Bar Graph Dollar Sign Graph Gear with well suited graphics and subject driven content. This deck consists of total of ninteen slides. All templates are completely editable for your convenience. You can change the colour, text and font size of these slides. You can add or delete the content as per your requirement. Get access to this professionally designed complete deck presentation by clicking the download button below.
-
 Twelve staged lego blocks bar graph and business icons powerpoint template slide
We are proud to present our twelve staged lego blocks bar graph and business icons powerpoint template slide. Twelve staged Lego blocks bar graph and business icons has been used to craft this power point template diagram. This PPT diagram contains the concept of business result analysis techniques .Use this PPT diagram for business and marketing related presentations.
-
 Md eleven staged bar graph with icons business analysis powerpoint template slide
Presenting md eleven staged bar graph with icons business analysis powerpoint template slide. Eleven staged bar graph and icons has been used to craft this power point template diagram. This PPT diagram contains the concept of business result analysis. Use this PPT diagram for marketing and business related presentation.
-
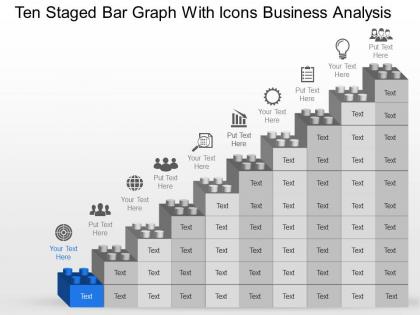 Ng ten staged bar graph with icons business analysis powerpoint template slide
Presenting ng ten staged bar graph with icons business analysis powerpoint template slide. Ten staged bar graph and icons has been used to craft this power point template diagram. This PPT diagram contains the concept of business result analysis. Use this PPT diagram for marketing and business related presentation.
-
 Mu nine staged bar graph with icons business analysis powerpoint template slide
Presenting mu nine staged bar graph with icons business analysis powerpoint template slide. Nine staged bar graph and icons has been used to craft this power point template diagram. This PPT diagram contains the concept of business progress analysis. Use this PPT diagram for sales and business related presentation.
-
 Continuous Improvement Icon Showing Circular Arrow With Gear Circular Arrows With Graph
We bring to you to the point topic specific slides with apt research and understanding. Putting forth our PPT deck comprises of twelve slides. Our tailor made Continuous Improvement Icon Showing Circular Arrow With Gear Circular Arrows With Graph editable presentation deck assists planners to segment and expound the topic with brevity. The advantageous slides on Continuous Improvement Icon Showing Circular Arrow With Gear Circular Arrows With Graph is braced with multiple charts and graphs, overviews, analysis templates agenda slides etc. to help boost important aspects of your presentation. Highlight all sorts of related usable templates for important considerations. Our deck finds applicability amongst all kinds of professionals, managers, individuals, temporary permanent teams involved in any company organization from any field.
-
 Improve Icon Analytics Graph Business Increase Performance Growth Evaluation Gears
It has PPT slides covering wide range of topics showcasing all the core areas of your business needs. This complete deck focuses on Improve Icon Analytics Graph Business Increase Performance Growth Evaluation Gears and consists of professionally designed templates with suitable graphics and appropriate content. This deck has total of twleve slides. Our designers have created customizable templates for your convenience. You can make the required changes in the templates like colour, text and font size. Other than this, content can be added or deleted from the slide as per the requirement. Get access to this professionally designed complete deck PPT presentation by clicking the download button below.
-
 Business Person Icon Dollar Arrows Histogram Graph Success Gearwheel Conversation
This complete deck covers various topics and highlights important concepts. It has PPT slides which cater to your business needs. This complete deck presentation emphasizes Business Person Icon Dollar Arrows Histogram Graph Success Gearwheel Conversation and has templates with professional background images and relevant content. This deck consists of total of twelve slides. Our designers have created customizable templates, keeping your convenience in mind. You can edit the colour, text and font size with ease. Not just this, you can also add or delete the content if needed. Get access to this fully editable complete presentation by clicking the download button below.
-
 Objectives Icon Arrow Target Graph Box Tick
Deliver a lucid presentation by utilizing this Objectives Icon Arrow Target Graph Box Tick. Use it to present an overview of the topic with the right visuals, themes, shapes, and graphics. This is an expertly designed complete deck that reinforces positive thoughts and actions. Use it to provide visual cues to your audience and help them make informed decisions. A wide variety of discussion topics can be covered with this creative bundle such as Objectives Icon, Arrow, Target, Graph, Box. All the twelve slides are available for immediate download and use. They can be edited and modified to add a personal touch to the presentation. This helps in creating a unique presentation every time. Not only that, with a host of editable features, this presentation can be used by any industry or business vertical depending on their needs and requirements. The compatibility with Google Slides is another feature to look out for in the PPT slideshow.
-
 Cp eight staged business pie graph and icons powerpoint template
Presenting cp eight staged business pie graph and icons powerpoint template. Eight staged business pie graph and icons has been used to craft this power point template diagram. This PPT diagram contains the concept of result analysis and marketing strategy. Use this PPT diagram for business and marketing related presentations.
-
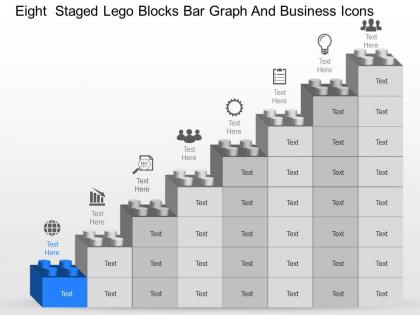 Eight staged lego blocks bar graph and business icons powerpoint template slide
We are proud to present our eight staged lego blocks bar graph and business icons powerpoint template slide. Eight staged Lego blocks and bar graph diagram has been used to craft this power point template diagram. This PPT diagram contains the concept of business result analysis. Use this PPT diagram for business and marketing related presentations.
-
 Mb eight staged bar graph with icons sales planning powerpoint template slide
Presenting mb eight staged bar graph with icons sales planning powerpoint template slide. Eight staged bar graph and icons has been used to craft this power point template diagram. This PPT diagram contains the concept of sales planning. Use this PPT diagram for sales and business related presentation.
-
 Population Icon Demographic Segregation Arrow Graph Displaying
It has PPT slides covering wide range of topics showcasing all the core areas of your business needs. This complete deck focuses on Population Icon Demographic Segregation Arrow Graph Displaying and consists of professionally designed templates with suitable graphics and appropriate content. This deck has total of eleven slides. Our designers have created customizable templates for your convenience. You can make the required changes in the templates like colour, text and font size. Other than this, content can be added or deleted from the slide as per the requirement. Get access to this professionally designed complete deck PPT presentation by clicking the download button below.
-
 Bar graph with seven steps and icons powerpoint template slide
We are proud to present our bar graph with seven steps and icons powerpoint template slide. Graphic of bar graph with seven steps and icons has been used to craft this power point template diagram. This PPT diagram contains the concept of data representation. Use this PPT diagram for business and marketing related presentations.
-
 Mw seven staged bar graph with icons powerpoint template slide
Presenting mw seven staged bar graph with icons powerpoint template slide. Seven staged bar graph and icons has been used to craft this power point template diagram. This PPT diagram contains the concept of business result analysis. Use this PPT diagram for marketing and business related presentation.
-
 Filter Icon Funnel Graph Arrow Dollar Investment Gears Process
This complete presentation has PPT slides on wide range of topics highlighting the core areas of your business needs. It has professionally designed templates with relevant visuals and subject driven content. This presentation deck has total of ten slides. Get access to the customizable templates. Our designers have created editable templates for your convenience. You can edit the colour, text and font size as per your need. You can add or delete the content if required. You are just a click to away to have this ready-made presentation. Click the download button now.
-
 Workforce assessment result icon with bar graph
Presenting our set of slides with Workforce Assessment Result Icon With Bar Graph. This exhibits information on three stages of the process. This is an easy to edit and innovatively designed PowerPoint template. So download immediately and highlight information on Workforce Assessment Result Icon With Bar Graph.
-
 Data Handling Graph Technology Colored Icon In Powerpoint Pptx Png And Editable Eps Format
This colourful PowerPoint icon is perfect for illustrating data handling topics. It features a stack of colourful cubes with a graph and a magnifying glass, ideal for visualizing data analysis and storage.
-
 Data Handling Graph Technology Monotone Icon In Powerpoint Pptx Png And Editable Eps Format
This monotone PowerPoint icon is perfect for representing data handling topics. It features a graph and a magnifying glass, perfect for illustrating data analysis and research. Its a great choice for presentations on data handling, analytics, and research.
-
 Data Validation Graph Colored Icon In Powerpoint Pptx Png And Editable Eps Format
This colourful PowerPoint icon depicts data validation, showing the process of ensuring data accuracy and consistency by verifying and validating it against a set of rules. Its a great visual aid to help explain data validation in presentations.
-
 Data Validation Graph Monotone Icon In Powerpoint Pptx Png And Editable Eps Format
This Monotone PowerPoint Icon is perfect for illustrating data validation. It features a simple, black and white design thats easy to customize and integrate into any presentation. Its a great way to quickly and clearly communicate your message.
-
 Dawn Money Graph Chart Colored Icon In Powerpoint Pptx Png And Editable Eps Format
This powerpoint icon is a bright and colourful design that will add visual appeal to any presentation. It is perfect for adding emphasis to important points and highlighting key messages. It is easy to use and will help bring your presentation to life.
-
 Dawn Money Graph Chart Monotone Icon In Powerpoint Pptx Png And Editable Eps Format
This Monotone PowerPoint icon is perfect for presentations and other projects. It is a simple, yet powerful design that is easy to use and customize. It is a great way to add visual interest to your slides and documents.
-
 Investment Graph Global Economy Colored Icon In Powerpoint Pptx Png And Editable Eps Format
This coloured PowerPoint icon depicts the global economy, with a world map in the background and a graph of economic growth in the foreground. It is a great visual aid to explain the complexities of the global economy and its impact on businesses.
-
 Investment Graph Global Economy Monotone Icon In Powerpoint Pptx Png And Editable Eps Format
This monotone PowerPoint icon is perfect for presentations on the global economy. It features a graph charting the global economic trends and a world map showing the countries involved. It is a great visual representation of the economic forces at work in the world today.
-
 Gold Bar Graph Colored Icon In Powerpoint Pptx Png And Editable Eps Format
This eye-catching gold trading PowerPoint icon is a perfect visual aid for presentations. It features a bright yellow gold bar with a green up arrow, to represent a successful gold trading venture. Use this icon to convey success and prosperity in your presentations.
-
 Gold Bar Graph Monotone Icon In Powerpoint Pptx Png And Editable Eps Format
This Monotone Powerpoint Icon on Gold Trading is a stylish and modern vector graphic that is perfect for presentations related to gold trading. It features a gold bar and coins in a black and white color scheme, giving it a professional and sleek look.
-
 Quantitative Research Icon Showcasing Bar Graph
Presenting our set of slides with Quantitative Research Icon Showcasing Bar Graph. This exhibits information on three stages of the process. This is an easy to edit and innovatively designed PowerPoint template. So download immediately and highlight information on Quantitative Research, Showcasing Bar Graph.
-
 Visual Line Graph Analytics Icon
Presenting our set of slides with Visual Line Graph Analytics Icon. This exhibits information on three stages of the process. This is an easy to edit and innovatively designed PowerPoint template. So download immediately and highlight information on Visual Line Graph, Analytics Icon.
-
 Database Marketing Icon Showcasing Graphs On Laptop
Presenting our set of slides with Database Marketing Icon Showcasing Graphs On Laptop This exhibits information on Three stages of the process. This is an easy to edit and innovatively designed PowerPoint template. So download immediately and highlight information on Database Marketing Icon, Showcasing Graphs On Laptop
-
 Data Visualization Graph Chart Colored Icon In Powerpoint Pptx Png And Editable Eps Format
This coloured PowerPoint icon on Graph Chart is a great way to visually represent data. It is easy to customize and can be used to create stunning visuals for presentations. It is a great tool to help you communicate complex information in a simple and effective way.
-
 Data Visualization Graph Chart Monotone Icon In Powerpoint Pptx Png And Editable Eps Format
This Monotone powerpoint icon on Graph Chart is an ideal choice for presentations, reports, and other documents. It is a simple and effective way to visualize data and make it easier to understand. It is a great tool for data analysis and can be used to compare trends, illustrate relationships, and more.
-
 Network Diagrams Graph Chart Colored Icon In Powerpoint Pptx Png And Editable Eps Format
This coloured PowerPoint icon on Graph Chart is a great way to visually represent data. It is easy to customize and can be used to create stunning visuals for presentations. It is a great tool to help you communicate complex information in a simple and effective way.
-
 Network Diagrams Graph Chart Monotone Icon In Powerpoint Pptx Png And Editable Eps Format
This Monotone powerpoint icon on Graph Chart is an ideal choice for presentations, reports, and other documents. It is a simple and effective way to visualize data and make it easier to understand. It is a great tool for data analysis and can be used to compare trends, illustrate relationships, and more.
-
 Contingency Planning Crisis Graph Colored Icon In Powerpoint Pptx Png And Editable Eps Format
This coloured PowerPoint icon is a visual representation of a crisis situation. It features a graph with a downward arrow, representing a decline, and a bright colour palette to draw attention and emphasize the urgency of the situation. Its perfect for presentations on economic downturns, natural disasters, and other crisis scenarios.
-
 Contingency Planning Crisis Graph Monotone Icon In Powerpoint Pptx Png And Editable Eps Format
This Monotone Powerpoint Icon on Crisis Graph is an essential tool for businesses to help them identify and understand the impact of crises on their operations. It provides a visual representation of the current state of the organization and the potential risks associated with the crisis. It is easy to use and can be used to create a comprehensive report to help guide business decisions.
-
 Crisis Communication Crisis Graph Colored Icon In Powerpoint Pptx Png And Editable Eps Format
This coloured PowerPoint icon is a visual representation of a crisis situation. It features a graph with a downward arrow, representing a decline, and a bright colour palette to draw attention and emphasize the urgency of the situation. Its perfect for presentations on economic downturns, natural disasters, and other crisis scenarios.
-
 Crisis Communication Crisis Graph Monotone Icon In Powerpoint Pptx Png And Editable Eps Format
This Monotone Powerpoint Icon on Crisis Graph is an essential tool for businesses to help them identify and understand the impact of crises on their operations. It provides a visual representation of the current state of the organization and the potential risks associated with the crisis. It is easy to use and can be used to create a comprehensive report to help guide business decisions.
-
 Crisis Graph With Arrow Colored Icon In Powerpoint Pptx Png And Editable Eps Format
This coloured PowerPoint icon is a visual representation of a crisis situation. It features a graph with a downward arrow, representing a decline, and a bright colour palette to draw attention and emphasize the urgency of the situation. Its perfect for presentations on economic downturns, natural disasters, and other crisis scenarios.
-
 Crisis Graph With Arrow Monotone Icon In Powerpoint Pptx Png And Editable Eps Format
This Monotone Powerpoint Icon on Crisis Graph is an essential tool for businesses to help them identify and understand the impact of crises on their operations. It provides a visual representation of the current state of the organization and the potential risks associated with the crisis. It is easy to use and can be used to create a comprehensive report to help guide business decisions.
-
 Crisis Management Graph Colored Icon In Powerpoint Pptx Png And Editable Eps Format
This coloured PowerPoint icon is a visual representation of a crisis situation. It features a graph with a downward arrow, representing a decline, and a bright colour palette to draw attention and emphasize the urgency of the situation. Its perfect for presentations on economic downturns, natural disasters, and other crisis scenarios.
-
 Crisis Management Graph Monotone Icon In Powerpoint Pptx Png And Editable Eps Format
This Monotone Powerpoint Icon on Crisis Graph is an essential tool for businesses to help them identify and understand the impact of crises on their operations. It provides a visual representation of the current state of the organization and the potential risks associated with the crisis. It is easy to use and can be used to create a comprehensive report to help guide business decisions.
-
 Disaster Planning Crisis Graph Colored Icon In Powerpoint Pptx Png And Editable Eps Format
This coloured PowerPoint icon is a visual representation of a crisis situation. It features a graph with a downward arrow, representing a decline, and a bright colour palette to draw attention and emphasize the urgency of the situation. Its perfect for presentations on economic downturns, natural disasters, and other crisis scenarios.
-
 Disaster Planning Crisis Graph Monotone Icon In Powerpoint Pptx Png And Editable Eps Format
This Monotone Powerpoint Icon on Crisis Graph is an essential tool for businesses to help them identify and understand the impact of crises on their operations. It provides a visual representation of the current state of the organization and the potential risks associated with the crisis. It is easy to use and can be used to create a comprehensive report to help guide business decisions.
-
 Down Crisis Graph Colored Icon In Powerpoint Pptx Png And Editable Eps Format
This coloured PowerPoint icon is a visual representation of a crisis situation. It features a graph with a downward arrow, representing a decline, and a bright colour palette to draw attention and emphasize the urgency of the situation. Its perfect for presentations on economic downturns, natural disasters, and other crisis scenarios.
-
 Down Crisis Graph Monotone Icon In Powerpoint Pptx Png And Editable Eps Format
This Monotone Powerpoint Icon on Crisis Graph is an essential tool for businesses to help them identify and understand the impact of crises on their operations. It provides a visual representation of the current state of the organization and the potential risks associated with the crisis. It is easy to use and can be used to create a comprehensive report to help guide business decisions.
-
 Economy Crisis Down Graph Colored Icon In Powerpoint Pptx Png And Editable Eps Format
This coloured PowerPoint icon is a visual representation of a crisis situation. It features a graph with a downward arrow, representing a decline, and a bright colour palette to draw attention and emphasize the urgency of the situation. Its perfect for presentations on economic downturns, natural disasters, and other crisis scenarios.
-
 Economy Crisis Down Graph Monotone Icon In Powerpoint Pptx Png And Editable Eps Format
This Monotone Powerpoint Icon on Crisis Graph is an essential tool for businesses to help them identify and understand the impact of crises on their operations. It provides a visual representation of the current state of the organization and the potential risks associated with the crisis. It is easy to use and can be used to create a comprehensive report to help guide business decisions.
-
 Economy Crisis Graph Colored Icon In Powerpoint Pptx Png And Editable Eps Format
This coloured PowerPoint icon is a visual representation of a crisis situation. It features a graph with a downward arrow, representing a decline, and a bright colour palette to draw attention and emphasize the urgency of the situation. Its perfect for presentations on economic downturns, natural disasters, and other crisis scenarios.
-
 Economy Crisis Graph Monotone Icon In Powerpoint Pptx Png And Editable Eps Format
This Monotone Powerpoint Icon on Crisis Graph is an essential tool for businesses to help them identify and understand the impact of crises on their operations. It provides a visual representation of the current state of the organization and the potential risks associated with the crisis. It is easy to use and can be used to create a comprehensive report to help guide business decisions.
-
 Emergency Management Crisis Graph Colored Icon In Powerpoint Pptx Png And Editable Eps Format
This coloured PowerPoint icon is a visual representation of a crisis situation. It features a graph with a downward arrow, representing a decline, and a bright colour palette to draw attention and emphasize the urgency of the situation. Its perfect for presentations on economic downturns, natural disasters, and other crisis scenarios.
-
 Emergency Management Crisis Graph Monotone Icon In Powerpoint Pptx Png And Editable Eps Format
This Monotone Powerpoint Icon on Crisis Graph is an essential tool for businesses to help them identify and understand the impact of crises on their operations. It provides a visual representation of the current state of the organization and the potential risks associated with the crisis. It is easy to use and can be used to create a comprehensive report to help guide business decisions.
-
 Finance Crisis Graph Colored Icon In Powerpoint Pptx Png And Editable Eps Format
This coloured PowerPoint icon is a visual representation of a crisis situation. It features a graph with a downward arrow, representing a decline, and a bright colour palette to draw attention and emphasize the urgency of the situation. Its perfect for presentations on economic downturns, natural disasters, and other crisis scenarios.
-
 Finance Crisis Graph Monotone Icon In Powerpoint Pptx Png And Editable Eps Format
This Monotone Powerpoint Icon on Crisis Graph is an essential tool for businesses to help them identify and understand the impact of crises on their operations. It provides a visual representation of the current state of the organization and the potential risks associated with the crisis. It is easy to use and can be used to create a comprehensive report to help guide business decisions.
-
 Incident Response Crisis Graph Colored Icon In Powerpoint Pptx Png And Editable Eps Format
This coloured PowerPoint icon is a visual representation of a crisis situation. It features a graph with a downward arrow, representing a decline, and a bright colour palette to draw attention and emphasize the urgency of the situation. Its perfect for presentations on economic downturns, natural disasters, and other crisis scenarios.
-
 Incident Response Crisis Graph Monotone Icon In Powerpoint Pptx Png And Editable Eps Format
This Monotone Powerpoint Icon on Crisis Graph is an essential tool for businesses to help them identify and understand the impact of crises on their operations. It provides a visual representation of the current state of the organization and the potential risks associated with the crisis. It is easy to use and can be used to create a comprehensive report to help guide business decisions.
-
 Online Crisis Graph Colored Icon In Powerpoint Pptx Png And Editable Eps Format
This coloured PowerPoint icon is a visual representation of a crisis situation. It features a graph with a downward arrow, representing a decline, and a bright colour palette to draw attention and emphasize the urgency of the situation. Its perfect for presentations on economic downturns, natural disasters, and other crisis scenarios.
-
 Online Crisis Graph Monotone Icon In Powerpoint Pptx Png And Editable Eps Format
This Monotone Powerpoint Icon on Crisis Graph is an essential tool for businesses to help them identify and understand the impact of crises on their operations. It provides a visual representation of the current state of the organization and the potential risks associated with the crisis. It is easy to use and can be used to create a comprehensive report to help guide business decisions.
-
 Risk Analysis Crisis Graph Colored Icon In Powerpoint Pptx Png And Editable Eps Format
This coloured PowerPoint icon is a visual representation of a crisis situation. It features a graph with a downward arrow, representing a decline, and a bright colour palette to draw attention and emphasize the urgency of the situation. Its perfect for presentations on economic downturns, natural disasters, and other crisis scenarios.
-
 Risk Analysis Crisis Graph Monotone Icon In Powerpoint Pptx Png And Editable Eps Format
This Monotone Powerpoint Icon on Crisis Graph is an essential tool for businesses to help them identify and understand the impact of crises on their operations. It provides a visual representation of the current state of the organization and the potential risks associated with the crisis. It is easy to use and can be used to create a comprehensive report to help guide business decisions.


