Powerpoint Templates and Google slides for Graph Highlighting
Save Your Time and attract your audience with our fully editable PPT Templates and Slides.
-
 Comprehensive Guide To Understand Graph Highlighting Bitcoin Mining Reward Trends Fin SS
This slide shows information regrading the rewards earned by miners for adding blocks to blockchain on mining each successful block. It also includes reasons for decreasing Bitcoin reward value. Deliver an outstanding presentation on the topic using this Comprehensive Guide To Understand Graph Highlighting Bitcoin Mining Reward Trends Fin SS. Dispense information and present a thorough explanation of Blocks To Blockchain, Bitcoin Reward Value, Graph Highlighting Bitcoin, Mining Reward Trends using the slides given. This template can be altered and personalized to fit your needs. It is also available for immediate download. So grab it now.
-
 Comprehensive Guide To Understand Graph Highlighting Bitcoin Price Fluctuations Fin SS
This slide shows information regarding the bitcoin price changes over the years along with the key reasons for rise and fall in price. It also includes details about impact of Covid-19 on Bitcoin. Present the topic in a bit more detail with this Comprehensive Guide To Understand Graph Highlighting Bitcoin Price Fluctuations Fin SS. Use it as a tool for discussion and navigation on Bitcoin Price Fluctuations, Institutional Adoption, Acceptance Bitcoin, Bitcoin Price Touches. This template is free to edit as deemed fit for your organization. Therefore download it now.
-
 Graph Highlighting AI Copilot Statistics
This slide showcases the graph illustrating artificial intelligence copilot statistics which helps an organization to unify enterprise systems and reduce operational costs. It include details such as enhances efficiency, improves smoother information flow, etc. Introducing our Graph Highlighting AI Copilot Statistics set of slides. The topics discussed in these slides are Graph Highlighting, Copilot Statistics This is an immediately available PowerPoint presentation that can be conveniently customized. Download it and convince your audience.
-
 Graph Highlighting Adverse Customer Services Used By Industries
This slide showcases the statistical graph illustrating unsatisfactory customers services employed by various industries which helps an organization to gain effective market insights. It include details such as telecommunications, healthcare, insurance, airlines, etc. Presenting our well structured Graph Highlighting Adverse Customer Services Used By Industries The topics discussed in this slide are Customer Services, Manual Procedures. This is an instantly available PowerPoint presentation that can be edited conveniently. Download it right away and captivate your audience.
-
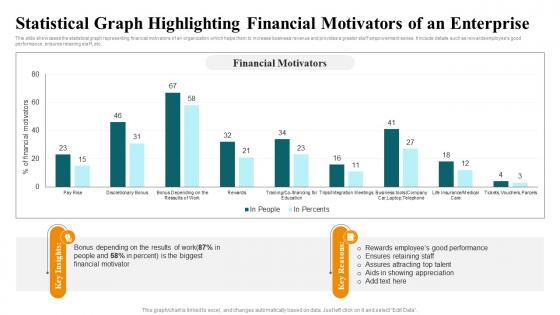 Statistical Graph Highlighting Financial Motivators Of An Enterprise
This slide showcases the statistical graph representing financial motivators of an organization which helps them to increase business revenue and provides a greater staff empowerment sense. It include details such as rewards employees good performance, ensures retaining staff, etc. Introducing our Statistical Graph Highlighting Financial Motivators Of An Enterprise set of slides. The topics discussed in these slides are Financial Motivators, Key Insights, Key Reasons.This is an immediately available PowerPoint presentation that can be conveniently customized. Download it and convince your audience.
-
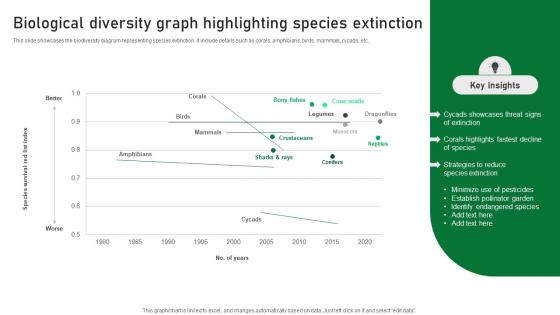 Biological Diversity Graph Highlighting Species Extinction
This slide showcases the biodiversity diagram representing species extinction. It include details such as corals,amphibians,birds,mammals,cycads,etc. Introducing our Biological Diversity Graph Highlighting Species Extinction set of slides. The topics discussed in these slides are Threat Signs Of Extinction,Fastest Decline Of Species,Reduce Species Extinction. This is an immediately available PowerPoint presentation that can be conveniently customized. Download it and convince your audience.
-
 Statistical Graph Highlighting Healthcare Adoption Of Blockchain
This slide showcases the statistical graph representing health industry adoption of blockchain which helps an organization to optimize supply chain and ensure drug traceability. It include details such as ensure strategic planning, assure technological innovation, etc. Introducing our Statistical Graph Highlighting Healthcare Adoption Of Blockchain set of slides. The topics discussed in these slides are Statistical Graph Highlighting, Healthcare Adoption Of Blockchain. This is an immediately available PowerPoint presentation that can be conveniently customized. Download it and convince your audience.
-
 Graph Highlighting Gender Diversity Importance For Innovation Efforts
This slide showcases the statistical graph representing gender diversity importance for business innovation efforts. It include details such as financial director, etc. Introducing our Graph Highlighting Gender Diversity Importance For Innovation Efforts set of slides. The topics discussed in these slides are Key Insights,Management Leaders,Financial Director. This is an immediately available PowerPoint presentation that can be conveniently customized. Download it and convince your audience.
-
 Statistical Graph Highlighting Business Performance Product Bundling Strategies To Enhance
Mentioned slide displays company revenue and net profit over the years to determine and analyse current business situations. Present the topic in a bit more detail with this Statistical Graph Highlighting Business Performance Product Bundling Strategies To Enhance. Use it as a tool for discussion and navigation on Statistical Graph Highlighting, Business Performance, Current Business Situations. This template is free to edit as deemed fit for your organization. Therefore download it now.
-
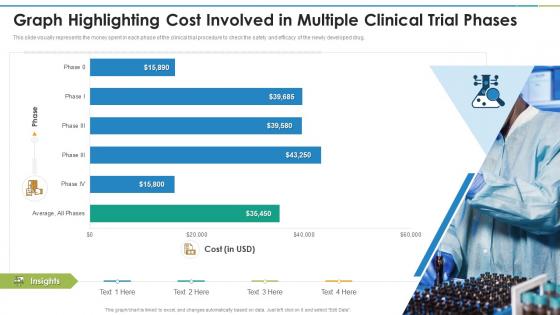 Graph Highlighting Cost Involved In Multiple Clinical Trial Phases
This slide visually represents the money spent in each phase of the clinical trial procedure to check the safety and efficacy of the newly developed drug. Deliver an outstanding presentation on the topic using this Graph Highlighting Cost Involved In Multiple Clinical Trial Phases. Dispense information and present a thorough explanation of Graph Highlighting Cost Involved In Multiple Clinical Trial Phases using the slides given. This template can be altered and personalized to fit your needs. It is also available for immediate download. So grab it now.
-
 Graph Highlighting Yearly Global Trends For FMCG Sector
Presenting our well structured Graph Highlighting Yearly Global Trends For FMCG Sector. The topics discussed in this slide are Market Size, Sector Composition, Retail Market. This is an instantly available PowerPoint presentation that can be edited conveniently. Download it right away and captivate your audience.
-
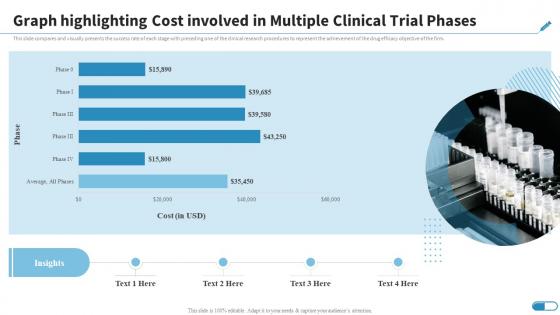 Research Design For Clinical Trials Graph Highlighting Cost Involved In Multiple Clinical Trial Phases
This slide compares and visually presents the success rate of each stage with preceding one of the clinical research procedures to represent the achievement of the drug efficacy objective of the firm. Deliver an outstanding presentation on the topic using this Research Design For Clinical Trials Graph Highlighting Cost Involved In Multiple Clinical Trial Phases. Dispense information and present a thorough explanation of Graph Highlighting Cost Involved, Multiple Clinical Trial Phases using the slides given. This template can be altered and personalized to fit your needs. It is also available for immediate download. So grab it now.
-
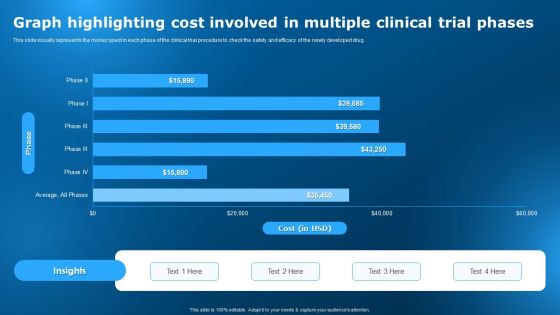 Clinical Research Trial Stages Graph Highlighting Cost Involved In Multiple Clinical Trial Phases
This slide visually represents the money spent in each phase of the clinical trial procedure to check the safety and efficacy of the newly developed drug.Present the topic in a bit more detail with this Clinical Research Trial Stages Graph Highlighting Cost Involved In Multiple Clinical Trial Phases. Use it as a tool for discussion and navigation on Graph Highlighting, Cost Involved, Multiple Clinical Trial. This template is free to edit as deemed fit for your organization. Therefore download it now.
-
 Graph Highlighting Industrial Relation Disputes For Different Years
This slide covers graph which shows strikes and Lockouts from the period of 2017 to 2021. This slide highlights strikes and Lockouts are the top main reasons for poor industrial relations. Introducing our Graph Highlighting Industrial Relation Disputes For Different Years set of slides. The topics discussed in these slides are Graph Highlighting, Industrial Relation Disputes, Different Years. This is an immediately available PowerPoint presentation that can be conveniently customized. Download it and convince your audience.
-
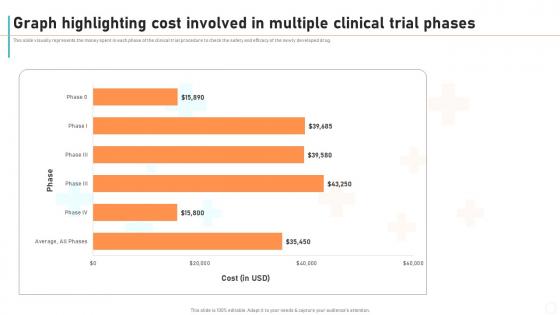 New Drug Development Process Graph Highlighting Cost Involved In Multiple Clinical Trial Phases
This slide visually represents the money spent in each phase of the clinical trial procedure to check the safety and efficacy of the newly developed drug. Deliver an outstanding presentation on the topic using this New Drug Development Process Graph Highlighting Cost Involved In Multiple Clinical Trial Phases. Dispense information and present a thorough explanation of Graph Highlighting, Clinical Trial Phases, Involved using the slides given. This template can be altered and personalized to fit your needs. It is also available for immediate download. So grab it now.
-
 Bar graph to highlight financial growth good ppt example
Presenting bar graph to highlight financial growth good ppt example. This is a bar graph to highlight financial growth good ppt example. This is a five stage process. The stages in this process are business, bar graph, finance, marketing, growth, strategy, success.
-
 Bar graph showing sales and gross profit margin highlights
Presenting bar graph showing sales and gross profit margin highlights. This is a bar graph showing sales and gross profit margin highlights. This is a three stage process. The stages in this process are gross profit, gross benefit, gross margin.
-
 Change heading to key highlights with graph dollar bag briefcase image
Presenting this set of slides with name - Change Heading To Key Highlights With Graph Dollar Bag Briefcase Image. This is a five stage process. The stages in this process are Key Highlights, Key Finding, Key Points.
-
 Key business highlights with dollar graph and handshake image
Presenting this set of slides with name - Key Business Highlights With Dollar Graph And Handshake Image. This is a four stage process. The stages in this process are Key Highlights, Key Finding, Key Points.
-
 Key highlights infograph with graph screen and bulb image
Presenting this set of slides with name - Key Highlights Infograph With Graph Screen And Bulb Image. This is a seven stage process. The stages in this process are Key Highlights, Key Finding, Key Points.
-
 Analysis with bar graph pie chart key factors highlighting business analytics
Presenting analysis with bar graph pie chart key factors highlighting business analytics. This is a analysis with bar graph pie chart key factors highlighting business analytics. This is a two stage process. The stages in this process are analysis, audit, investigation.
-
 Analysis with magnifying glass bar graph chart highlighting business analytics
Presenting analysis with magnifying glass bar graph chart highlighting business analytics. This is a analysis with magnifying glass bar graph chart highlighting business analytics. This is a three stage process. The stages in this process are analysis, audit, investigation.
-
 Financial highlight graphs with net sales and growth
Presenting this set of slides with name Financial Highlight Graphs With Net Sales And Growth. The topics discussed in these slide is Financial Highlight Graphs With Net Sales And Growth. This is a completely editable PowerPoint presentation and is available for immediate download. Download now and impress your audience.
-
 Sales profit and gross margin financial highlights graphs
Presenting this set of slides with name Sales Profit And Gross Margin Financial Highlights Graphs. The topics discussed in these slide is Sales Profit And Gross Margin Financial Highlights Graphs. This is a completely editable PowerPoint presentation and is available for immediate download. Download now and impress your audience.
-
 Project highlights graph of company total assets and net assets
Presenting this set of slides with name Project Highlights Graph Of Company Total Assets And Net Assets. The topics discussed in these slides are Project Highlights, Graph Of Company, Total Assets And Net Assets. This is a completely editable PowerPoint presentation and is available for immediate download. Download now and impress your audience.
-
 Bar graph highlighting positive financial performance
Presenting this set of slides with name Bar Graph Highlighting Positive Financial Performance. This is a three stage process. The stages in this process are Bar Graph Highlighting Positive Financial Performance. This is a completely editable PowerPoint presentation and is available for immediate download. Download now and impress your audience.
-
 Bar graph highlighting ecommerce business technology trends
Presenting this set of slides with name Bar Graph Highlighting Ecommerce Business Technology Trends. The topics discussed in these slides are Marketing, Analytics, Fraud Prevention. This is a completely editable PowerPoint presentation and is available for immediate download. Download now and impress your audience.
-
 Bar graph highlighting business budget allocation and utilization
Presenting this set of slides with name Bar Graph Highlighting Business Budget Allocation And Utilization. The topics discussed in these slides are Budget, Utilization, Performance. This is a completely editable PowerPoint presentation and is available for immediate download. Download now and impress your audience.
-
 Website visitors are highlighted on bar graph using age demographic
Presenting this set of slides with name Website Visitors Are Highlighted On Bar Graph Using Age Demographic. The topics discussed in these slide is Website Visitors Are Highlighted On Bar Graph Using Age Demographic. This is a completely editable PowerPoint presentation and is available for immediate download. Download now and impress your audience.
-
 3 axis bar graph highlighting quarterly and yearly sales
Presenting this set of slides with name 3 Axis Bar Graph Highlighting Quarterly And Yearly Sales. The topics discussed in these slide is 3 Axis Bar Graph Highlighting Quarterly And Yearly Sales. This is a completely editable PowerPoint presentation and is available for immediate download. Download now and impress your audience.
-
 Financial highlights graph chart powerpoint presentation brochure
Here the company can provide the financial highlights covering turnover, net assets and EBITA. Presenting this set of slides with name Financial Highlights Graph Chart Powerpoint Presentation Brochure. The topics discussed in these slides are Financial Highlights. This is a completely editable PowerPoint presentation and is available for immediate download. Download now and impress your audience.
-
 Graph highlighting us marine corps yearly attrition rate
Introducing our Graph Highlighting US Marine Corps Yearly Attrition Rate set of slides. The topics discussed in these slides are Graph Highlighting US Marine Corps Yearly Attrition Rate. This is an immediately available PowerPoint presentation that can be conveniently customized. Download it and convince your audience.
-
 Graph Highlighting Employee Retention Rate Storyboard SS
This slide shows a graph that companies can use to show retention rate trends after implementing the free food program in the organization. It includes retention rate of different departments of organization. Presenting our well structured Graph Highlighting Employee Retention Rate Storyboard SS The topics discussed in this slide are Graph Highlighting, Employee Retention Rate This is an instantly available PowerPoint presentation that can be edited conveniently. Download it right away and captivate your audience.


