Powerpoint Templates and Google slides for Fulfilling Resources
Save Your Time and attract your audience with our fully editable PPT Templates and Slides.
-
 Resource fulfilment powerpoint presentation slides
Presenting this set of slides with name - Resource Fulfilment Powerpoint Presentation Slides. This aptly crafted editable PPT deck contains fifteen slides. Our topic specific Resource Fulfilment Powerpoint Presentation Slides deck helps devise the topic with a clear approach. We offer a wide range of custom made slides with all sorts of relevant charts and graphs, overviews, topics subtopics templates, and analysis templates. Speculate, discuss, design or demonstrate all the underlying aspects with zero difficulty. This deck also consists creative and professional looking slides of all sorts to achieve the target of a presentation effectively. You can present it individually or as a team working in any company organization.
-
 Fulfillment Center Optimization Introducing Strategies For Optimal Utilization Of Warehouse Resources
This slide presents an overview of warehouse effective resource optimization. It addresses areas such as, enhance space utilization, optimize the use of equipment and increase labor productivity. Introducing Fulfillment Center Optimization Introducing Strategies For Optimal Utilization Of Warehouse Resources to increase your presentation threshold. Encompassed with Three stages, this template is a great option to educate and entice your audience. Dispence information on Enhance Space Utilization, Use Of Equipment, Increase Labor Productivity using this template. Grab it now to reap its full benefits.
-
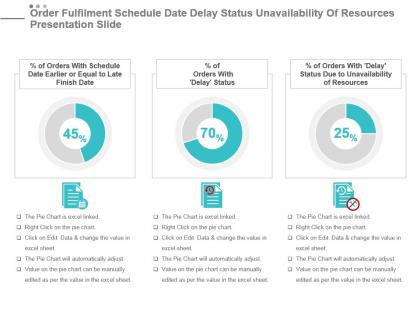
 Order fulfilment schedule date delay status unavailability of resources presentation slide
Presenting order fulfilment schedule date delay status unavailability of resources presentation slide. This presentation slide shows three Key Performance Indicators or KPIs. The first KPI that can be show is percentage of Orders With Schedule Date Earlier or Equal to Late Finish Date. The second KPI is percentage of Orders With Delay Status and the third is percentage of Orders With Delay Status Due to Unavailability of Resources. These KPI Powerpoint graphics are all data driven, and the shape automatically adjusts according to your data. Just right click on the KPI graphic, enter the right value and the shape will adjust automatically. Make a visual impact with our KPI slides.


