Powerpoint Templates and Google slides for Data To Analyze
Save Your Time and attract your audience with our fully editable PPT Templates and Slides.
-
 Marketing Analytics Guide To Measure Analyze And Manage Data Complete Deck
Deliver this complete deck to your team members and other collaborators. Encompassed with stylized slides presenting various concepts, this Marketing Analytics Guide To Measure Analyze And Manage Data Complete Deck is the best tool you can utilize. Personalize its content and graphics to make it unique and thought-provoking. All the sixty five slides are editable and modifiable, so feel free to adjust them to your business setting. The font, color, and other components also come in an editable format making this PPT design the best choice for your next presentation. So, download now.
-
 How to analyze performance data in google search console report edu ppt
Presenting How to analyze performance data in google search console report. These slides are 100 percent made in PowerPoint and are compatible with all screen types and monitors. They also support Google Slides. Premium Customer Support available. Suitable for use by managers, employees, and organizations. These slides are easily customizable. You can edit the color, text, icon, and font size to suit your requirements.
-
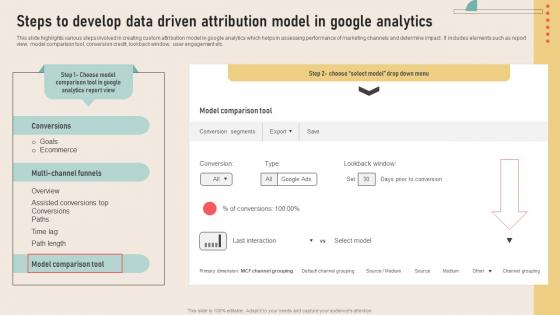 Analyzing Marketing Attribution Steps To Develop Data Driven Attribution Model In Google Analytics
This slide highlights various steps involved in creating custom attribution model in google analytics which helps in assessing performance of marketing channels and determine impact . It includes elements such as report view, model comparison tool, conversion credit, lookback window, user engagement etc. Present the topic in a bit more detail with thisAnalyzing Marketing Attribution Steps To Develop Data Driven Attribution Model In Google Analytics Use it as a tool for discussion and navigation on Determine Objectives, Procure Administrative Support, Gather Information This template is free to edit as deemed fit for your organization. Therefore download it now.
-
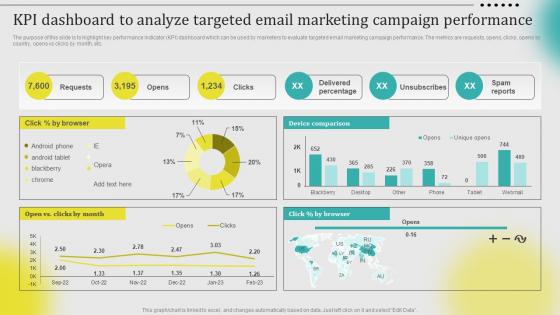 KPI Dashboard To Analyze Targeted Email Marketing Campaign Leveraging Customer Data MKT SS V
The purpose of this slide is to highlight key performance indicator KPI dashboard which can be used by marketers to evaluate targeted email marketing campaign performance. The metrics are requests, opens, clicks, opens by country, opens vs clicks by month, etc. Present the topic in a bit more detail with this KPI Dashboard To Analyze Targeted Email Marketing Campaign Leveraging Customer Data MKT SS V. Use it as a tool for discussion and navigation on Device Comparison, Browser. This template is free to edit as deemed fit for your organization. Therefore download it now.
-
 Aiops Process Flowchart For Collecting Organizing And Analyzing Data Introduction To Aiops AI SS V
The following slide depicts the working of AIOps to administer IT operations at larger scale. It includes elements such as public network, cloud provider, collect, organize, analyse, infuse, log monitoring, event correlation, ticketing, etc. Deliver an outstanding presentation on the topic using this Aiops Process Flowchart For Collecting Organizing And Analyzing Data Introduction To Aiops AI SS V. Dispense information and present a thorough explanation of Public Network, Cloud Provider using the slides given. This template can be altered and personalized to fit your needs. It is also available for immediate download. So grab it now.
-
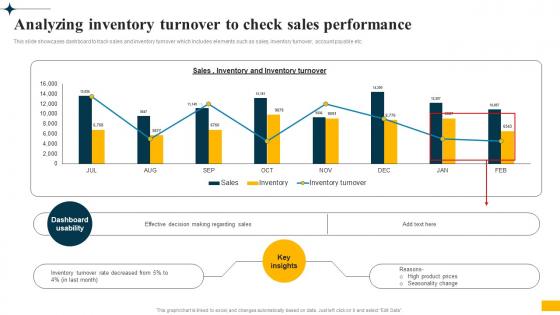 Implementing Big Data Analytics Analyzing Inventory Turnover To Check Sales Performance CRP DK SS
This slide showcases dashboard to track sales and inventory turnover which includes elements such as sales, inventory turnover, account payable etc. Deliver an outstanding presentation on the topic using this Implementing Big Data Analytics Analyzing Inventory Turnover To Check Sales Performance CRP DK SS. Dispense information and present a thorough explanation of Dashboard To Track Sales, Inventory Turnover, Sales Performance, Inventory Turnover Rate using the slides given. This template can be altered and personalized to fit your needs. It is also available for immediate download. So grab it now.
-
 Implementing Big Data Analytics Analyzing Stockout Rate To Identify Loss In Sales CRP DK SS
This slide showcases dashboard to monitor product stockout levels and identify reasons such as ineffective forecasting, late delivery, product quality issues etc. Present the topic in a bit more detail with this Implementing Big Data Analytics Analyzing Stockout Rate To Identify Loss In Sales CRP DK SS. Use it as a tool for discussion and navigation on Dashboard To Monitor Product, Stockout Levels And Identify Reasons, Ineffective Forecasting. This template is free to edit as deemed fit for your organization. Therefore download it now.
-
 KPI Dashboard To Analyze Overall Using Customer Data To Improve MKT SS V
The purpose of this slide is to highlight dashboard through which marketers can evaluate success of targeted marketing strategies on company performance. It covers major metrics such as branded search, customer value, advertising budget, website conversion rate, etc. Deliver an outstanding presentation on the topic using this KPI Dashboard To Analyze Overall Using Customer Data To Improve MKT SS V. Dispense information and present a thorough explanation of Analyze, Business, Performance using the slides given. This template can be altered and personalized to fit your needs. It is also available for immediate download. So grab it now.
-
 KPI Dashboard To Analyze Targeted Email Using Customer Data To Improve MKT SS V
The purpose of this slide is to highlight key performance indicator KPI dashboard which can be used by marketers to evaluate targeted email marketing campaign performance. The metrics are requests, opens, clicks, opens by country, opens vs clicks by month, etc. Present the topic in a bit more detail with this KPI Dashboard To Analyze Targeted Email Using Customer Data To Improve MKT SS V. Use it as a tool for discussion and navigation on Targeted, Email, Campaign. This template is free to edit as deemed fit for your organization. Therefore download it now.
-
 Implementing Workforce Analytics Analyzing Staff Absenteeism Rate To Evaluate Quality Data Analytics SS
This slide showcases dashboard for assessing workplace absenteeism rate which helps in reducing cost of absence and improve business productivity. It provides information regarding absenteeism rate, total unproductive hours, sick days, cost of sick leaves etc. Deliver an outstanding presentation on the topic using this Implementing Workforce Analytics Analyzing Staff Absenteeism Rate To Evaluate Quality Data Analytics SS. Dispense information and present a thorough explanation of Analyzing Staff Absenteeism Rate, Evaluate Quality Of Work, Sick Days, Cost Of Sick Leaves using the slides given. This template can be altered and personalized to fit your needs. It is also available for immediate download. So grab it now.
-
 Implementing Workforce Analytics Analyzing Workforce Productivity To Identify Data Analytics SS
This slide provides dashboard for tracking employee productivity hours which helps in effective identification of performance gaps and improve problem solving. It provides information regarding lack of staff training, toxic work culture, work overload, uninterrupted work, efficiency etc. Present the topic in a bit more detail with this Implementing Workforce Analytics Analyzing Workforce Productivity To Identify Data Analytics SS. Use it as a tool for discussion and navigation on Tracking Employee Productivity, Performance Gaps, Lack Of Staff Training, Toxic Work Culture. This template is free to edit as deemed fit for your organization. Therefore download it now.
-
 Dashboard To Analyze Customer Churn In Implementing Data Analytics To Enhance Telecom Data Analytics SS
This slide showcases dashboard for tracking customer attrition rate in telecom business and identify reasons for high churn. It provides information regarding dashboard usability, churn rate by gender, by city, phone vs internet service, business revenue, customer journey etc. Deliver an outstanding presentation on the topic using this Dashboard To Analyze Customer Churn In Implementing Data Analytics To Enhance Telecom Data Analytics SS. Dispense information and present a thorough explanation of Key Insights, Dashboard Usability, Churn Customers using the slides given. This template can be altered and personalized to fit your needs. It is also available for immediate download. So grab it now.
-
 Mdr Dashboard To Analyze And Enhance Data Cybersecurity
This slide represents dashboard that helps companies to monitor and analyze various threats and enhance their cybersecurity, it includes various elements such as active investigations, pending response, hunt outcomes, most mitigated threats, etc. Introducing our Mdr Dashboard To Analyze And Enhance Data Cybersecurity set of slides. The topics discussed in these slides are Dashboard, Analyze, Data Cybersecurity. This is an immediately available PowerPoint presentation that can be conveniently customized. Download it and convince your audience.
-
 Deploying Techniques For Analyzing Various Research Methods To Collect Data
Following slide represents methods to collect information using desk research approach. It includes methods such as internet, business information sources and government agencies. Increase audience engagement and knowledge by dispensing information using Deploying Techniques For Analyzing Various Research Methods To Collect Data. This template helps you present information on three stages. You can also present information on Business Information Sources, Government Agencies using this PPT design. This layout is completely editable so personaize it now to meet your audiences expectations.
-
 Deploying Techniques For Analyzing Delphi Method Questionnaire To Gather Data
Following slide illustrates use of delphi method to gather accurate information from experts. It further covers project overview, type of questions and conclusion. Increase audience engagement and knowledge by dispensing information using Deploying Techniques For Analyzing Delphi Method Questionnaire To Gather Data. This template helps you present information on one stages. You can also present information on Medical Facilitates, Improve Efficiency using this PPT design. This layout is completely editable so personaize it now to meet your audiences expectations.
-
 Deploying Techniques For Analyzing Survey Form To Collect Accurate Data
Following slide shows customer satisfaction survey to collect information about factors influencing business product sales. Survey questions are related to prices, shopping preferences, product quality etc. Present the topic in a bit more detail with this Deploying Techniques For Analyzing Survey Form To Collect Accurate Data. Use it as a tool for discussion and navigation on Strongly Agree, Neutral, Disagree. This template is free to edit as deemed fit for your organization. Therefore download it now.
-
 Steps To Analyze Business Sales Data Trade Marketing Plan To Increase Market Share Strategy SS
This slide provides an overview of the sales data analysis process to determine the companys performance. Major steps covered are determining objectives, developing reporting system and implementing changes. Introducing Steps To Analyze Business Sales Data Trade Marketing Plan To Increase Market Share Strategy SS to increase your presentation threshold. Encompassed with three stages, this template is a great option to educate and entice your audience. Dispence information on Determine Objectives, Develop A Reporting System, Measure Results And Implement Changes, using this template. Grab it now to reap its full benefits.
-
 Statistical Data To Analyze Need B2b Demand Generation Strategy B2b Demand Generation Strategy
This slide covers need of optimizing demand generation strategies by analyzing statistical data. It involves optimizing right techniques, aligning content with customer journey. Introducing Statistical Data To Analyze Need B2b Demand Generation Strategy B2b Demand Generation Strategy to increase your presentation threshold. Encompassed with four stages, this template is a great option to educate and entice your audience. Dispence information on Statistical, Generation, Strategy, using this template. Grab it now to reap its full benefits.
-
 Applications Of IOT Working Of Aws IOT Analytics To Analyze Data Volume IOT SS
This slide provides an overview of the IoT analytics working to evaluate the amount of data collected. The architecture includes data collection, processing, storage, analysis and building. Deliver an outstanding presentation on the topic using this Applications Of IOT Working Of Aws IOT Analytics To Analyze Data Volume IOT SS Dispense information and present a thorough explanation of Collect, Process, Analyze, Build using the slides given. This template can be altered and personalized to fit your needs. It is also available for immediate download. So grab it now.
-
 Statistical Data To Analyze Need Of Enhancing B2b Demand Generation Strategies
This slide covers need of optimizing demand generation strategies by analyzing statistical data. It involves optimizing right techniques, aligning content with customer journey.Introducing Statistical Data To Analyze Need Of Enhancing B2b Demand Generation Strategies to increase your presentation threshold. Encompassed with four stages, this template is a great option to educate and entice your audience. Dispence information on Generation Techniques, Aligning Content, Qualified Leads, using this template. Grab it now to reap its full benefits.
-
 Statistical Data To Analyze Need Of Enhancing B2b Marketing Strategies To Attract
This slide represents social media marketing techniques that helps marketers to increase engagement rate and traffic on website. It covers comments, giveaways, images, heading optimization etc.Introducing Statistical Data To Analyze Need Of Enhancing B2b Marketing Strategies To Attract to increase your presentation threshold. Encompassed with four stages, this template is a great option to educate and entice your audience. Dispence information on Demand Generation Techniques, Qualified Leads, Marketing Objective, using this template. Grab it now to reap its full benefits.
-
 Analyzing Quarterly Sales Data And Deal Steps To Build And Implement Sales Strategies
This slide provides glimpse about quarter wise sales deals signed and contracted. It includes deal name, contact name, deal stage, deal size, probability, etc. Present the topic in a bit more detail with this Analyzing Quarterly Sales Data And Deal Steps To Build And Implement Sales Strategies. Use it as a tool for discussion and navigation on Quarterly, Sales, Data. This template is free to edit as deemed fit for your organization. Therefore download it now.
-
 Prompt To Analyze Customer Sentiment Based On Specific Data Strategies For Using ChatGPT SS V
This slide represents details related to best ChatGPT prompts for customer services which helps in producing accurate and relevant responses. It includes details related to prompt for analyzing customer sentiment based on specific data. Increase audience engagement and knowledge by dispensing information using Prompt To Analyze Customer Sentiment Based On Specific Data Strategies For Using ChatGPT SS V This template helps you present information on six stages. You can also present information on Key Insights, Consumer Feedback, Customer Service using this PPT design. This layout is completely editable so personaize it now to meet your audiences expectations.
-
 5 Steps To Analyze Qualitative Data Efficiently
This slide represents the steps enabling businesses to analyze qualitative data effectively to gain relevant insights into research. It includes various steps such as arranging data, organizing data, setting code, data validation and conclusion. Presenting our set of slides with 5 Steps To Analyze Qualitative Data Efficiently This exhibits information on five stages of the process. This is an easy to edit and innovatively designed PowerPoint template. So download immediately and highlight information on Arrange Data, Organize Data, Data Validation, Conclusion
-
 Approaches To Analyze Qualitative Data Effectively
This slide focuses on different approaches that helps companies to effectively analyze various qualitative data collected by researchers. It includes approaches such as content analysis, thematic analysis, textual analysis, etc. Introducing our premium set of slides with Approaches To Analyze Qualitative Data Effectively Ellicudate the one stage and present information using this PPT slide. This is a completely adaptable PowerPoint template design that can be used to interpret topics like Content Analysis, Thematic Analysis, Textual Analysis So download instantly and tailor it with your information.
-
 Qualitative Data Research Icon To Analyze Consumer Behavior
Introducing our premium set of slides with Qualitative Data Research Icon To Analyze Consumer Behavior Ellicudate the three stages and present information using this PPT slide. This is a completely adaptable PowerPoint template design that can be used to interpret topics like Qualitative Data Research, Icon To Analyze, Consumer Behavior So download instantly and tailor it with your information.
-
 Introduction To Predictive Data Analytics Technique Analyzing Data Generated By IoT Devices
This slide provides an overview and explanation of how predictive data analytics works, including the use of statistical modeling and analysis of historical and current data to make predictions about future outcomes. Present the topic in a bit more detail with this Introduction To Predictive Data Analytics Technique Analyzing Data Generated By IoT Devices. Use it as a tool for discussion and navigation on Introduction To Predictive, Data Analytics Technique Analyzing. This template is free to edit as deemed fit for your organization. Therefore download it now.
-
 Steps To Analyze Qualitative Research Methods Data
The purpose of this slide is to showcase steps for analyze qualitative research data in order to derive useful insights. It includes various stages such as data arrangement, data organization, code assignment etc. Presenting our set of slides with Steps To Analyze Qualitative Research Methods Data. This exhibits information on five stages of the process. This is an easy to edit and innovatively designed PowerPoint template. So download immediately and highlight information on Data Arrangement, Data Organization,Code Assignment.
-
 Big Data Types Analyzed To Drive Valuable Insights Big Data Analytics Applications Data Analytics SS
This slide showcases various types of big data that is used for data analysis which helps in creating deeper insights to enhance business operations. It provides information regarding structure , unstructured and semi structured data. Increase audience engagement and knowledge by dispensing information using Big Data Types Analyzed To Drive Valuable Insights Big Data Analytics Applications Data Analytics SS. This template helps you present information on three stages. You can also present information on Structured, Unstructured, Semi Structured using this PPT design. This layout is completely editable so personaize it now to meet your audiences expectations.
-
 Implementing Workforce Analytics Kpi Metrics To Be Analyzed In Workforce Analytics Data Analytics SS
This slide showcases workforce analytics KPI metrics which can be tracked by business to enhance staff performance and retention rates. It provides information regarding employee engagement, team productivity, operational efficiency and staff monitoring. Introducing Implementing Workforce Analytics Kpi Metrics To Be Analyzed In Workforce Analytics Data Analytics SS to increase your presentation threshold. Encompassed with three stages, this template is a great option to educate and entice your audience. Dispence information on Staff Performance Monitoring, Work Efficiency, Compensation Or Company Culture, Absenteeism Rate, using this template. Grab it now to reap its full benefits.
-
 Statistical Data To Analyze Need Of Enhancing B2B Demand B2B Lead Generation Techniques
This slide covers need of optimizing demand generation strategies by analyzing statistical data. It involves optimizing right techniques, aligning content with customer journey. Increase audience engagement and knowledge by dispensing information using Statistical Data To Analyze Need Of Enhancing B2B Demand B2B Lead Generation Techniques. This template helps you present information on Four stages. You can also present information on IB2b Marketers Optimize, Demand Generation Techniques, B2B Revenue Leader using this PPT design. This layout is completely editable so personaize it now to meet your audiences expectations.
-
 Big Data Types Analyzed To Drive Valuable Insights Data Driven Insights Big Data Analytics SS V
This slide showcases various types of big data that is used for data analysis which helps in creating deeper insights to enhance business operations. It provides information regarding structure , unstructured and semi structured data. Present the topic in a bit more detail with this Big Data Types Analyzed To Drive Valuable Insights Data Driven Insights Big Data Analytics SS V Use it as a tool for discussion and navigation on Structured, Unstructured, Semi Structured This template is free to edit as deemed fit for your organization. Therefore download it now.
-
 Digital Marketing Techniques Steps To Analyze Business Sales Data Strategy SS V
This slide provides an overview of the sales data analysis process to determine the companys performance. Major steps covered are determining objectives, developing reporting system and implementing changes. Increase audience engagement and knowledge by dispensing information using Digital Marketing Techniques Steps To Analyze Business Sales Data Strategy SS V This template helps you present information on Three stages. You can also present information on Determine Objectives, Develop A Reporting System, Implement Changes using this PPT design. This layout is completely editable so personaize it now to meet your audiences expectations.
-
 KPI Metrics To Be Analyzed In Healthcare Data Definitive Guide To Implement Data Analytics SS
This slide showcases healthcare data analytics KPI metrics which can be tracked by hospitals to enhance staff performance and patient retention rates. It provides information regarding healthcare revenue, patient engagement and healthcare operations. Introducing KPI Metrics To Be Analyzed In Healthcare Data Definitive Guide To Implement Data Analytics SS to increase your presentation threshold. Encompassed with Three stages, this template is a great option to educate and entice your audience. Dispence information on Healthcare Revenue, Patient Engagement, Healthcare Operations, using this template. Grab it now to reap its full benefits.
-
 Data Sets To Analyze Workplace DEI Performance
This slide represents various data sets to analyze DEI initiative performance at workplace including diversity data, equity data, and inclusion data. Presenting our set of slides with Data Sets To Analyze Workplace DEI Performance This exhibits information on three stages of the process. This is an easy to edit and innovatively designed PowerPoint template. So download immediately and highlight information on Diversity Data, Equity Data, Inclusion Data
-
 A Comprehensive Guide Step 2 Comprehensive Checklist To Analyze Website Structure Data Analytics SS
This slide provides a comprehensive checklist aimed at helping businesses analyse website structure effectively. It covers list of criteria to be fulfilled with tracking mechanism of yes and no. Present the topic in a bit more detail with this A Comprehensive Guide Step 2 Comprehensive Checklist To Analyze Website Structure Data Analytics SS Use it as a tool for discussion and navigation on Traffic Listed And Identified, Higher Bounce Rate, Mobile And Desktop This template is free to edit as deemed fit for your organization. Therefore download it now.
-
 Types Of Data Collected To Analyze Effective Benchmarking Process For Marketing CRP DK SS
This slide showcases types of information gathered for marketing performance analysis such as customer journey , financial, market and campaign data. Introducing Types Of Data Collected To Analyze Effective Benchmarking Process For Marketing CRP DK SS to increase your presentation threshold. Encompassed with four stages, this template is a great option to educate and entice your audience. Dispence information on Customer Journey Data, Financial Data, Market Data, Campaign Data, using this template. Grab it now to reap its full benefits.
-
 Comparison Of Hr Analytics Tools Used To Analyze Complete Guide To Business Analytics Data Analytics SS
This slide showcases comparative assessment between various workforce analytics tools used to effectively track staff performance. It provides information regarding software, features, price, free trial and user ratings. Deliver an outstanding presentation on the topic using this Comparison Of Hr Analytics Tools Used To Analyze Complete Guide To Business Analytics Data Analytics SS. Dispense information and present a thorough explanation of Talent Acquisition And Management, Workforce Planning, Recruitment Need Assessment using the slides given. This template can be altered and personalized to fit your needs. It is also available for immediate download. So grab it now.
-
 Trade Promotion Practices To Increase Steps To Analyze Business Sales Data Strategy SS V
This slide provides an overview of the sales data analysis process to determine the company performance. Major steps covered are determining objectives, developing reporting system and implementing changes. Introducing Trade Promotion Practices To Increase Steps To Analyze Business Sales Data Strategy SS V to increase your presentation threshold. Encompassed with three stages, this template is a great option to educate and entice your audience. Dispence information on Analyze Business Sales Data, Developing Reporting System, Sales Data Analysis Process, using this template. Grab it now to reap its full benefits.
-
 Steps To Analyze Business Sales Data Trade Promotion To Increase Brand Strategy SS V
This slide provides an overview of the sales data analysis process to determine the companys performance. Major steps covered are determining objectives, developing reporting system and implementing changes. Increase audience engagement and knowledge by dispensing information using Steps To Analyze Business Sales Data Trade Promotion To Increase Brand Strategy SS V. This template helps you present information on three stages. You can also present information on Develop A Reporting System, Measure Results And Implement Changes, Determine Objectives using this PPT design. This layout is completely editable so personaize it now to meet your audiences expectations.
-
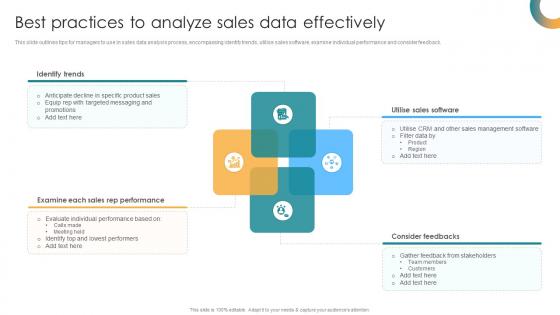 Best Practices To Analyze Sales Data Effectively Sales Coaching Program SA SS
This slide outlines tips for managers to use in sales data analysis process, encompassing identify trends, utilise sales software, examine individual performance and consider feedback. Increase audience engagement and knowledge by dispensing information using Best Practices To Analyze Sales Data Effectively Sales Coaching Program SA SS. This template helps you present information on four stages. You can also present information on Utilise Sales Software, Examine Each Sales Rep Performance, Sales Data Effectively using this PPT design. This layout is completely editable so personaize it now to meet your audiences expectations.
-
 Tool 1 Altair For Analyzing Complex Implementing Data Analytics To Enhance Telecom Data Analytics SS
This slide showcases telecom analytics tools used for tracking performance inefficiencies and analyzing huge datasets. It provides information regarding software overview, features offered, free trial, pricing etc. Increase audience engagement and knowledge by dispensing information using Tool 1 Altair For Analyzing Complex Implementing Data Analytics To Enhance Telecom Data Analytics SS. This template helps you present information on eight stages. You can also present information on Customizable Dashboards, Real Time Analytics, Profitability Analysis using this PPT design. This layout is completely editable so personaize it now to meet your audiences expectations.
-
 Optimizing Project Success Rates Key Methods To Analyze Collected Data PM SS
This slide shows different methods for analyzing the collected data from the different internal and external sources of organization. It includes methods such as descriptive statics, root cause analysis , SWOT analysis and gap analysis, etc. Present the topic in a bit more detail with this Optimizing Project Success Rates Key Methods To Analyze Collected Data PM SS. Use it as a tool for discussion and navigation on Descriptive Statistics, Root Cause Analysis, Swot Analysis, Gap Analysis. This template is free to edit as deemed fit for your organization. Therefore download it now.
-
 How To Use Ai In Agriculture Types Of Big Data Analyzed In Agriculture AI SS
This slide showcases types of big data analytics involved in agriculture, which can helps farmers determine insights and take relevant decisions. It provides details about geospatial, telematics and meta data. Increase audience engagement and knowledge by dispensing information using How To Use Ai In Agriculture Types Of Big Data Analyzed In Agriculture AI SS. This template helps you present information on four stages. You can also present information on Planting Depth, Cultivation Selection, Application Dates, Big Data Analyzed using this PPT design. This layout is completely editable so personaize it now to meet your audiences expectations.
-
 Linear flow diagram to analyze the data 3 stages chart production powerpoint slides
We are proud to present our linear flow diagram to analyze the data 3 stages chart production powerpoint slides. This layout can be used to explore design ideas. This PPT design is a handy tool. Drill your thoughts in to the heads of your team. You can convert data into this interactive diagram.
-
 KPI Dashboard To Analyze Customer Intelligence Data
Mentioned slide illustrates a comprehensive KPI dashboard which can be used by the company to evaluate customer intelligence data. This dashboard covers metrics such as total mentions, average time per replies, total replies, etc. Introducing our KPI Dashboard To Analyze Customer Intelligence Data set of slides. The topics discussed in these slides are KPI Dashboard, Analyze, Customer Intelligence Data. This is an immediately available PowerPoint presentation that can be conveniently customized. Download it and convince your audience.
-
 Dashboard To Analyze Healthcare Organization Data
This slide depicts the dashboard used for analyzing healthcare organization data. The purpose of this template is to provide details related to the patients, staffs and cost. It includes information related to the outpatient and inpatient trends, waiting time, etc. Introducing our Dashboard To Analyze Healthcare Organization Data set of slides. The topics discussed in these slides are Outpatients, Inpatients Trend, Patients By Division. This is an immediately available PowerPoint presentation that can be conveniently customized. Download it and convince your audience.
-
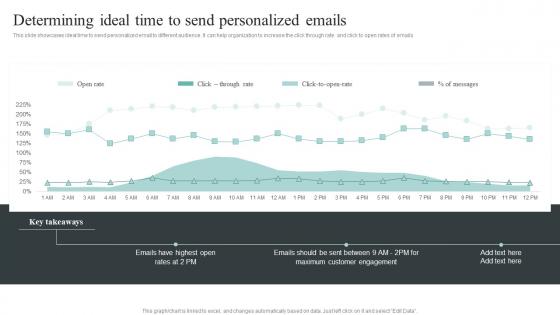 Determining Ideal Time To Send Personalized Emails Collecting And Analyzing Customer Data
This slide showcases ideal time to send personalized email to different audience. It can help organization to increase the click through rate and click to open rates of emails. Deliver an outstanding presentation on the topic using this Determining Ideal Time To Send Personalized Emails Collecting And Analyzing Customer Data. Dispense information and present a thorough explanation of Open Rate, Customer Engagement, Emails using the slides given. This template can be altered and personalized to fit your needs. It is also available for immediate download. So grab it now.
-
 Dimensions Scorecard To Analyze Data Quality
This slide showcases quality assessment on the basis of various dimensions to help company derive consistent real time data. It includes parameters such as accuracy, completeness, currency, timeliness and accessibility. Introducing our Dimensions Scorecard To Analyze Data Quality set of slides. The topics discussed in these slides are Data Quality Score,Key Insights,Basis Of Errors Occurred. This is an immediately available PowerPoint presentation that can be conveniently customized. Download it and convince your audience.
-
 Dashboard To Analyze Business Performance Guide For Data Collection Analysis MKT SS V
The following slide showcases a dashboard to evaluate organizational performance in market and analyze competition. It outlines components such as number of mention, sentiment meter, number of mentions, geographical distribution. Present the topic in a bit more detail with this Dashboard To Analyze Business Performance Guide For Data Collection Analysis MKT SS V. Use it as a tool for discussion and navigation on Number Of Mentions, Sentiment Meter. This template is free to edit as deemed fit for your organization. Therefore download it now.
-
 Businessman using statistics tools to analyze data
Introducing our premium set of slides with Businessman Using Statistics Tools To Analyze Data. Elucidate the four stages and present information using this PPT slide. This is a completely adaptable PowerPoint template design that can be used to interpret topics like Businessman Using Statistics Tools To Analyze Data. So download instantly and tailor it with your information.
-
 Analyzing customer journey and data from 360 degree how to maintain loyalty
The following slide provides glimpse of a companys retention rate , average order value , their retention rate over the year along with various strategies they have used. Increase audience engagement and knowledge by dispensing information using Analyzing Customer Journey And Data From 360 Degree How To Maintain Loyalty. This template helps you present information on four stages. You can also present information on Point Program, Spend Program, Vip Member Club using this PPT design. This layout is completely editable so personaize it now to meet your audiences expectations.
-
 Analyzing customer journey and data how to position our self market
The following slide shows the positioning strategy of the organization. The various brands and competitors along with the USP of the product are analyzed in this slide Introducing Analyzing Customer Journey And Data How To Position Our Self Market to increase your presentation threshold. Encompassed with five stages, this template is a great option to educate and entice your audience. Dispence information on How To Position Our Self In The Market, using this template. Grab it now to reap its full benefits.
-
 Research Analyst Analyzing Data To Interpret Market Conditions
Presenting our set of slides with name Research Analyst Analyzing Data To Interpret Market Conditions. This exhibits information on three stages of the process. This is an easy-to-edit and innovatively designed PowerPoint template. So download immediately and highlight information on Research Analyst Analyzing Data To Interpret Market Conditions.
-
 Determine Data To Analyze Product Sales Performance Monetizing Data And Identifying Value
Firm will keep the track of the top and worst selling products with the help of consumer data collected. It will increase the production that are in high demand and subsequently lower the production of worse selling products in order to leverage its strength. Deliver an outstanding presentation on the topic using this Determine Data To Analyze Product Sales Performance Monetizing Data And Identifying Value. Dispense information and present a thorough explanation of Products, Units Produced 2019, Units Produced 2019, Consumer Data using the slides given. This template can be altered and personalized to fit your needs. It is also available for immediate download. So grab it now.
-
 Determine Data To Analyze Product Sales Performance Ensuring Organizational Growth Through Data
Firm will keep the track of the top and worst selling products with the help of consumer data collected. It will increase the production that are in high demand and subsequently lower the production of worse selling products in order to leverage its strength. Increase audience engagement and knowledge by dispensing information using Determine Data To Analyze Product Sales Performance Ensuring Organizational Growth Through Data. This template helps you present information on one stages. You can also present information on Determine Data To Analyze, Product Sales Performance using this PPT design. This layout is completely editable so personaize it now to meet your audiences expectations.
-
 Determine Data To Analyze Product Sales Performance Demystifying Digital Data Monetization
Firm will keep the track of the top and worst selling products with the help of consumer data collected. It will increase the production that are in high demand and subsequently lower the production of worse selling products in order to leverage its strength. Present the topic in a bit more detail with this Determine Data To Analyze Product Sales Performance Demystifying Digital Data Monetization. Use it as a tool for discussion and navigation on Determine Data To Analyze, Product Sales Performance. This template is free to edit as deemed fit for your organization. Therefore download it now.
-
 Analyzing Descriptive Data To Formulate Personalized Marketing Strategic Plan Targeted
This slide showcases descriptive data that can be collected to formulate personalized marketing campaign. It also shows ways to collect data from different sources Present the topic in a bit more detail with this Analyzing Descriptive Data To Formulate Personalized Marketing Strategic Plan Targeted. Use it as a tool for discussion and navigation on Purpose Of Collecting, Overview Of Descriptive, Descriptive Data Provides. This template is free to edit as deemed fit for your organization. Therefore download it now.
-
 Determine Data To Analyze Product Sales Performance Determining Direct And Indirect Data Monetization Value
Firm will keep the track of the top and worst selling products with the help of consumer data collected. It will increase the production that are in high demand and subsequently lower the production of worse selling products in order to leverage its strength. Present the topic in a bit more detail with this Determine Data To Analyze Product Sales Performance Determining Direct And Indirect Data Monetization Value. Use it as a tool for discussion and navigation on Determine Data, Analyze Product, Sales Performance. This template is free to edit as deemed fit for your organization. Therefore download it now.
-
 Turning Data Into Revenue Determine Data To Analyze Product Sales Performance
Firm will keep the track of the top and worst selling products with the help of consumer data collected. It will increase the production that are in high demand and subsequently lower the production of worse selling products in order to leverage its strength. Introducing Turning Data Into Revenue Determine Data To Analyze Product Sales Performance to increase your presentation threshold. Encompassed with one stages, this template is a great option to educate and entice your audience. Dispence information on Data To Analyze, Product Sales, Performance, using this template. Grab it now to reap its full benefits.


