Powerpoint Templates and Google slides for Data Survey Results
Save Your Time and attract your audience with our fully editable PPT Templates and Slides.
-
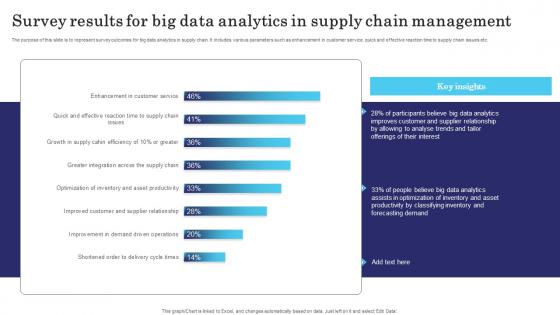
 Survey Results For Big Data Analytics In Supply Chain Management
The purpose of this slide is to represent survey outcomes for big data analytics in supply chain. It includes various parameters such as enhancement in customer service, quick and effective reaction time to supply chain issues etc. Presenting our well structured Survey Results For Big Data Analytics In Supply Chain Management. The topics discussed in this slide are Management, Analyse, Optimization. This is an instantly available PowerPoint presentation that can be edited conveniently. Download it right away and captivate your audience.
-
 Best Practices To Enhance Reporting Of Survey Data Analysis Results
This slide showcases the varied kinds of qualitative survey data analysis. The purpose of this slide is to help the researcher utilize a suitable approach for analyzing qualitative survey data in order to meet their study goals. It includes thematic analysis, framework analysis. grounded analysis, etc. Presenting our set of slides with Best Practices To Enhance Reporting Of Survey Data Analysis Results. This exhibits information on four stages of the process. This is an easy to edit and innovatively designed PowerPoint template. So download immediately and highlight information on Utilize Visualization, Utilize Simple Language, Tell Research Story.
-
 Analysing Results Of Employee Training Needs Survey Data Visualization DTE SS
The following slide on employee survey results analyzes key trends, assisting managers in pinpointing training priorities for enhancing employee satisfaction and performance. The survey results relate to tool familiarity, learning approaches, etc. Increase audience engagement and knowledge by dispensing information using Analysing Results Of Employee Training Needs Survey Data Visualization DTE SS. This template helps you present information on FIVE stages. You can also present information on Ider Self Paced, Employees Familiar, Business Analytics using this PPT design. This layout is completely editable so personaize it now to meet your audiences expectations.
-
 Employee Recruitment Data Survey Results
The following slide depicts survey results conducted for HR and recruited to find out details related to recruitment. The slide includes usage of twitter list to find candidates, job portals to advertise positions and social media to screen candidates. Introducing our Employee Recruitment Data Survey Results set of slides. The topics discussed in these slides are Employee Recruitment, Data Survey Results. This is an immediately available PowerPoint presentation that can be conveniently customized. Download it and convince your audience.
-
 Data visualization survey results reporting via bar graph
Presenting this set of slides with name - Data Visualization Survey Results Reporting Via Bar Graph. This is a one stage process. The stages in this process are Data Visualization, Data Management, Data Representation.
-
 Data Analysis Survey Results Ppt Powerpoint Presentation Portfolio Infographics Cpb
Presenting Data Analysis Survey Results Ppt Powerpoint Presentation Portfolio Infographics Cpb slide which is completely adaptable. The graphics in this PowerPoint slide showcase eight stages that will help you succinctly convey the information. In addition, you can alternate the color, font size, font type, and shapes of this PPT layout according to your content. This PPT presentation can be accessed with Google Slides and is available in both standard screen and widescreen aspect ratios. It is also a useful set to elucidate topics like Data Analysis Survey Results. This well-structured design can be downloaded in different formats like PDF, JPG, and PNG. So, without any delay, click on the download button now.
-
 Butterfly chart for survey results data driven example of ppt
Presenting butterfly chart for survey results data-driven example of PPT slide. There is an impressive use of images, color and content parallel to the topic. Professionally equipped and aesthetically designed. PPT is compatible with numerous formats. PowerPoint is harmonious with multiple online and offline software option and is 100 percent editable. Ease of editing with the help of guidance provided for the same. Modify the content as per need. Personalize the presentation with company name, logo and trademark. Used by various students, teachers, IT professionals and entrepreneurs.
-
 Customer satisfaction survey results data ppt powerpoint presentation gallery graphics
Presenting this set of slides with name Customer Satisfaction Survey Results Data Ppt Powerpoint Presentation Gallery Graphics. The topics discussed in these slides are Neutral, Very Satisfied, Satisfied, Unsatisfied, Very Unsatisfied. This is a completely editable PowerPoint presentation and is available for immediate download. Download now and impress your audience.


