Powerpoint Templates and Google slides for Data Rate
Save Your Time and attract your audience with our fully editable PPT Templates and Slides.
-
 Implementing Workforce Analytics In Business For Enhancing Employee Retention Rates Data Analytics CD
This complete deck covers various topics and highlights important concepts. It has PPT slides which cater to your business needs. This complete deck presentation emphasizes Implementing Workforce Analytics In Business For Enhancing Employee Retention Rates Data Analytics CD and has templates with professional background images and relevant content. This deck consists of total of one hundred two slides. Our designers have created customizable templates, keeping your convenience in mind. You can edit the color, text and font size with ease. Not just this, you can also add or delete the content if needed. Get access to this fully editable complete presentation by clicking the download button below.
-
 Net Revenue Retention Rate Data Warehouse Service Company CP SS V
This slide showcases the increase decrease in customer generating product revenue more than 1million of Snowflake company, which is a KPI to measure the performance of business operations. It showcases three year performance from financial year ending 2021 to 2023. Deliver an outstanding presentation on the topic using this Net Revenue Retention Rate Data Warehouse Service Company CP SS V Dispense information and present a thorough explanation of Net Revenue Retention Rate using the slides given. This template can be altered and personalized to fit your needs. It is also available for immediate download. So grab it now.
-
 Data AI Artificial Intelligence Data AI Company Culture Score And Rating AI SS
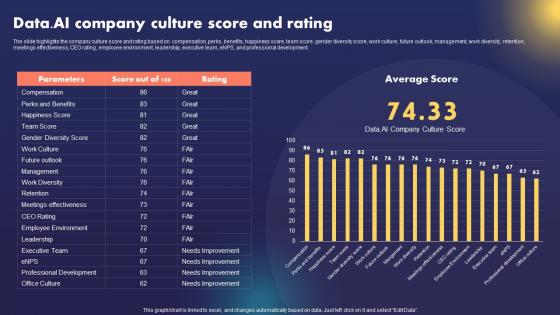
The slide highlights the company culture score and rating based on compensation, perks, benefits, happiness score, team score, gender diversity score, work culture, future outlook, management, work diversity, retention, meetings effectiveness, CEO rating, employee environment, leadership, executive team, eNPS, and professional development. Present the topic in a bit more detail with this Data AI Artificial Intelligence Data AI Company Culture Score And Rating AI SS. Use it as a tool for discussion and navigation on Culture Score, Rating Based On Compensation, Gender Diversity Score, Work Diversity, Retention. This template is free to edit as deemed fit for your organization. Therefore download it now.
-
 Implementing Big Data Analytics Analyzing Stockout Rate To Identify Loss In Sales CRP DK SS
This slide showcases dashboard to monitor product stockout levels and identify reasons such as ineffective forecasting, late delivery, product quality issues etc. Present the topic in a bit more detail with this Implementing Big Data Analytics Analyzing Stockout Rate To Identify Loss In Sales CRP DK SS. Use it as a tool for discussion and navigation on Dashboard To Monitor Product, Stockout Levels And Identify Reasons, Ineffective Forecasting. This template is free to edit as deemed fit for your organization. Therefore download it now.
-
 Implementing Big Data Analytics Supplier Quality Analysis Based On Vendor Defect Rate CRP DK SS
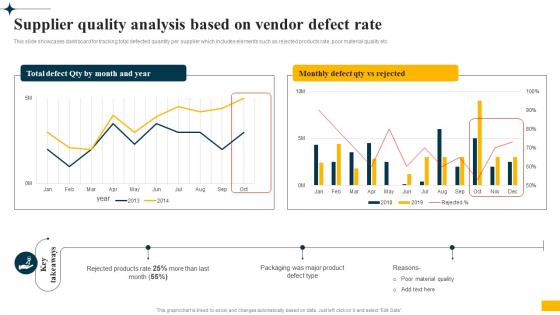
This slide showcases dashboard for tracking total defected quantity per supplier which includes elements such as rejected products rate, poor material quality etc. Present the topic in a bit more detail with this Implementing Big Data Analytics Supplier Quality Analysis Based On Vendor Defect Rate CRP DK SS. Use it as a tool for discussion and navigation on Dashboard For Tracking, Quantity Per Supplier, Rejected Products Rate, Poor Material Quality. This template is free to edit as deemed fit for your organization. Therefore download it now.
-
 Analyzing Employee Burnout Risk Rate To Assess Implementing Workforce Analytics Data Analytics SS
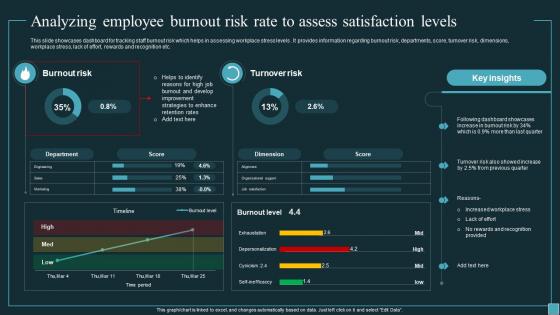
This slide showcases dashboard for tracking staff burnout risk which helps in assessing workplace stress levels . It provides information regarding burnout risk, departments, score, turnover risk, dimensions, workplace stress, lack of effort, rewards and recognition etc. Present the topic in a bit more detail with this Analyzing Employee Burnout Risk Rate To Assess Implementing Workforce Analytics Data Analytics SS. Use it as a tool for discussion and navigation on Analyzing Employee Burnout Risk Rate, Assess Satisfaction Levels, Rewards And Recognition, Turnover Risk. This template is free to edit as deemed fit for your organization. Therefore download it now.
-
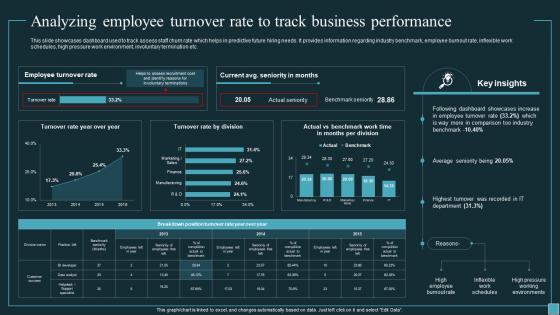 Analyzing Employee Turnover Rate To Track Business Implementing Workforce Analytics Data Analytics SS
This slide showcases dashboard used to track assess staff churn rate which helps in predictive future hiring needs. It provides information regarding industry benchmark, employee burnout rate, inflexible work schedules, high pressure work environment, involuntary termination etc. Present the topic in a bit more detail with this Analyzing Employee Turnover Rate To Track Business Implementing Workforce Analytics Data Analytics SS. Use it as a tool for discussion and navigation on Analyzing Employee Turnover Rate, Track Business Performance, Work Environment, Involuntary Termination. This template is free to edit as deemed fit for your organization. Therefore download it now.
-
 Implementing Workforce Analytics Analyzing Staff Absenteeism Rate To Evaluate Quality Data Analytics SS
This slide showcases dashboard for assessing workplace absenteeism rate which helps in reducing cost of absence and improve business productivity. It provides information regarding absenteeism rate, total unproductive hours, sick days, cost of sick leaves etc. Deliver an outstanding presentation on the topic using this Implementing Workforce Analytics Analyzing Staff Absenteeism Rate To Evaluate Quality Data Analytics SS. Dispense information and present a thorough explanation of Analyzing Staff Absenteeism Rate, Evaluate Quality Of Work, Sick Days, Cost Of Sick Leaves using the slides given. This template can be altered and personalized to fit your needs. It is also available for immediate download. So grab it now.
-
 Analyzing Patient Churn Rate To Track Definitive Guide To Implement Data Analytics SS
This slide showcases dashboard for assessing patient turnover rate which helps in improving patient engagement. It provides information regarding bed occupancy rate, average cost per patient, staff to patient ratio, existing patients, number of beds etc. Present the topic in a bit more detail with this Analyzing Patient Churn Rate To Track Definitive Guide To Implement Data Analytics SS. Use it as a tool for discussion and navigation on Occupancy, Opportunity, Organizations, Dashboard. This template is free to edit as deemed fit for your organization. Therefore download it now.
-
 Analyzing Patient Survey Response Rate Definitive Guide To Implement Data Analytics SS
This slide showcases dashboard for tracking survey completion rate in hospitals which helps in analyzing patient satisfaction . It includes elements such as poor physician care, low health literacy, complex survey questions etc. Present the topic in a bit more detail with this Analyzing Patient Survey Response Rate Definitive Guide To Implement Data Analytics SS. Use it as a tool for discussion and navigation on Surveys Conducted, Incomplete Responses, Questionnaire Collectors, Responses Collected. This template is free to edit as deemed fit for your organization. Therefore download it now.
-
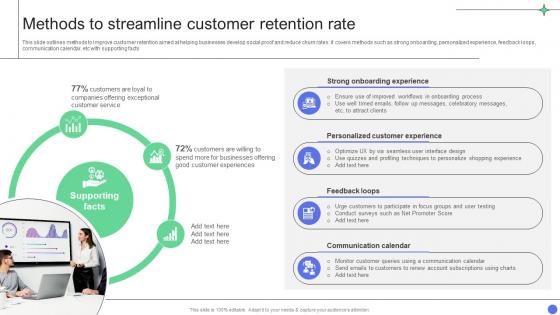 A Comprehensive Guide Methods To Streamline Customer Retention Rate Data Analytics SS
This slide outlines methods to improve customer retention aimed at helping businesses develop social proof and reduce churn rates. It covers methods such as strong onboarding, personalized experience, feedback loops, communication calendar, etc with supporting facts Introducing A Comprehensive Guide Methods To Streamline Customer Retention Rate Data Analytics SS to increase your presentation threshold. Encompassed with Four stages, this template is a great option to educate and entice your audience. Dispence information on Strong Onboarding Experience, Personalized Customer Experience using this template. Grab it now to reap its full benefits.
-
 Net Revenue Retention Rate Data Analytics And Storage Company Profile CP SS V
This slide showcases the increase decrease in customer generating product revenue more than 1million of Snowflake company, which is a KPI to measure the performance of business operations. It showcases three year performance from financial year ending 2021 to 2023. Present the topic in a bit more detail with this Net Revenue Retention Rate Data Analytics And Storage Company Profile CP SS V Use it as a tool for discussion and navigation on Net Revenue Retention Rate This template is free to edit as deemed fit for your organization. Therefore download it now.
-
 Monitoring Staff Absenteeism Rate To Assess Complete Guide To Business Analytics Data Analytics SS
This slide showcases dashboard for analyzing employee absenteeism rate which helps in identifying reasons for high number of leaves. It provides information regarding absenteeism rate, average days on leave by business unit, total leave days, average leave costs , annual leaves balance etc. Present the topic in a bit more detail with this Monitoring Staff Absenteeism Rate To Assess Complete Guide To Business Analytics Data Analytics SS. Use it as a tool for discussion and navigation on Monitoring Staff Absenteeism Rate, Assess Performance Gaps, Work Related Stress, Workplace Harassment. This template is free to edit as deemed fit for your organization. Therefore download it now.
-
 Delays In Sales Forecasting And Increasing Error Rates Data Visualization DTE SS
The following slide on increased error rate visually presents the impact on efficiency, aiding managers in crafting targeted training interventions to minimize errors. The error rates have increased due to lack of employee knowledge, inability to predict data etc. Present the topic in a bit more detail with this Delays In Sales Forecasting And Increasing Error Rates Data Visualization DTE SS. Use it as a tool for discussion and navigation on Error Rates, Delay Rates, Delays Arising. This template is free to edit as deemed fit for your organization. Therefore download it now.
-
 Analyzing Customer Bounce Rate For Business Leveraging Digital Analytics To Develop Data Analytics SS
This slide showcases dashboard used to track visitor bounce rate on website which helps in identifying non profitable traffic sources. It provides information regarding KPI metrics such as channels, sessions, new users, bounce rate, pageviews, average session duration etc. Present the topic in a bit more detail with this Analyzing Customer Bounce Rate For Business Leveraging Digital Analytics To Develop Data Analytics SS. Use it as a tool for discussion and navigation on Analyzing Customer Bounce Rate, Business Website. This template is free to edit as deemed fit for your organization. Therefore download it now.
-
 World Exchange Rate Data In Powerpoint And Google Slides Cpb
Presenting World Exchange Rate Data In Powerpoint And Google Slides Cpb slide which is completely adaptable. The graphics in this PowerPoint slide showcase three stages that will help you succinctly convey the information. In addition, you can alternate the color, font size, font type, and shapes of this PPT layout according to your content. This PPT presentation can be accessed with Google Slides and is available in both standard screen and widescreen aspect ratios. It is also a useful set to elucidate topics like World Exchange Rate Data. This well structured design can be downloaded in different formats like PDF, JPG, and PNG. So, without any delay, click on the download button now.
-
 Data Center Cap Rates In Powerpoint And Google Slides Cpb
Presenting our Data Center Cap Rates In Powerpoint And Google Slides Cpb PowerPoint template design. This PowerPoint slide showcases Four stages. It is useful to share insightful information on Data Center Cap Rates This PPT slide can be easily accessed in standard screen and widescreen aspect ratios. It is also available in various formats like PDF, PNG, and JPG. Not only this, the PowerPoint slideshow is completely editable and you can effortlessly modify the font size, font type, and shapes according to your wish. Our PPT layout is compatible with Google Slides as well, so download and edit it as per your knowledge.
-
 Historical Exchange Rate Data In Powerpoint And Google Slides Cpb
Presenting our Historical Exchange Rate Data In Powerpoint And Google Slides Cpb PowerPoint template design. This PowerPoint slide showcases three stages. It is useful to share insightful information on Historical Exchange Rate Data This PPT slide can be easily accessed in standard screen and widescreen aspect ratios. It is also available in various formats like PDF, PNG, and JPG. Not only this, the PowerPoint slideshow is completely editable and you can effortlessly modify the font size, font type, and shapes according to your wish. Our PPT layout is compatible with Google Slides as well, so download and edit it as per your knowledge.
-
 Implementing Big Data Analytics Impact Of Adopting Best Practices To Reduce Defect Rates CRP DK SS
This slide highlight benefits of implementing strategies to decrease supplier defect rates such as real time tracking, supplier quality check, supplier scorecards etc. Present the topic in a bit more detail with this Implementing Big Data Analytics Impact Of Adopting Best Practices To Reduce Defect Rates CRP DK SS. Use it as a tool for discussion and navigation on Real Time Supplier Quality, Monitor Supplier Performance, Develop Supplier Scorecards. This template is free to edit as deemed fit for your organization. Therefore download it now.
-
 Implementing Big Data Analytics Strategies Adopted To Reduce Supplier Defect Rates CRP DK SS
This slide showcases various initiatives to improve supplier quality such as supplier quality management, quality control measures and staff trainings. Introducing Implementing Big Data Analytics Strategies Adopted To Reduce Supplier Defect Rates CRP DK SS to increase your presentation threshold. Encompassed with three stages, this template is a great option to educate and entice your audience. Dispence information on Quality Control Measures, Supply Quality Management, Staff Training, Develop Vendor Qualification Criteria, using this template. Grab it now to reap its full benefits.
-
 Implementing Workforce Analytics Strategies Adopted To Improve Employee Retention Rates Data Analytics SS
This slide showcases best practices which can be adopted by organization to reduce employee turnover and enhance engagement rates. It provides information regarding establishing healthy work culture, developing multi generation teams and providing flexible schedules. Introducing Implementing Workforce Analytics Strategies Adopted To Improve Employee Retention Rates Data Analytics SS to increase your presentation threshold. Encompassed with three stages, this template is a great option to educate and entice your audience. Dispence information on Establish Healthy Work Culture, Develop Multi Generation Teams, Provide Flexible Schedules, using this template. Grab it now to reap its full benefits.
-
 Strategies To Reduce Workforce Absenteeism Rate Implementing Workforce Analytics Data Analytics SS
This slide showcases various tips which can be adopted by businesses to enhance staff engagement rates and reduce absenteeism rate. It provides information regarding developing clear attendance policy, offering rewards and recognition, checking unsanctioned leaves and encouraging engagement. Introducing Strategies To Reduce Workforce Absenteeism Rate Implementing Workforce Analytics Data Analytics SS to increase your presentation threshold. Encompassed with four stages, this template is a great option to educate and entice your audience. Dispence information on Develop Clear Attendance Policy, Offer Rewards And Recognition, Check Unsanctioned Leaves, Encourage Engagement, using this template. Grab it now to reap its full benefits.
-
 Strategies To Improve Patient Retention Rates Definitive Guide To Implement Data Analytics SS
This slide showcases key techniques which can be adopted by healthcare organizations to reduce patient turnover rates. It provides information regarding effective communication, reducing wait times, decreasing fragmentation and digitizing medication orders. Introducing Strategies To Improve Patient Retention Rates Definitive Guide To Implement Data Analytics SS to increase your presentation threshold. Encompassed with Four stages, this template is a great option to educate and entice your audience. Dispence information on Effective Communication, Reduce Wait Times, Decrease Fragmentation, Digitalize Medication Order, using this template. Grab it now to reap its full benefits.
-
 Best Practices To Reduce Absenteeism Rate And Improve Complete Guide To Business Analytics Data Analytics SS
This slide highlights strategies to improvement employee engagement at workplace to decrease absenteeism rates. It provides information regarding developing attendance policy, ensuring flexible working style and boosting employee moral. Introducing Best Practices To Reduce Absenteeism Rate And Improve Complete Guide To Business Analytics Data Analytics SS to increase your presentation threshold. Encompassed with three stages, this template is a great option to educate and entice your audience. Dispence information on Ensure Flexible Working, Boost Employee Moral, Develop Attendance Policy, using this template. Grab it now to reap its full benefits.
-
 Strategies Adopted To Reduce Staff Attrition Rate Complete Guide To Business Analytics Data Analytics SS
This slide showcases best practices which can be adopted by business to decrease staff turnover rates and improve employee engagement at workplace. It provides information regarding improving team relationships, gathering feedbacks regularly and encouraging professional development. Increase audience engagement and knowledge by dispensing information using Strategies Adopted To Reduce Staff Attrition Rate Complete Guide To Business Analytics Data Analytics SS. This template helps you present information on three stages. You can also present information on Improve Team Relationships, Gather Feedbacks Regularly, Encourage Professional Development using this PPT design. This layout is completely editable so personaize it now to meet your audiences expectations.
-
 Best Practices To Reduce User Bounce Rate Leveraging Digital Analytics To Develop Data Analytics SS
This slide showcases strategies adopted by business to decrease user bounce rates which helps in improving engagement and conversion rates. It provides information regarding landing pages, CTA, user experience and website load time. Introducing Best Practices To Reduce User Bounce Rate Leveraging Digital Analytics To Develop Data Analytics SS to increase your presentation threshold. Encompassed with four stages, this template is a great option to educate and entice your audience. Dispence information on Landing Pages, User Experience, Website Load Time, using this template. Grab it now to reap its full benefits.
-
 Optimizing Project Success Rates By Different Method And Techniques For Data PM SS
This slide shows different methods for collecting data in project auditing process from various participants and stakeholder in the organization. It includes methods such as documents review, interview and discussions, surveys and performance metrics , etc. Present the topic in a bit more detail with this Optimizing Project Success Rates By Different Method And Techniques For Data PM SS. Use it as a tool for discussion and navigation on Documents Review, Interviews And Discussions, Surveys, Performance Metrics. This template is free to edit as deemed fit for your organization. Therefore download it now.
-
 Optimizing Project Success Rates Key Methods To Analyze Collected Data PM SS
This slide shows different methods for analyzing the collected data from the different internal and external sources of organization. It includes methods such as descriptive statics, root cause analysis , SWOT analysis and gap analysis, etc. Present the topic in a bit more detail with this Optimizing Project Success Rates Key Methods To Analyze Collected Data PM SS. Use it as a tool for discussion and navigation on Descriptive Statistics, Root Cause Analysis, Swot Analysis, Gap Analysis. This template is free to edit as deemed fit for your organization. Therefore download it now.
-
 Analyzing customer journey and data from 360 degree our conversion rates over the year
In this slide we have provided you with a comparative graph that shows the conversion rate over a span of 2 years along with key activities that the organization is doing in order to increase their conversion rate Deliver an outstanding presentation on the topic using this Analyzing Customer Journey And Data From 360 Degree Our Conversion Rates Over The Year. Dispense information and present a thorough explanation of Annual Membership, Conversion, Comparative using the slides given. This template can be altered and personalized to fit your needs. It is also available for immediate download. So grab it now.
-
 Hospital performance data scorecard with bed occupancy rate
Present the topic in a bit more detail with this Hospital Performance Data Scorecard With Bed Occupancy Rate. Use it as a tool for discussion and navigation on Scorecard, Occupancy, Performance. This template is free to edit as deemed fit for your organization. Therefore download it now.
-
 Hospital performance data scorecard with inpatient morality rate
Present the topic in a bit more detail with this Hospital Performance Data Scorecard With Inpatient Morality Rate. Use it as a tool for discussion and navigation on Scorecard, Hospital, Performance. This template is free to edit as deemed fit for your organization. Therefore download it now.
-
 Hospital performance data scorecard with readmission rate hospital performance
Present the topic in a bit more detail with this Hospital Performance Data Scorecard With Readmission Rate Hospital Performance. Use it as a tool for discussion and navigation on Scorecard, Hospital, Performance. This template is free to edit as deemed fit for your organization. Therefore download it now.
-
 Corporate KPI Dashboard Showing Bounce Rate With New Users Data
This graph or chart is linked to excel, and changes automatically based on data. Just left click on it and select Edit Data. Presenting our well structured Corporate KPI Dashboard Showing Bounce Rate With New Users Data. The topics discussed in this slide are New Sessions, Unique Pageviews, Time on Page, Bounce Rate, User Demographics, Visitor Statistics. This is an instantly available PowerPoint presentation that can be edited conveniently. Download it right away and captivate your audience.
-
 Statistical Data Showing Bounce Rate By Industry
This slide showcases industry wise bounce rate to help in identifying whether the bounce rate is alarming and if improvement are needed to be done. Various industries covered are financial services, hospital and healthcare, medical devices, real estate, computer software, health, wellness and fitness, IT and management consulting. Introducing our Statistical Data Showing Bounce Rate By Industry set of slides. The topics discussed in these slides are Set Realistic Expectations, Attract Right Visitors, Produce High Quality Content. This is an immediately available PowerPoint presentation that can be conveniently customized. Download it and convince your audience.
-
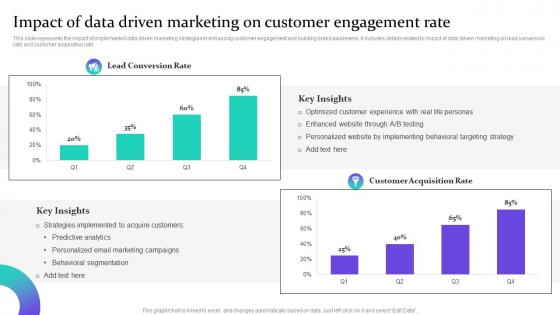 Impact Of Data Driven Marketing On Customer Engagement Rate Data Driven Marketing For Increasing MKT SS V
This slide represents the impact of implemented data driven marketing strategies in enhancing customer engagement and building brand awareness. It includes details related to impact of data driven marketing on lead conversion rate and customer acquisition rate. Deliver an outstanding presentation on the topic using this Impact Of Data Driven Marketing On Customer Engagement Rate Data Driven Marketing For Increasing MKT SS V Dispense information and present a thorough explanation of Lead Conversion Rate, Optimized Customer, Personalized Website using the slides given. This template can be altered and personalized to fit your needs. It is also available for immediate download. So grab it now.
-
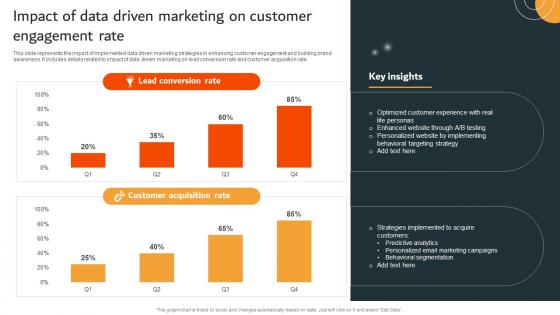 Impact Of Data Driven Marketing On Customer Engagement Rate MKT SS V
This slide represents the impact of implemented data driven marketing strategies in enhancing customer engagement and building brand awareness. It includes details related to impact of data driven marketing on lead conversion rate and customer acquisition rate. Deliver an outstanding presentation on the topic using this Impact Of Data Driven Marketing On Customer Engagement Rate MKT SS V Dispense information and present a thorough explanation of Lead Conversion Rate, Customer Acquisition Rate using the slides given. This template can be altered and personalized to fit your needs. It is also available for immediate download. So grab it now.
-
 Analyzing customer journey and data from 360 degree our retention rates
The following slide provides glimpse of a companys retention rate , average order value , their retention rate over the year along with various strategies they have used. Deliver an outstanding presentation on the topic using this Analyzing Customer Journey And Data From 360 Degree Our Retention Rates. Dispense information and present a thorough explanation of Communication, Membership, Retention using the slides given. This template can be altered and personalized to fit your needs. It is also available for immediate download. So grab it now.
-
 Determining The Otd Rate Of It Projects Agile Methodology For Data Migration Project It
Mentioned slide provides information on the on-time-delivery rate of the IT projects completed by the organization. Here the stats indicates that OTD rate of IT projects completed in H1 of 2022 was 50 percent. Deliver an outstanding presentation on the topic using this Determining The Otd Rate Of It Projects Agile Methodology For Data Migration Project It. Dispense information and present a thorough explanation of Organization, Information, Completed using the slides given. This template can be altered and personalized to fit your needs. It is also available for immediate download. So grab it now.
-
 Data analytics playbook search driven analytics challenges low bi adoption rate and poor user experience
This template covers the problems while implementing search driven analytics in the organization. The challenges are failure rate for BI projects and poor user experience stifles adoption. Introducing Data Analytics Playbook Search Driven Analytics Challenges Low Bi Adoption Rate And Poor User Experience to increase your presentation threshold. Encompassed with two stages, this template is a great option to educate and entice your audience. Dispence information on Search Driven Analytics Challenge Low BI Adoption Rate And Poor User Experience, using this template. Grab it now to reap its full benefits.
-
 Using Agile In Data Transformation Project It Otd Rate Of It Projects
Mentioned slide provides information on the on-time delivery rate of the IT projects completed by the organization. Here the stats indicates that OTD rate of IT projects completed in H1 of 2020 was 50 percent. Present the topic in a bit more detail with this Using Agile In Data Transformation Project It Otd Rate Of It Projects. Use it as a tool for discussion and navigation on Determining The Otd Rate Of It Projects. This template is free to edit as deemed fit for your organization. Therefore download it now.
-
 Data Transmission Rate Ppt Powerpoint Presentation Styles Themes Cpb
Presenting Data Transmission Rate Ppt Powerpoint Presentation Styles Themes Cpb slide which is completely adaptable. The graphics in this PowerPoint slide showcase five stages that will help you succinctly convey the information. In addition, you can alternate the color, font size, font type, and shapes of this PPT layout according to your content. This PPT presentation can be accessed with Google Slides and is available in both standard screen and widescreen aspect ratios. It is also a useful set to elucidate topics like Data Transmission Rate. This well structured design can be downloaded in different formats like PDF, JPG, and PNG. So, without any delay, click on the download button now.
-
 Direct Mail List Rates Data Ppt Powerpoint Presentation Slide Cpb
Presenting Direct Mail List Rates Data Ppt Powerpoint Presentation Slide Cpb slide which is completely adaptable. The graphics in this PowerPoint slide showcase four stages that will help you succinctly convey the information. In addition, you can alternate the color, font size, font type, and shapes of this PPT layout according to your content. This PPT presentation can be accessed with Google Slides and is available in both standard screen and widescreen aspect ratios. It is also a useful set to elucidate topics like Direct Mail List Rates Data. This well-structured design can be downloaded in different formats like PDF, JPG, and PNG. So, without any delay, click on the download button now.
-
 Data Rate Conversion Table Ppt Powerpoint Presentation Model Graphics Tutorials Cpb
Presenting our Data Rate Conversion Table Ppt Powerpoint Presentation Model Graphics Tutorials Cpb PowerPoint template design. This PowerPoint slide showcases seven stages. It is useful to share insightful information on Data Rate Conversion Table. This PPT slide can be easily accessed in standard screen and widescreen aspect ratios. It is also available in various formats like PDF, PNG, and JPG. Not only this, the PowerPoint slideshow is completely editable and you can effortlessly modify the font size, font type, and shapes according to your wish. Our PPT layout is compatible with Google Slides as well, so download and edit it as per your knowledge.
-
 Unemployment rate data ppt powerpoint presentation professional summary cpb
Presenting our Unemployment Rate Data Ppt Powerpoint Presentation Professional Summary Cpb PowerPoint template design. This PowerPoint slide showcases five stages. It is useful to share insightful information on Unemployment Rate Data This PPT slide can be easily accessed in standard screen and widescreen aspect ratios. It is also available in various formats like PDF, PNG, and JPG. Not only this, the PowerPoint slideshow is completely editable and you can effortlessly modify the font size, font type, and shapes according to your wish. Our PPT layout is compatible with Google Slides as well, so download and edit it as per your knowledge.
-
 Realized Data Rate Return Graph Ppt Powerpoint Presentation Professional Example Cpb
Presenting Realized Data Rate Return Graph Ppt Powerpoint Presentation Professional Example Cpb slide which is completely adaptable. The graphics in this PowerPoint slide showcase four stages that will help you succinctly convey the information. In addition, you can alternate the color, font size, font type, and shapes of this PPT layout according to your content. This PPT presentation can be accessed with Google Slides and is available in both standard screen and widescreen aspect ratios. It is also a useful set to elucidate topics like Realized Data Rate Return Graph. This well-structured design can be downloaded in different formats like PDF, JPG, and PNG. So, without any delay, click on the download button now.
-
 Supplier Quality Score Data Comparison With Defect Rate
This slide illustrates comparison of supplier quality data that can help organization to reduce inventory order time and minimize monetary expenses by comparing different suppliers options available in the market. Its key elements re percentage returned, quality, availability and defection rate. Introducing our Supplier Quality Score Data Comparison With Defect Rate set of slides. The topics discussed in these slides are Availability, Supplier, Returned, Quality Score. This is an immediately available PowerPoint presentation that can be conveniently customized. Download it and convince your audience.
-
 Data Visualizations Playbook Search Driven Analytics Challenges Low BI Adoption Rate
This template covers the problems while implementing search-driven analytics in the organization. The challenges are failure rate for BI projects and poor user experience stifles adoption. Introducing Data Visualizations Playbook Search Driven Analytics Challenges Low BI Adoption Rate to increase your presentation threshold. Encompassed with two stages, this template is a great option to educate and entice your audience. Dispence information on Challenges, BI Adoption Rates, Employees, New Project, using this template. Grab it now to reap its full benefits.
-
 Different Ways To Collect Customer Data Reduce Client Attrition Rate To Increase Customer
This slide shows the different ways to collect customer data which covers web tracking, transactional data, surveys and marketing analytics to understand customer behavior, activities, etc. Introducing Different Ways To Collect Customer Data Reduce Client Attrition Rate To Increase Customer to increase your presentation threshold. Encompassed with four stages, this template is a great option to educate and entice your audience. Dispence information on Web Tracking, Transactional Data, Marketing Analytics, using this template. Grab it now to reap its full benefits.
-
 Poor Data Quality Rating Colored Icon In Powerpoint Pptx Png And Editable Eps Format
This coloured powerpoint icon is a visual representation of poor data quality. It is a bright yellow exclamation mark with a red background to highlight the issue. It is a great way to quickly alert viewers to potential data problems.
-
 Poor Data Quality Rating Monotone Icon In Powerpoint Pptx Png And Editable Eps Format
This Monotone Powerpoint Icon is the perfect visual aid to illustrate the concept of Poor Data Quality. It features a simple, yet powerful design, with a black and white color scheme to emphasize the lack of quality in the data. It is perfect for presentations, reports, and other documents.
-
 Interest Rate Historical Data In Powerpoint And Google Slides Cpb
Presenting our Interest Rate Historical Data In Powerpoint And Google Slides Cpb PowerPoint template design. This PowerPoint slide showcases three stages. It is useful to share insightful information on Interest Rate Historical Data This PPT slide can be easily accessed in standard screen and widescreen aspect ratios. It is also available in various formats like PDF, PNG, and JPG. Not only this, the PowerPoint slideshow is completely editable and you can effortlessly modify the font size, font type, and shapes according to your wish. Our PPT layout is compatible with Google Slides as well, so download and edit it as per your knowledge.
-
 Data Science Unemployment Rate In Powerpoint And Google Slides Cpb
Presenting Data Science Unemployment Rate In Powerpoint And Google Slides Cpb slide which is completely adaptable. The graphics in this PowerPoint slide showcase four stages that will help you succinctly convey the information. In addition, you can alternate the color, font size, font type, and shapes of this PPT layout according to your content. This PPT presentation can be accessed with Google Slides and is available in both standard screen and widescreen aspect ratios. It is also a useful set to elucidate topics like Data Science Unemployment Rate. This well structured design can be downloaded in different formats like PDF, JPG, and PNG. So, without any delay, click on the download button now.
-
 Revenue TAM And Growth Rate Data And Consumer Research Company Profile CP SS V
This slide highlights the Nielsen company revenue, total addressable market, medium term growth rate, growth drivers for audience measurement, audience outcomes and Gracenote content services. Present the topic in a bit more detail with this Revenue TAM And Growth Rate Data And Consumer Research Company Profile CP SS V Use it as a tool for discussion and navigation on Nielsen Revenue, Total Addressable Market, Growth Rate This template is free to edit as deemed fit for your organization. Therefore download it now.
-
 Data Cleansing Process Flow For Duplicate Leads Maximizing Customer Lead Conversion Rates
This slide covers the data cleansing workflow. It includes steps such as initiating contact through lead channel, receiving lead data in system, reassigning lead to appropriate owner, managing lead through defined process, etc.Deliver an outstanding presentation on the topic using this Data Cleansing Process Flow For Duplicate Leads Maximizing Customer Lead Conversion Rates. Dispense information and present a thorough explanation of Prospect Contacted, Contact System, Appropriate Owner using the slides given. This template can be altered and personalized to fit your needs. It is also available for immediate download. So grab it now.
-
 MailiGen Email Marketing Strategy To Optimize Open Rates Data Driven Marketing Campaign MKT SS V
This slide represents the case study showing the use of personalized email marketing technique by MailiGen in order to improve their email open rates. It includes details related to key objective of MailiGen and strategy implemented by them and its outcomes. Introducing MailiGen Email Marketing Strategy To Optimize Open Rates Data Driven Marketing Campaign MKT SS V to increase your presentation threshold. Encompassed with two stages, this template is a great option to educate and entice your audience. Dispence information on Problem, Objective, Strategy Implemented using this template. Grab it now to reap its full benefits.
-
 Data Driven Marketing Strategy Conversion Rates
This slide shows significant conversion rates of using data driven marketing strategy to boost organizational sale and increase customer base. It include marketers priority percentage, marketing budget allocation percentage to data driven marketing etc. Increase audience engagement and knowledge by dispensing information using Data Driven Marketing Strategy Conversion Rates. This template helps you present information on five stages. You can also present information on Professional Marketers Consider, Driven Marketing, Marketers Consider using this PPT design. This layout is completely editable so personaize it now to meet your audiences expectations.
-
 Absenteeism rate by days data driven bar graph powerpoint show
Presenting absenteeism rate by days data driven bar graph powerpoint show. This is a absenteeism rate by days data driven bar graph powerpoint show. This is a two stage process. The stages in this process are absenteeism rate by days, days lost per employee per annum, monday, tuesday, wednesday, thursday, friday, saturday.
-
 Direction data rate making electricity sun heat steam stripping
Presenting this set of slides with name - Direction Data Rate Making Electricity Sun Heat Steam Stripping. This is an editable four stages graphic that deals with topics like Direction Data Rate, Making Electricity, Sun Heat, Steam Stripping to help convey your message better graphically. This product is a premium product available for immediate download, and is 100 percent editable in Powerpoint. Download this now and use it in your presentations to impress your audience.
-
 Squirt big data sales talent management growth rate
Presenting this set of slides with name - Squirt Big Data Sales Talent Management Growth Rate. This is an editable five stages graphic that deals with topics like Squirt, Big Data, Sales Talent Management, Growth Rate to help convey your message better graphically. This product is a premium product available for immediate download, and is 100 percent editable in Powerpoint. Download this now and use it in your presentations to impress your audience.
-
 At a glance covering data rate users connection networks battery mobility
Presenting this set of slides with name - At A Glance Covering Data Rate Users Connection Networks Battery Mobility. This is a eight stage process. The stages in this process are At A Glance, Immediately Upon Looking, Quick Meeting.


