Powerpoint Templates and Google slides for Data Illustration
Save Your Time and attract your audience with our fully editable PPT Templates and Slides.
-
 Wheel thirteen illustration data storage broadband tariffs credit cards balance
Deliver a lucid presentation by utilizing this Wheel Thirteen Illustration Data Storage Broadband Tariffs Credit Cards Balance. Use it to present an overview of the topic with the right visuals, themes, shapes, and graphics. This is an expertly designed complete deck that reinforces positive thoughts and actions. Use it to provide visual cues to your audience and help them make informed decisions. A wide variety of discussion topics can be covered with this creative bundle such as Wheel Thirteen, Investment, Services, Infographic, Disk Storage. All the fourteen slides are available for immediate download and use. They can be edited and modified to add a personal touch to the presentation. This helps in creating a unique presentation every time. Not only that, with a host of editable features, this presentation can be used by any industry or business vertical depending on their needs and requirements. The compatibility with Google Slides is another feature to look out for in the PPT slideshow.
-
 Ppt graphical illustration of data process and flows business powerpoint templates 8 stages
Use this diagram to present your contents in a clear and structured manner. Save time and create structured overviews, workflows and processes. This template illustrates your ability.
-
 Graphical illustration of 6 data processes and flows circular network powerpoint templates
We are proud to present our graphical illustration of 6 data processes and flows circular network powerpoint templates. This type of chart is often used to show a central idea in the center circle and items associated with that idea in the circle surrounding it. Deliver amazing presentations to mesmerize your audience.
-
 Data Breach Representing Exposed Project Server Computer Illustrating
Deliver a credible and compelling presentation by deploying this Data Breach Representing Exposed Project Server Computer Illustrating. Intensify your message with the right graphics, images, icons, etc. presented in this complete deck. This PPT template is a great starting point to convey your messages and build a good collaboration. The twelve slides added to this PowerPoint slideshow helps you present a thorough explanation of the topic. You can use it to study and present various kinds of information in the form of stats, figures, data charts, and many more. This Data Breach Representing Exposed Project Server Computer Illustrating PPT slideshow is available for use in standard and widescreen aspects ratios. So, you can use it as per your convenience. Apart from this, it can be downloaded in PNG, JPG, and PDF formats, all completely editable and modifiable. The most profound feature of this PPT design is that it is fully compatible with Google Slides making it suitable for every industry and business domain.
-
 Six dimensions plan illustration data management graphics business improve signal
Introduce your topic and host expert discussion sessions with this Six Dimensions Plan Illustration Data Management Graphics Business Improve Signal. This template is designed using high-quality visuals, images, graphics, etc, that can be used to showcase your expertise. Different topics can be tackled using the twelve slides included in this template. You can present each topic on a different slide to help your audience interpret the information more effectively. Apart from this, this PPT slideshow is available in two screen sizes, standard and widescreen making its delivery more impactful. This will not only help in presenting a birds-eye view of the topic but also keep your audience engaged. Since this PPT slideshow utilizes well-researched content, it induces strategic thinking and helps you convey your message in the best possible manner. The biggest feature of this design is that it comes with a host of editable features like color, font, background, etc. So, grab it now to deliver a unique presentation every time.
-
 Graph Illustrating Big Data Analytics Tools In E Commerce
This slide showcases the statistical graph highlighting big data analytics in e-commerce which helps an organization to understand best and most used tool by businesses. It include details such as records customers entire journey, provides in-depth understanding of markets behavior, etc. Introducing our Graph Illustrating Big Data Analytics Tools In E Commerce set of slides. The topics discussed in these slides are E-Commerce Businesses, Key Insights, Key Reasons. This is an immediately available PowerPoint presentation that can be conveniently customized. Download it and convince your audience.
-
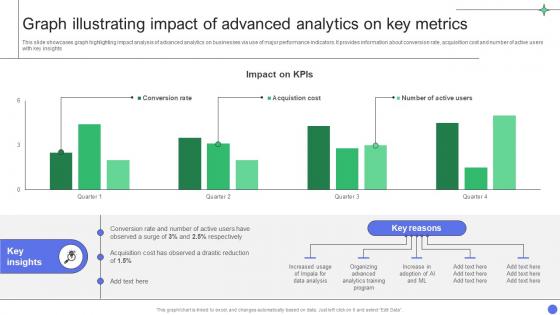 A Comprehensive Guide Graph Illustrating Impact Of Advanced Analytics On Key Metrics Data Analytics SS
This slide showcases graph highlighting impact analysis of advanced analytics on businesses via use of major performance indicators. It provides information about conversion rate, acquisition cost and number of active users with key insights Deliver an outstanding presentation on the topic using this A Comprehensive Guide Graph Illustrating Impact Of Advanced Analytics On Key Metrics Data Analytics SS Dispense information and present a thorough explanation of Drastic Reduction, Analytics Training Program, Data Analysis using the slides given. This template can be altered and personalized to fit your needs. It is also available for immediate download. So grab it now.
-
 Graph Illustrating Impact Of Prescriptive Unlocking The Power Of Prescriptive Data Analytics SS
This slide showcases graph highlighting impact analysis of prescriptive analytics on businesses via use of major performance indicators. It provides information total revenue, inventory levels and labour costs with key insights. Deliver an outstanding presentation on the topic using this Graph Illustrating Impact Of Prescriptive Unlocking The Power Of Prescriptive Data Analytics SS. Dispense information and present a thorough explanation of Labour Costs, Revenue And Inventory Levels, Training Program And Workshops using the slides given. This template can be altered and personalized to fit your needs. It is also available for immediate download. So grab it now.
-
 3d illustration of pie chart data 1
This template is skillfully designed and is completely editable to suit all the needs and requirements of the user. The color of the font, its size, style, and all other elements can be customized according to the user's desire The text in the PPT placeholder can be replaced with the desired information making this template highly flexible and adaptable as well. This template is also compatible with various Microsoft versions and formats like Google Slides, JPG, PDF, etc so the user will face no issue in saving it in the format of his choice.
-
 Data Analytics Big Data Business Intelligence Illustration
This colourful PowerPoint icon on Data Analytics is perfect for presentations, reports, and other documents. It features a vibrant blue, green and yellow colour palette and a high-quality design that will bring life to any project. Its the perfect way to illustrate data-driven insights and analytics in a visually appealing way.
-
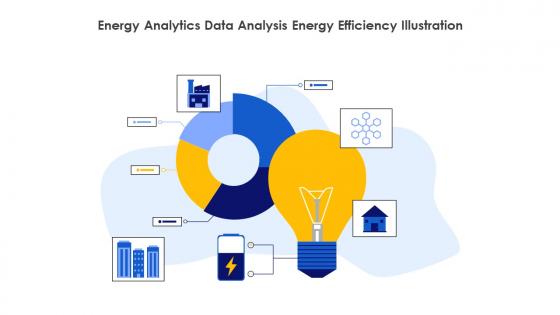 Energy Analytics Data Analysis Energy Efficiency Illustration
This colourful PowerPoint icon is perfect for presentations on energy analytics. It features a graph with a green and yellow background, representing the rise and fall of energy consumption. Its a great visual aid for any energy-related discussion.
-
 Organizing Feature Map Geospatial Data Visualization Illustration
This coloured PowerPoint icon is a great visual aid for organizing feature maps. It is a simple, easy to use template with a bright, colourful design that will help you organize your ideas in a clear and concise way.
-
 Empty File Data Storage File Management Illustration
This coloured powerpoint icon is a visual representation of an empty file. It is a vibrant and eyecatching icon that can be used to indicate the absence of content in a document or presentation.
-
 Research Project Data Analysis Research Methodology Illustration
This coloured PowerPoint Illustration is perfect for representing a research project. It features a magnifying glass over a stack of books, symbolizing exploration and knowledge. The vibrant colours will make your slides stand out and draw attention to your research.
-
 Comprehensive Analysis Of Different Data Lineage Illustration
This coloured PowerPoint icon is a visual representation of a comprehensive analysis of different data lineage classification. It is a helpful tool for understanding the complexities of data lineage and how it affects data processing. It is an ideal resource for data scientists and professionals alike.
-
 Data Research Analysis Collection Illustration
This coloured PowerPoint icon is perfect for presentations on data research. It features a magnifying glass and a graph, symbolizing the process of data collection and analysis. The vibrant colours make it stand out and help to convey the message quickly and effectively.
-
 Data Driven Path For IoT Telecommunications Technology Illustration
This colour PowerPoint icon is a perfect visual representation of data-driven pathways for IoT telecommunications technology. It is a great way to illustrate the importance of data in the development of this technology and its potential for the future.
-
 Learning Process Knowledge Acquisition Data Analysis Illustration
This coloured powerpoint icon is the perfect visual aid to illustrate the learning process. It is vibrant and eye-catching, making it ideal for presentations or educational materials. It can be easily resized and edited to fit any project. Perfect for teachers, students, and professionals alike.
-
 Storage Area Network Attached Storage Data Backup Illustration
This coloured powerpoint icon depicts a Storage Area Network SAN, a high performance network of storage devices that provide shared access to data and centralized storage management. It is ideal for businesses requiring secure, reliable storage and data sharing.
-
 Storage Area Network Data Center Storage Management Illustration
This coloured powerpoint icon depicts a Storage Area Network SAN, a high performance network of storage devices that provide shared access to data and centralized storage management. It is ideal for businesses requiring secure, reliable storage and data sharing.
-
 Storage Area Network Data Replication Virtualization Illustration
This coloured powerpoint icon depicts a Storage Area Network SAN, a high performance network of storage devices that provide shared access to data and centralized storage management. It is ideal for businesses requiring secure, reliable storage and data sharing.
-
 Distinguish Infographic Visualization Data Representation Illustration
This coloured PowerPoint icon is perfect for creating professional-looking infographics. It has a modern design and is easy to use, allowing you to quickly create stunning visuals for presentations and reports.
-
 Hadoop Big Data Illustration
A colourful PowerPoint icon depicting the Hadoop Big Data framework. Perfect for presentations and slideshows, this icon is sure to make your presentations stand out. It is available in a variety of sizes and formats, making it easy to customize for your specific needs.
-
 Man Sends Statistics Data Analysis Statistical Analysis Illustration
This coloured powerpoint icon is perfect for presentations on data analysis. It features a man in a suit holding a graph, representing the transmission of statistical information. It is a great visual aid to demonstrate the importance of data in decision making.
-
 IoT Smart Grid Automation Big Data Illustration
This coloured PowerPoint icon is perfect for representing IoT Smart Grid technology. It features a bright and vibrant design that will make your presentation stand out. Its easy to use and can be used to illustrate the power of smart grid technology.
-
 Problem Statement Data Illustration
This colourful PowerPoint icon is a great visual aid for representing a problem statement. It features a question mark inside a speech bubble, making it an eye catching and effective way to communicate a problem. Use it to highlight an issue in a presentation or report.
-
 Analyzing Dashboard Data Visualization Metrics Illustration
This colored PowerPoint icon is perfect for visualizing data and analyzing dashboard. It features a graph, charts, and other elements to help you track and analyze data quickly and easily. Perfect for presentations and reports.
-
 Data Exchange Transfer And Migration Illustration
This coloured PowerPoint icon features a two way data exchange, with a blue arrow pointing in one direction and an orange arrow pointing in the other. It is a perfect visual representation of data exchange and is ideal for presentations and slideshows.
-
 Working On Data Analysis Statistical Illustration
This colourful PowerPoint icon is perfect for presentations on working on analysis. It features a magnifying glass, a chart, and a pen, representing the process of researching and analysing data. Its a great visual aid to help explain your ideas.
-
 Automated Data Collection Illustration
Introducing the perfect icon to represent data operating by machine on your website. This vibrant and eye-catching powerpoint icon is designed to showcase the seamless integration of technology and data management. Use it to enhance the visual appeal of your website and convey the message of efficient data processing.
-
 Construction Data Analysis Illustration
This brightly coloured PowerPoint icon features a group of engineers hard at work on a construction site. With vibrant hues and detailed graphics, this icon is perfect for presentations related to engineering, construction, and teamwork. Add a pop of colour and professionalism to your slides with this eye-catching icon.
-
 Data Driven Marketing Illustration
This vibrant PowerPoint icon features a bold and eye-catching design that represents the concept of Big Data in Digital Marketing. The bright colors and modern graphics make it the perfect addition to any presentation or marketing material related to this topic. Grab your audiences attention and showcase your expertise with this dynamic icon.
-
 Data Organization Illustration
This vibrant powerpoint icon is the perfect addition to your Smartsheet project. Featuring a bold colour scheme and sleek design, it will add a professional touch to any presentation. Easily customizable and compatible with Smartsheet, this icon will help you streamline your project management process.
-
 Data Protection Information Cybersecurity Illustration
This coloured PowerPoint icon is the perfect visual aid for presentations on safeguarding businesses with data loss prevention. Its eye-catching design and vibrant colours will capture the attention of your audience, while effectively representing the importance of protecting sensitive data in the workplace. Add it to your slides for a professional and impactful touch.
-
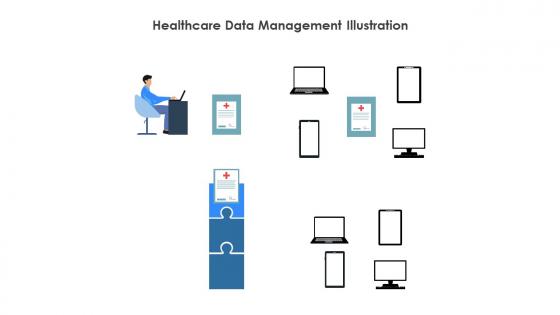 Healthcare Data Management Illustration
This colourful PowerPoint icon showcases the complex process of blockchain technology in managing medical records and data. With its vibrant design and clear visuals, it effectively conveys the concept of secure and decentralized data storage. Perfect for presentations and educational materials on blockchain in healthcare.
-
 Healthcare Data Storage On Blockchain Illustration
This coloured powerpoint icon represents the use of blockchain technology in healthcare systems. It showcases the secure and transparent nature of blockchain, making it an ideal solution for storing and sharing sensitive medical data. Use this icon to visually communicate the benefits of blockchain in revolutionizing healthcare systems.
-
 Biometric Data Health Monitoring Illustration
Enhance your presentations with our Smart Skin Sensors PowerPoint icon. This vibrant and eye-catching icon represents the latest technology in wearable sensors, allowing for real-time tracking and monitoring of vital signs. Perfect for showcasing advancements in healthcare, fitness, and wellness industries. Download now and make your presentations stand out.
-
 Digital Certificate Data Security Illustration
This coloured PowerPoint icon features a lock symbol on a blue background, representing the Secure Socket Layer SSL protocol for secure online communication. Use it to enhance your presentations on internet security, encryption, and data protection. Perfect for technology and cybersecurity related presentations.
-
 Encryption Data Protection Illustration
This colourful PowerPoint icon showcases the relationship between BYOE Bring Your Own Encryption and Hardware Security Module HSM. It represents the seamless integration and collaboration between these two important components in ensuring robust data security. Perfect for presentations and educational materials on data encryption and HSM technology.
-
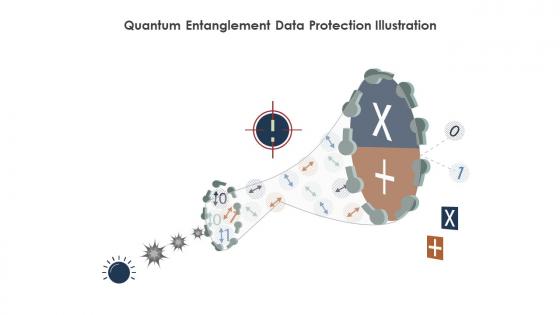 Quantum Entanglement Data Protection Illustration
Enhance your presentations with our colourful PowerPoint icon depicting the complex workings of quantum encryption technology. Perfect for showcasing the advanced security measures used in data protection, this icon is a must-have for any tech-savvy professional. Add a touch of sophistication to your slides and impress your audience with this eye-catching icon
-
 Business Man Analyses Market Research Data Illustration
This vibrant PowerPoint icon features a professional project manager, perfect for presentations and reports related to project management. The icon is designed with bold colors and clean lines, making it eye-catching and easy to incorporate into any presentation. Ideal for showcasing leadership and organizational skills in project management.
-
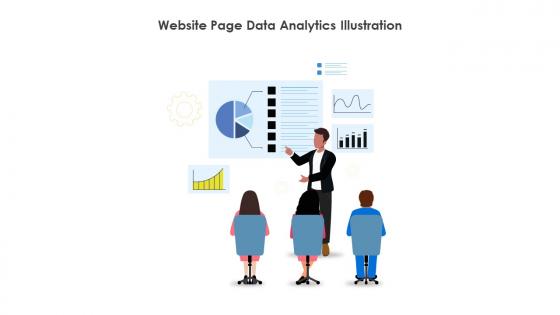 Website Page Data Analytics Illustration
This vibrant PowerPoint icon features a bold color palette and sleek design, making it perfect for presentations on data analytics. With its eye-catching appearance and clear imagery, this icon is sure to capture the attention of your audience and enhance the visual appeal of your slides.
-
 Process of big data illustration from various sources ppt slides
Presenting process of big data illustration from various sources ppt slides. This is a process of big data illustration from various sources ppt slides. This is a eight stage process. The stages in this process are field feedback, disease prevalence, payer coverage and contracts, plans policies and formulary, reps accounts and territories, sales, distribution and warehouse, copays patient assistance services, big data sources.
-
 Demography Icon Illustrating Data Of Potential Customer
Presenting our well-structured Demography Icon Illustrating Data Of Potential Customer. The topics discussed in this slide are Demography Icon, Illustrating Data, Potential Customer. This is an instantly available PowerPoint presentation that can be edited conveniently. Download it right away and captivate your audience.
-
 Analyze Data Data Analysis Data Mining Illustration
This colourful PowerPoint icon depicts a person analyzing data. It is perfect for presentations about data analysis, data science, and data visualization. It can be used to illustrate the importance of data analysis and its impact on decision-making.
-
 Data Illustration In Powerpoint And Google Slides Cpb
Presenting Data Illustration In Powerpoint And Google Slides Cpb slide which is completely adaptable. The graphics in this PowerPoint slide showcase five stages that will help you succinctly convey the information. In addition, you can alternate the color, font size, font type, and shapes of this PPT layout according to your content. This PPT presentation can be accessed with Google Slides and is available in both standard screen and widescreen aspect ratios. It is also a useful set to elucidate topics like Data Illustration. This well structured design can be downloaded in different formats like PDF, JPG, and PNG. So, without any delay, click on the download button now.
-
 Data Analysis Visualization Graphs Illustration
Brightly powerpoint Illustration with a bar graph to represent data visualization. Perfect for presentations, reports, and other documents to illustrate data points and trends.
-
 AI Data Checking Machine Learning Automated Analysis Illustration
This coloured PowerPoint Illustration on Artificial Intelligence Data Checking is a perfect visual aid to help explain the concept of AI data verification. It is a great resource for presentations, lectures, and other educational materials. It is a simple yet powerful way to illustrate the importance of AI data checking.
-
 Data Analytics Business Intelligence Big Data Illustration
This coloured powerpoint Illustration is perfect for presentations on data analytics. It features a vibrant blue and green colour scheme, with a graph and chart image to represent data analysis. It is a great visual aid to help communicate complex data in an easy to understand format.
-
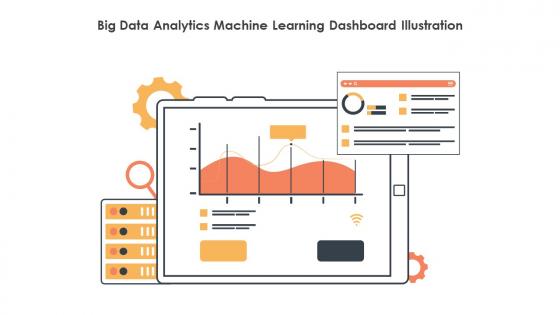 Big Data Analytics Machine Learning Dashboard Illustration
This coloured powerpoint Illustration provides an overview of cost reduction techniques to increase profitability. It is a useful tool for businesses to identify areas of potential cost savings and to develop strategies to improve their bottom line.
-
 Data Stewardship Model Governance And Quality Illustration
This coloured PowerPoint Illustration depicts a Data Stewardship Model, which is a framework for data governance and management. It outlines the roles and responsibilities for data stewards, owners, and users, and helps organizations ensure data accuracy and security.
-
 Data Structure In DBMS Database Design Indexing Illustration
Data Structure in DBMS PowerPoint Icon A colourful icon depicting a data structure in DBMS. Perfect for presentations, slideshows, and reports. Ideal for students, professionals, and teachers.
-
 Data Subject Area Stewardship Model Illustration
This coloured PowerPoint Illustration depicts a Data Subject Area Stewardship Model, which provides a comprehensive framework to ensure the security and privacy of personal data. It outlines the roles and responsibilities of data stewardship, data governance, and data management. This Illustration is a great visual representation of the data stewardship process.
-
 Implementation Process Management Data Governance Illustration
This coloured powerpoint Illustration is the perfect visual representation of the implementation process. It features a series of steps with arrows to show the order of operations and is a great way to illustrate the process to any audience.
-
 Upload File Transfer Data Storage Illustration
This coloured powerpoint Illustration is a great way to add a visual element to your presentation. It is easy to use and comes in a variety of colours to choose from, making it perfect for any presentation. It is a great way to make your presentation stand out and capture the attention of your audience.
-
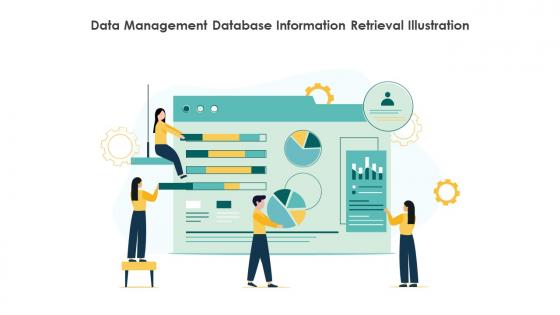 Data Management Database Information Retrieval Illustration
This coloured PowerPoint Illustration is perfect for presentations on data management. It features a bright and vibrant design, with a silhouette of a person in the centre surrounded by a variety of colourful shapes. It is a great visual aid to help explain complex concepts and processes.
-
 Financial Statistics Economic Data Investment Analysis Illustration
This coloured PowerPoint Illustration is a visual representation of financial statistics. It features a graph with a blue line, a green bar, and a red arrow. The Illustration is ideal for presentations and reports related to financial data.
-
 Sync Management Data Synchronization Illustration
This colourful PowerPoint Illustration is perfect for adding a modern, professional touch to your presentation. It is easy to use and can be quickly customized to fit your needs. Add a splash of colour to your slides and make them stand out.
-
 Healthcare Cyber Security Compliance Data Encryption Illustration
This coloured PowerPoint Illustration is designed to represent healthcare cyber security. It features a blue shield with a white cross in the center, symbolizing protection against malicious cyber threats. It is a perfect visual aid for any presentation on the importance of cyber security in healthcare.
-
 Isometric Server Room And Big Data Illustration
This isometric server room and big data Illustration is a vibrant and eye-catching way to represent your data center. The colorful and detailed image is perfect for presentations, websites, and more. Get your message across with this powerful visual representation of your data center.


