Powerpoint Templates and Google slides for Data analytics dashboard
Save Your Time and attract your audience with our fully editable PPT Templates and Slides.
-
 Big Data Governance Challenges Roadmap Processes Strategy Analytics Dashboard
This complete deck can be used to present to your team. It has PPT slides on various topics highlighting all the core areas of your business needs. This complete deck focuses on Big Data Governance Challenges Roadmap Processes Strategy Analytics Dashboard and has professionally designed templates with suitable visuals and appropriate content. This deck consists of total of thirteen slides. All the slides are completely customizable for your convenience. You can change the colour, text and font size of these templates. You can add or delete the content if needed. Get access to this professionally designed complete presentation by clicking the download button below.
-
 Data Analytic Icon Business Growth Analysis Gear Magnifying Glass Dashboard
This complete deck can be used to present to your team. It has PPT slides on various topics highlighting all the core areas of your business needs. This complete deck focuses on Data Analytic Icon Business Growth Analysis Gear Magnifying Glass Dashboard and has professionally designed templates with suitable visuals and appropriate content. This deck consists of total of twelve slides. All the slides are completely customizable for your convenience. You can change the colour, text and font size of these templates. You can add or delete the content if needed. Get access to this professionally designed complete presentation by clicking the download button below.
-
 Data Business Analytics Dollar Storage Marketing Dashboard Customers
If you require a professional template with great design, then this Data Business Analytics Dollar Storage Marketing Dashboard Customers is an ideal fit for you. Deploy it to enthrall your audience and increase your presentation threshold with the right graphics, images, and structure. Portray your ideas and vision using twelve slides included in this complete deck. This template is suitable for expert discussion meetings presenting your views on the topic. With a variety of slides having the same thematic representation, this template can be regarded as a complete package. It employs some of the best design practices, so everything is well-structured. Not only this, it responds to all your needs and requirements by quickly adapting itself to the changes you make. This PPT slideshow is available for immediate download in PNG, JPG, and PDF formats, further enhancing its usability. Grab it by clicking the download button.
-
 Advanced Data Analytics Dashboard For Search Engine
This slide depicts the advanced data analytics dashboard for search engine. The purpose of this template is to help the investor determine the efficiency of search engine through the study of various indicators such as number of sessions, bounce rate, average time per session, etc.Presenting our well structured Advanced Data Analytics Dashboard For Search Engine. The topics discussed in this slide are Communication Channel, Organic Search, Organic Search. This is an instantly available PowerPoint presentation that can be edited conveniently. Download it right away and captivate your audience.
-
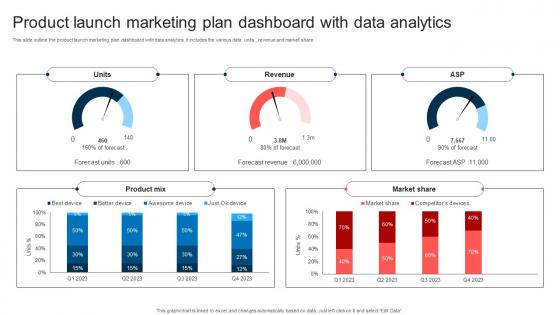 Product Launch Marketing Plan Dashboard With Data Analytics
This slide outline the product launch marketing plan dashboard with data analytics. It includes the various data units , revenue and market share Introducing our Product Launch Marketing Plan Dashboard With Data Analytics set of slides. The topics discussed in these slides are Marketing, Dashboard, Analytics. This is an immediately available PowerPoint presentation that can be conveniently customized. Download it and convince your audience.
-
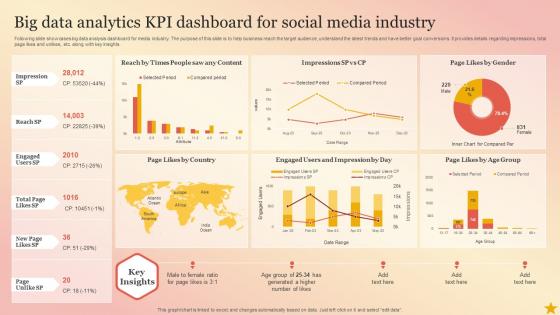 Big Data Analytics Kpi Dashboard For Social Media Industry
Following slide showcases big data analysis dashboard for media industry. The purpose of this slide is to help business reach the target audience, understand the latest trends and have better goal conversions. It provides details regarding impressions, total page likes and unlikes, etc. along with key insights. Introducing our Big Data Analytics Kpi Dashboard For Social Media Industry set of slides. The topics discussed in these slides are Page Likes By Gender, Page Likes By Country. This is an immediately available PowerPoint presentation that can be conveniently customized. Download it and convince your audience.
-
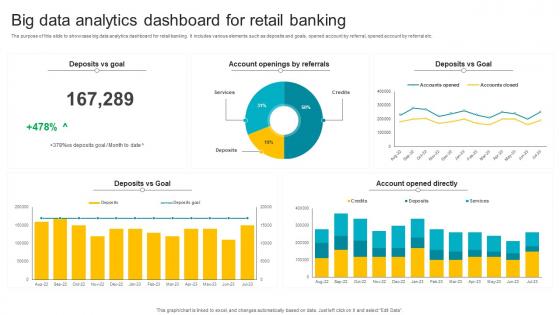 Big Data Analytics Dashboard For Retail Banking
The purpose of this slide to showcase big data analytics dashboard for retail banking. It includes various elements such as deposits and goals, opened account by referral, opened account by referral etc. Introducing our Big Data Analytics Dashboard For Retail Banking set of slides. The topics discussed in these slides are Account Openings By Referrals, Deposits Vs Goal. This is an immediately available PowerPoint presentation that can be conveniently customized. Download it and convince your audience.
-
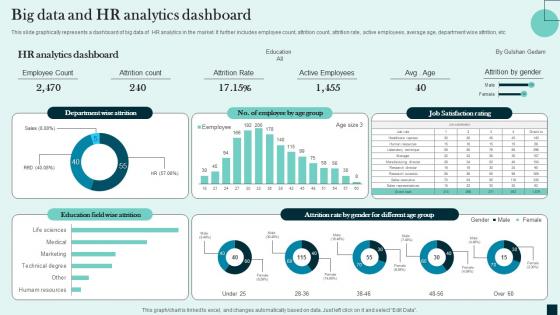 Big Data And HR Analytics Dashboard
This slide graphically represents a dashboard of big data of HR analytics in the market. It further includes employee count, attrition count, attrition rate, active employees, average age, department wise attrition, etc. Presenting our well structured Big Data And HR Analytics Dashboard. The topics discussed in this slide are Data, Analytics, Employee. This is an instantly available PowerPoint presentation that can be edited conveniently. Download it right away and captivate your audience.
-
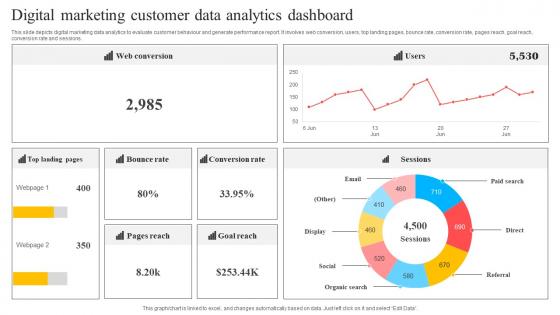 Digital Marketing Customer Data Analytics Dashboard
This slide depicts digital marketing data analytics to evaluate customer behaviour and generate performance report. It involves web conversion, users, top landing pages, bounce rate, conversion rate, pages reach, goal reach, conversion rate and sessions. Introducing our Digital Marketing Customer Data Analytics Dashboard set of slides. The topics discussed in these slides are Bounce Rate, Conversion Rate, Goal Reach. This is an immediately available PowerPoint presentation that can be conveniently customized. Download it and convince your audience.
-
 Online Marketing Ad Data Science Analytics Dashboard
This slide includes the dashboard for data science analysis for online marketing ad performance evaluation. This includes various KPIs such as Ad spend, Ad reach, Ad clicks, CPC, etc. Introducing our Online Marketing Ad Data Science Analytics Dashboard set of slides. The topics discussed in these slides are Marketing, Data, Analytics. This is an immediately available PowerPoint presentation that can be conveniently customized. Download it and convince your audience.
-
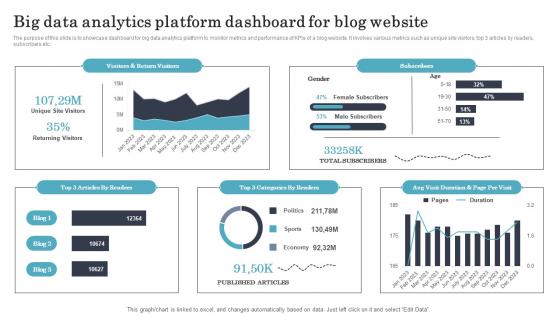 Big Data Analytics Platform Dashboard For Blog Website
The purpose of this slide is to showcase dashboard for big data analytics platform to monitor metrics and performance of KPIs of a blog website. It involves various metrics such as unique site visitors, top 3 articles by readers, subscribers etc. Introducing our Big Data Analytics Platform Dashboard For Blog Website set of slides. The topics discussed in these slides are Subscribers, Categories By Readers. This is an immediately available PowerPoint presentation that can be conveniently customized. Download it and convince your audience.
-
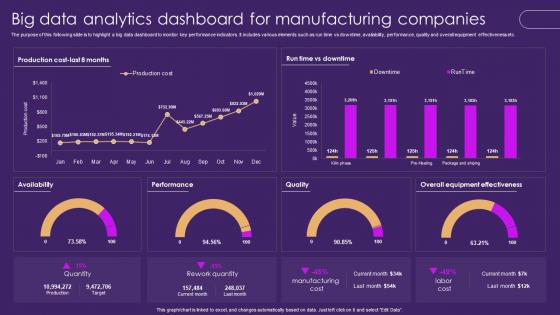 Big Data Analytics Dashboard For Manufacturing Companies
The purpose of this following slide is to highlight a big data dashboard to monitor key performance indicators. It includes various elements such as run time vs downtime, availability, performance, quality and overall equipment effectiveness etc. Introducing our Big Data Analytics Dashboard For Manufacturing Companies set of slides. The topics discussed in these slides are Performance, Quality, Overall Equipment Effectiveness. This is an immediately available PowerPoint presentation that can be conveniently customized. Download it and convince your audience.
-
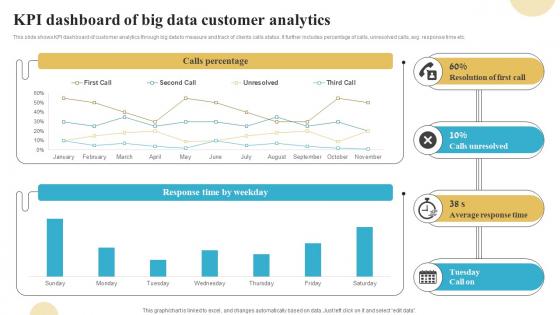 Kpi Dashboard Of Big Data Customer Analytics
This slide shows KPI dashboard of customer analytics through big data to measure and track of clients calls status. It further includes percentage of calls, unresolved calls, avg. response time etc. Presenting our well structured Kpi Dashboard Of Big Data Customer Analytics. The topics discussed in this slide are Calls Percentage, Resolution Of First Call, Calls Unresolved. This is an instantly available PowerPoint presentation that can be edited conveniently. Download it right away and captivate your audience.
-
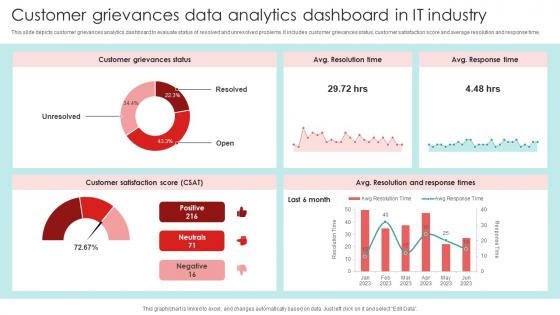 Customer Grievances Data Analytics Dashboard In IT Industry
This slide depicts customer grievances analytics dashboard to evaluate status of resolved and unresolved problems. It includes customer grievances status, customer satisfaction score and average resolution and response time. Introducing our Customer Grievances Data Analytics Dashboard In IT Industry set of slides. The topics discussed in these slides are Customer, Analytics, Industry. This is an immediately available PowerPoint presentation that can be conveniently customized. Download it and convince your audience.
-
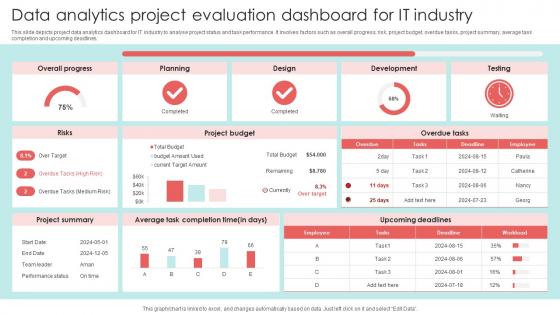 Data Analytics Project Evaluation Dashboard For IT Industry
This slide depicts project data analytics dashboard for IT industry to analyse project status and task performance. It involves factors such as overall progress, risk, project budget, overdue tasks, project summary, average task completion and upcoming deadlines. Presenting our well structured Data Analytics Project Evaluation Dashboard For IT Industry. The topics discussed in this slide are Analytics, Progress, Planning. This is an instantly available PowerPoint presentation that can be edited conveniently. Download it right away and captivate your audience.
-
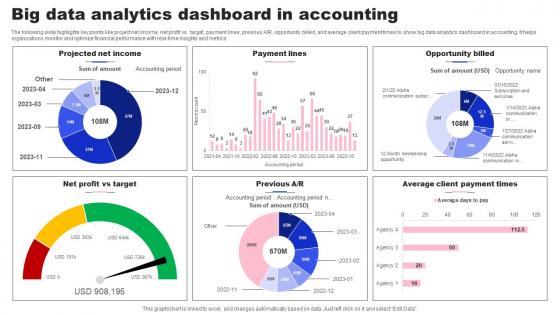 Big Data Analytics Dashboard In Accounting
The following slide highlights key points like project net income, net profit vs. target, payment lines, previous A R, opportunity billed, and average client payment times to show big data analytics dashboard in accounting. It helps organizations monitor and optimize financial performance with real-time insights and metrics. Presenting our well structured Big Data Analytics Dashboard In Accounting. The topics discussed in this slide are Payment Lines, Profit Vs Target. This is an instantly available PowerPoint presentation that can be edited conveniently. Download it right away and captivate your audience.
-
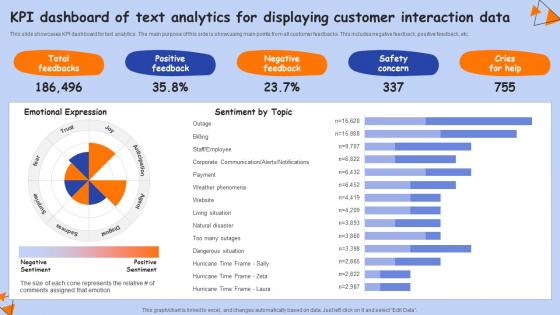 KPI Dashboard Of Text Analytics For Displaying Customer Interaction Data
This slide showcases KPI dashboard for text analytics. The main purpose of this side is showcasing main points from all customer feedbacks. This includes negative feedback, positive feedback, etc.Introducing our KPI Dashboard Of Text Analytics For Displaying Customer Interaction Data set of slides. The topics discussed in these slides are Corporate Communication, Weather Phenomena, Natural Disaster. This is an immediately available PowerPoint presentation that can be conveniently customized. Download it and convince your audience.
-
 Client Satisfaction Data Analytics Dashboard
This slide shows customer data analytics dashboard that can be used to summaries annual data for compiling data. It include figures related to requests answered, total requests and satisfaction rate, etc.Introducing our Client Satisfaction Data Analytics Dashboard set of slides. The topics discussed in these slides are Requests Answered, Total Requests, Total Revenue. This is an immediately available PowerPoint presentation that can be conveniently customized. Download it and convince your audience.
-
 Data Analytics Dashboard To Determine Client Behaviour
This slide shows customer patterns related data analytics dashboard that can be used to analyse current customer trends for making policies. It include shopping behavioural insights, customer conversion rate, etc.Presenting our well structured Data Analytics Dashboard To Determine Client Behaviour. The topics discussed in this slide are Customers Conversion, Shopping Behavioural, Shopping Activity This is an instantly available PowerPoint presentation that can be edited conveniently. Download it right away and captivate your audience.
-
 Global Regions Client Data Insights And Analytics Dashboard
This slide shows customer data analytics dashboard that can be used to summarise region wise sales distribution across the globe. It include weekly conversion rate, regional conversion rate and margin ratios, etc.Introducing our Global Regions Client Data Insights And Analytics Dashboard set of slides. The topics discussed in these slides are Regional Conversion, Weekly Conversion, Region Launched. This is an immediately available PowerPoint presentation that can be conveniently customized. Download it and convince your audience.
-
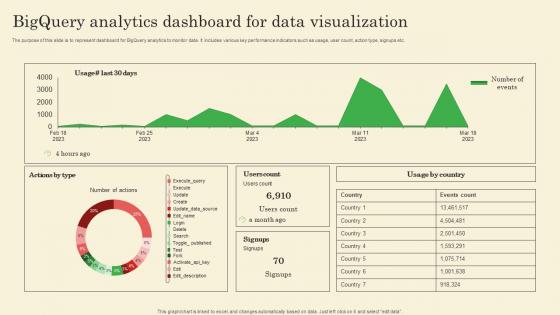 Bigquery Analytics Dashboard For Data Visualization
The purpose of this slide is to represent dashboard for BigQuery analytics to monitor data. It includes various key performance indicators such as usage, user count, action type, signups etc. Introducing our Bigquery Analytics Dashboard For Data Visualization set of slides. The topics discussed in these slides are Users Count, Usage By Country. This is an immediately available PowerPoint presentation that can be conveniently customized. Download it and convince your audience.
-
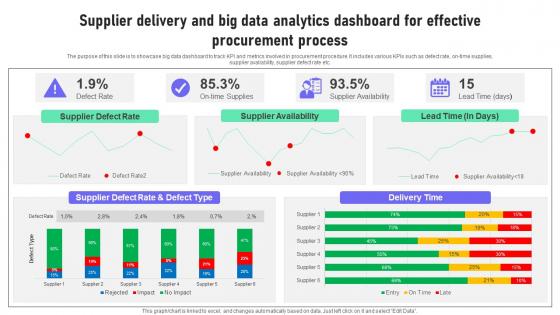 Supplier Delivery And Big Data Analytics Dashboard For Effective Procurement Process
The purpose of this slide is to showcase big data dashboard to track KPI and metrics involved in procurement procedure. It includes various KPIs such as defect rate, on-time supplies, supplier availability, supplier defect rate etc. Presenting our well structured Supplier Delivery And Big Data Analytics Dashboard For Effective Procurement Process. The topics discussed in this slide are Procurement, Process, Dashboard. This is an instantly available PowerPoint presentation that can be edited conveniently. Download it right away and captivate your audience.
-
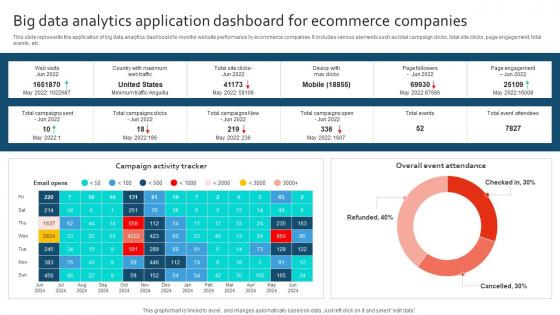 Big Data Analytics Application Dashboard For Ecommerce Companies
This slide represents the application of big data analytics dashboard to monitor website performance by ecommerce companies. It includes various elements such as total campaign clicks, total site clicks, page engagement, total events, etc. Introducing our Big Data Analytics Application Dashboard For Ecommerce Companies set of slides. The topics discussed in these slides are Campaign Activity Tracker, Ecommerce Companies. This is an immediately available PowerPoint presentation that can be conveniently customized. Download it and convince your audience.
-
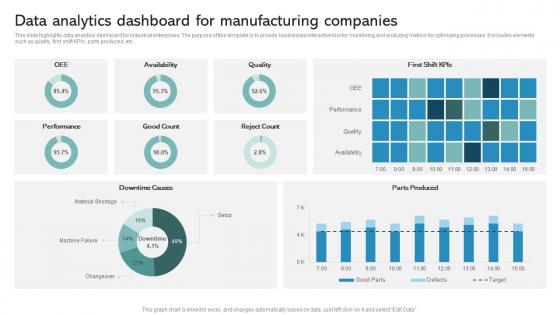 Data Analytics Dashboard For Manufacturing Companies
This slide highlights data analytics dashboard for industrial enterprises. The purpose of this template is to provide businesses interactive tool for monitoring and analyzing metrics for optimizing processes. It includes elements such as quality, first shift KPIs, parts produced, etc. Introducing our Data Analytics Dashboard For Manufacturing Companies set of slides. The topics discussed in these slides are Performance, Good Count, Reject Count, Availability, Quality. This is an immediately available PowerPoint presentation that can be conveniently customized. Download it and convince your audience.
-
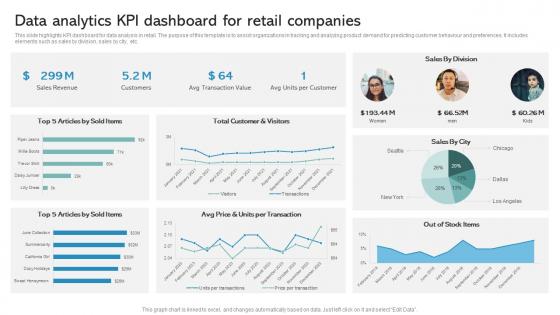 Data Analytics KPI Dashboard For Retail Companies
This slide highlights KPI dashboard for data analysis in retail. The purpose of this template is to assist organizations in tracking and analyzing product demand for predicting customer behaviour and preferences. It includes elements such as sales by division, sales by city, etc. Presenting our well structured Data Analytics KPI Dashboard For Retail Companies. The topics discussed in this slide are Total Customer And Visitors, Units Per Transaction, Articles By Sold Items. This is an instantly available PowerPoint presentation that can be edited conveniently. Download it right away and captivate your audience.
-
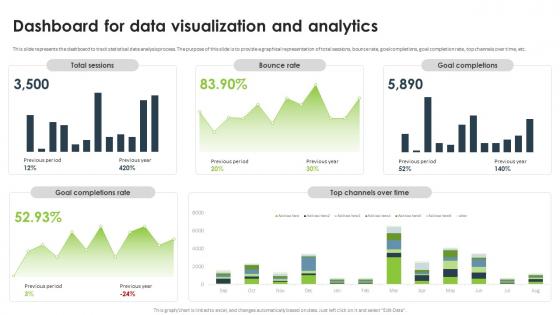 Statistical Analysis For Data Driven Dashboard For Data Visualization And Analytics
This slide represents the dashboard to track statistical data analysis process. The purpose of this slide is to provide a graphical representation of total sessions, bounce rate, goal completions, goal completion rate, top channels over time, etc. Present the topic in a bit more detail with this Statistical Analysis For Data Driven Dashboard For Data Visualization And Analytics. Use it as a tool for discussion and navigation on Data Visualization And Analytics, Bounce Rate, Goal Completions, Goal Completion Rate. This template is free to edit as deemed fit for your organization. Therefore download it now.
-
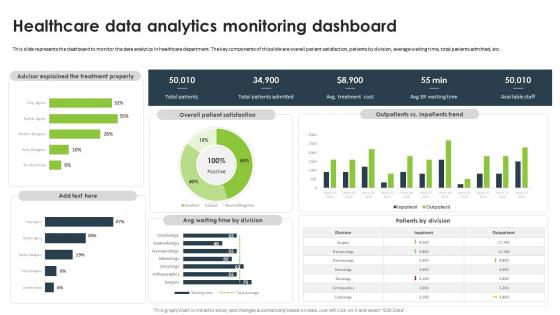 Statistical Analysis For Data Driven Healthcare Data Analytics Monitoring Dashboard
This slide represents the dashboard to monitor the data analytics in healthcare department. The key components of this slide are overall patient satisfaction, patients by division, average waiting time, total patients admitted, etc. Present the topic in a bit more detail with this Statistical Analysis For Data Driven Healthcare Data Analytics Monitoring Dashboard. Use it as a tool for discussion and navigation on Healthcare Data Analytics, Monitoring Dashboard, Healthcare Department. This template is free to edit as deemed fit for your organization. Therefore download it now.
-
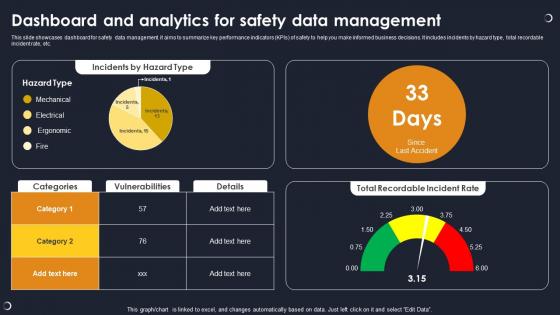 Dashboard And Analytics For Safety Data Management
This slide showcases dashboard for safety data management. it aims to summarize key performance indicators KPIs of safety to help you make informed business decisions. It includes incidents by hazard type, total recordable incident rate, etc. Presenting our well structured Dashboard And Analytics For Safety Data Management. The topics discussed in this slide are Incidents By Hazard Type, Vulnerabilities, Total Recordable Incident Rate. This is an instantly available PowerPoint presentation that can be edited conveniently. Download it right away and captivate your audience.
-
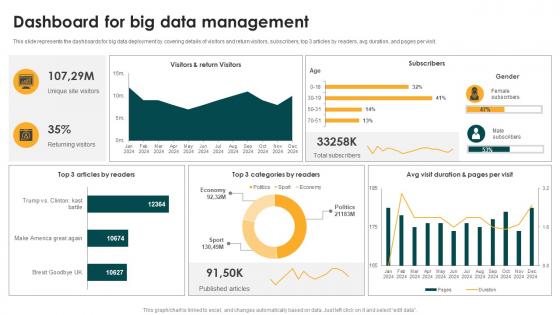 Dashboard For Big Data Management Big Data Analytics And Management
This slide represents the dashboards for big data deployment by covering details of visitors and return visitors, subscribers, top 3 articles by readers, avg duration, and pages per visit. Present the topic in a bit more detail with this Dashboard For Big Data Management Big Data Analytics And Management. Use it as a tool for discussion and navigation on Dashboard For Big Data Management. This template is free to edit as deemed fit for your organization. Therefore download it now.
-
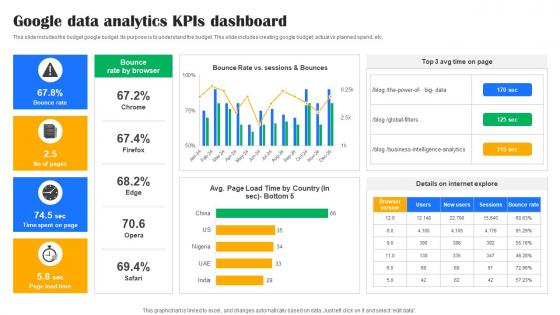 Google Data Analytics KPIS Dashboard
This slide includes the budget google budget. Its purpose is to understand the budget. This slide includes creating google budget, actual vs planned spend, etc. Introducing our Google Data Analytics KPIS Dashboard set of slides. The topics discussed in these slides are Data Analytics, KPIS Dashboard This is an immediately available PowerPoint presentation that can be conveniently customized. Download it and convince your audience.
-
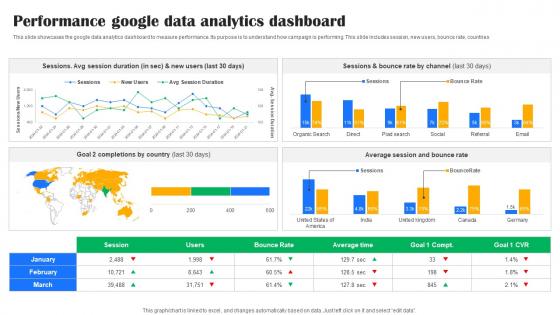 Performance Google Data Analytics Dashboard
This slide showcases the google data analytics dashboard to measure performance. Its purpose is to understand how campaign is performing. This slide includes session, new users, bounce rate, countries. Introducing our Performance Google Data Analytics Dashboard set of slides. The topics discussed in these slides are Performance, Google Data Analytics, Dashboard This is an immediately available PowerPoint presentation that can be conveniently customized. Download it and convince your audience.
-
 Implementing Big Data Analytics Effective Supplier Performance Assessment Dashboard CRP DK SS
This slide showcases dashboard for analyzing supplier performance with KPIs such as defect rate, on time supplies, average procurement cycle, delivery time etc. Deliver an outstanding presentation on the topic using this Implementing Big Data Analytics Effective Supplier Performance Assessment Dashboard CRP DK SS. Dispense information and present a thorough explanation of Analyzing Supplier Performance, Average Procurement Cycle, Assessment Dashboard using the slides given. This template can be altered and personalized to fit your needs. It is also available for immediate download. So grab it now.
-
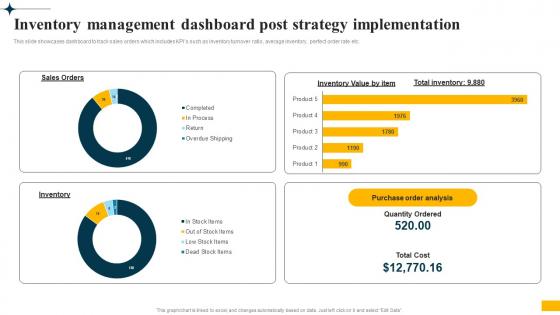 Implementing Big Data Analytics Inventory Management Dashboard Post Strategy Implementation CRP DK SS
This slide showcases dashboard to track sales orders which includes KPIs such as inventory turnover ratio, average inventory, perfect order rate etc. Deliver an outstanding presentation on the topic using this Implementing Big Data Analytics Inventory Management Dashboard Post Strategy Implementation CRP DK SS. Dispense information and present a thorough explanation of Inventory Management Dashboard, Post Strategy Implementation, Dashboard To Track Sales using the slides given. This template can be altered and personalized to fit your needs. It is also available for immediate download. So grab it now.
-
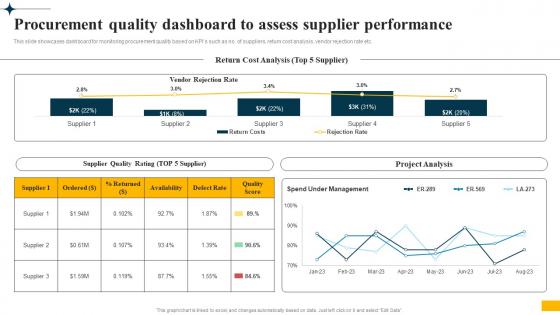 Implementing Big Data Analytics Procurement Quality Dashboard To Assess Supplier Performance CRP DK SS
This slide showcases dashboard for monitoring procurement quality based on KPIs such as no. of suppliers, return cost analysis, vendor rejection rate etc. Present the topic in a bit more detail with this Implementing Big Data Analytics Procurement Quality Dashboard To Assess Supplier Performance CRP DK SS. Use it as a tool for discussion and navigation on Procurement Quality Dashboard, Assess Supplier Performance, Vendor Rejection Rate. This template is free to edit as deemed fit for your organization. Therefore download it now.
-
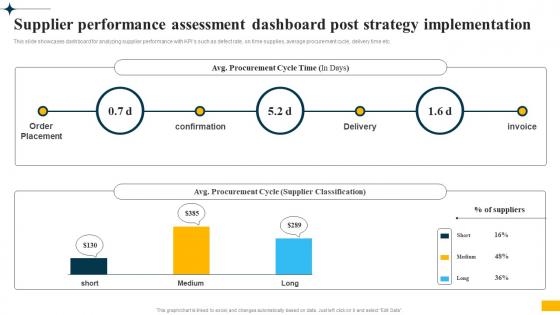 Implementing Big Data Analytics Supplier Performance Assessment Dashboard Post Strategy CRP DK SS
This slide showcases dashboard for analyzing supplier performance with KPIs such as defect rate, on time supplies, average procurement cycle, delivery time etc. Deliver an outstanding presentation on the topic using this Implementing Big Data Analytics Supplier Performance Assessment Dashboard Post Strategy CRP DK SS. Dispense information and present a thorough explanation of Supplier Performance Assessment, Dashboard Post, Strategy Implementation, Average Procurement Cycle using the slides given. This template can be altered and personalized to fit your needs. It is also available for immediate download. So grab it now.
-
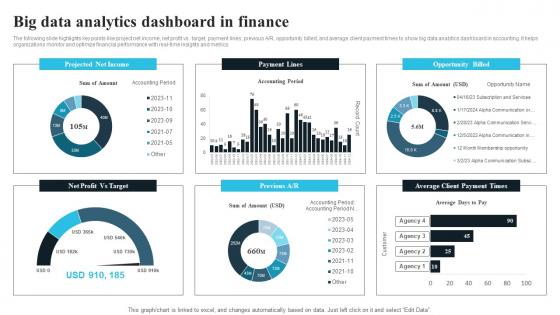 Big Data Analytics Dashboard In Finance
The following slide highlights key points like project net income, net profit vs. target, payment lines, previous AR, opportunity billed, and average client payment times to show big data analytics dashboard in accounting. It helps organizations monitor and optimize financial performance with real-time insights and metrics. Introducing our Big Data Analytics Dashboard In Finance set of slides. The topics discussed in these slides are Projected Net Income, Opportunity Billed. This is an immediately available PowerPoint presentation that can be conveniently customized. Download it and convince your audience.
-
 Big Data Analytics Dashboard For Electric Energy Sector Industries
This slide represents the dashboard of big data analytics providing key insights to enhance energy sector efficiency. It includes various KPIs such as total consumption, power cuts, etc. Introducing our Big Data Analytics Dashboard For Electric Energy Sector Industries set of slides. The topics discussed in these slides are Big Data Analytics Dashboard, Electric Energy Sector Industries. This is an immediately available PowerPoint presentation that can be conveniently customized. Download it and convince your audience.
-
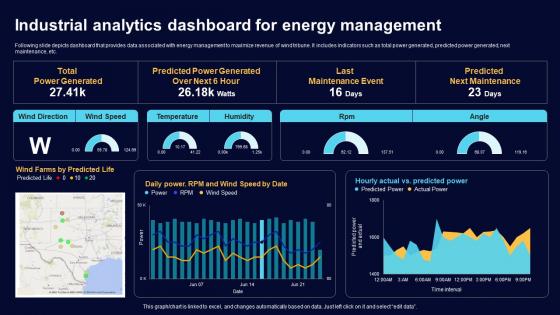 Industrial Analytics Dashboard For Energy Comprehensive Guide For Big Data IoT SS
Following slide depicts dashboard that provides data associated with energy management to maximize revenue of wind tribune. It includes indicators such as total power generated, predicted power generated, next maintenance, etc.Present the topic in a bit more detail with this Industrial Analytics Dashboard For Energy Comprehensive Guide For Big Data IoT SS. Use it as a tool for discussion and navigation on Power Generated, Predicted Power, Maintenance Event. This template is free to edit as deemed fit for your organization. Therefore download it now.
-
 IoT Big Data Analytics Dashboard For Manufacturing Comprehensive Guide For Big Data IoT SS
Following slide depicts dashboard that provides real time data about manufacturing industry operations and production. It includes metrics such as productivity, units cost, operators available by function, etc.Present the topic in a bit more detail with this IoT Big Data Analytics Dashboard For Manufacturing Comprehensive Guide For Big Data IoT SS. Use it as a tool for discussion and navigation on Understand Customer, Improve Customer Engagement, Customer Personalized. This template is free to edit as deemed fit for your organization. Therefore download it now.
-
 Big Data Analytics Dashboard To Track Retail Big Data Analytics Applications Data Analytics SS
This slide showcases dashboard for monitoring retail business performance which helps in improving revenue generation. It provides information regarding KPIs such as gross margin, sales, card abandonment rate, average unit price etc. Present the topic in a bit more detail with this Big Data Analytics Dashboard To Track Retail Big Data Analytics Applications Data Analytics SS. Use it as a tool for discussion and navigation on Cart Abandonment Rate, Average Transactions. This template is free to edit as deemed fit for your organization. Therefore download it now.
-
 Data Analytics Dashboard To Track Hospital Big Data Analytics Applications Data Analytics SS
This slide showcases dashboard for tracking hospitals activities which helps in improving performance efficiency. It provides information regarding bed occupancy rate, patient satisfaction rate, staff to patient ratio, room turnover etc. Present the topic in a bit more detail with this Data Analytics Dashboard To Track Hospital Big Data Analytics Applications Data Analytics SS. Use it as a tool for discussion and navigation on Bed Occupancy Rates, Equipment Utilization Rate. This template is free to edit as deemed fit for your organization. Therefore download it now.
-
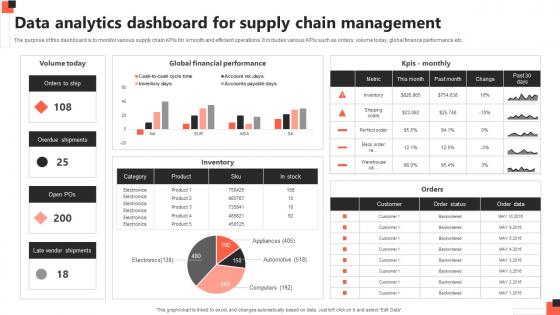 Data Analytics Dashboard For Supply Chain Management
The purpose of this dashboard is to monitor various supply chain KPIs for smooth and efficient operations. It includes various KPIs such as orders, volume today, global finance performance etc. Introducing our Data Analytics Dashboard For Supply Chain Management set of slides. The topics discussed in these slides are Volume Today, Global Financial Performance, Inventory. This is an immediately available PowerPoint presentation that can be conveniently customized. Download it and convince your audience.
-
 Implementing Workforce Analytics Dashboard For Assessing Workforce Efficiency Post Data Analytics SS
This slide showcases dashboard illustrating workforce performance efficiency which helps in in tracking employee productivity levels in business. It provides information regarding corporate performance, employee productivity, project achievement, overtime hours, overall labor effectiveness etc. Deliver an outstanding presentation on the topic using this Implementing Workforce Analytics Dashboard For Assessing Workforce Efficiency Post Data Analytics SS. Dispense information and present a thorough explanation of Dashboard For Assessing Workforce, Post Strategy Implementation, Employee Productivity, Project Achievement using the slides given. This template can be altered and personalized to fit your needs. It is also available for immediate download. So grab it now.
-
 Implementing Workforce Analytics Dashboard To Monitor Employee Performance Post Data Analytics SS
This slide represents dashboard for tracking employee productivity post workload management which helps in assessing workforce activity schedule to optimize performance. It provides information regarding KPI metrics such as working times, projects, tracked time, productivity growth, overall employee effectiveness. Present the topic in a bit more detail with this Implementing Workforce Analytics Dashboard To Monitor Employee Performance Post Data Analytics SS. Use it as a tool for discussion and navigation on Dashboard To Monitor, Employee Performance, Post Workload Management, Tracked Time, Productivity Growth. This template is free to edit as deemed fit for your organization. Therefore download it now.
-
 Implementing Workforce Analytics Employee Engagement Dashboard Post Strategy Data Analytics SS
This slide showcases dashboard for tracking employee engagement post deployment of improvement strategies. It provides information regarding KPI metrics such as engagement, burnout risk, turnover risk, satisfaction, professional growth, alignment, autonomy and organization support. Deliver an outstanding presentation on the topic using this Implementing Workforce Analytics Employee Engagement Dashboard Post Strategy Data Analytics SS. Dispense information and present a thorough explanation of Employee Engagement Dashboard, Post Strategy Implementation, Professional Growth, Alignment using the slides given. This template can be altered and personalized to fit your needs. It is also available for immediate download. So grab it now.
-
 Big Data Analytics Dashboard To Track Retail Performance Data Driven Insights Big Data Analytics SS V
This slide showcases dashboard for monitoring retail business performance which helps in improving revenue generation. It provides information regarding KPIs such as gross margin, sales, card abandonment rate, average unit price etc. Present the topic in a bit more detail with this Big Data Analytics Dashboard To Track Retail Performance Data Driven Insights Big Data Analytics SS V Use it as a tool for discussion and navigation on Big Data Analytics Dashboard, Track Retail Performance This template is free to edit as deemed fit for your organization. Therefore download it now.
-
 Data Analytics Dashboard To Track Hospital Performance Data Driven Insights Big Data Analytics SS V
This slide showcases dashboard for tracking hospitals activities which helps in improving performance efficiency. It provides information regarding bed occupancy rate, patient satisfaction rate, staff to patient ratio, room turnover etc. Deliver an outstanding presentation on the topic using this Data Analytics Dashboard To Track Hospital Performance Data Driven Insights Big Data Analytics SS V Dispense information and present a thorough explanation of Bed Occupancy Rates, Efficiency Costs, Satisfaction Service Indicators using the slides given. This template can be altered and personalized to fit your needs. It is also available for immediate download. So grab it now.
-
 Dashboard Showcasing Big Data Analytics In E Commerce
This slide showcases the dashboard showcasing big data analytics in e-commerce which helps an organization to boost marketing and ensure predictive modeling, scoring. It include details such as balance of account, new consumers, total sales, orders, etc. Presenting our well structured Dashboard Showcasing Big Data Analytics In E Commerce. The topics discussed in this slide are Balance Of Account, New Consumers, Breakdown Of Orders. This is an instantly available PowerPoint presentation that can be edited conveniently. Download it right away and captivate your audience.
-
 Data Analytics Dashboard In Telecom Industry To Measure Customer Satisfaction
This slide showcases dashboard for data analytics in telecom industry to determine customer satisfaction. It aims to indicates customers satisfaction level which is determined by quantity of open and closed assistance requests in customer account. It includes various elements such as customer retention rate, repurchasing rate, etc. Presenting our well structured Data Analytics Dashboard In Telecom Industry To Measure Customer Satisfaction. The topics discussed in this slide are Complaints By Status, Customer Retention Rate, Net Promoters Score. This is an instantly available PowerPoint presentation that can be edited conveniently. Download it right away and captivate your audience.
-
 Patient Experience Assessment Dashboard Post Definitive Guide To Implement Data Analytics SS
This slide showcases dashboard for analyzing patient satisfaction index post deployment of improvement strategies. It provides information regarding KPIs such as average waiting times, patients per department, patient feedback, patient satisfaction, average visits length by department etc. Present the topic in a bit more detail with this Patient Experience Assessment Dashboard Post Definitive Guide To Implement Data Analytics SS. Use it as a tool for discussion and navigation on Neurology, Dermatology, Cardiology, Orthopedics. This template is free to edit as deemed fit for your organization. Therefore download it now.
-
 A Comprehensive Guide Customer Cohort Performance Analysis Dashboard Data Analytics SS
The following slide illustrates a dashboard for analysing customer cohort performance aimed at reviewing marketing and sales activities for customer retention. It measures cost of delivery, margin, hours spent, client revenue, project by effort using metrics Present the topic in a bit more detail with this A Comprehensive Guide Customer Cohort Performance Analysis Dashboard Data Analytics SS Use it as a tool for discussion and navigation on Analysis Dashboard, Return On Ad Spend This template is free to edit as deemed fit for your organization. Therefore download it now.
-
 A Comprehensive Guide Step 6 Kpi Dashboard To Configure User Experience Data Analytics SS
This slide illustrates a dashboard tracking customer experience on website page to make necessary improvements. It covers data on KPIs such as sessions, page sessions, average duration, new sessions, bounce rate, etc Deliver an outstanding presentation on the topic using this A Comprehensive Guide Step 6 Kpi Dashboard To Configure User Experience Data Analytics SS Dispense information and present a thorough explanation of Bounce Rate, New Sessions, Average Session Duration using the slides given. This template can be altered and personalized to fit your needs. It is also available for immediate download. So grab it now.
-
 Product Analytics Dashboard Enhancing Business Insights Implementing Product Data Analytics SS V
This slide illustrates a dashboard to monitor customer engagement on company website by leveraging product analytics tools aimed at making necessary improvements. It covers insights regarding active monthly users, new users, total completed purchases, screen views, average duration of session, etc. Present the topic in a bit more detail with this Product Analytics Dashboard Enhancing Business Insights Implementing Product Data Analytics SS V. Use it as a tool for discussion and navigation on Product Analytics Dashboard, Track Engagement. This template is free to edit as deemed fit for your organization. Therefore download it now.
-
 Kpi Dashboard Showcasing Cybersecurity In Big Data Analytics
This slide highlights big data analytics cybersecurity threats showcasing KPI dashboard for user awareness against insecure systems. It further covers risk and compliance, threat detection, top threat by class, security control table, etc. Presenting our well structured Kpi Dashboard Showcasing Cybersecurity In Big Data Analytics. The topics discussed in this slide are KPI Dashboard, Showcasing Cybersecurity, Big Data Analytics, Security Control Table. This is an instantly available PowerPoint presentation that can be edited conveniently. Download it right away and captivate your audience.
-
 Sales Performance Tracking Dashboard Post Strateg Complete Guide To Business Analytics Data Analytics SS
This slide showcases dashboard for monitoring sales department performance post implementing improvement strategies based on data insights. It provides information regarding revenue generated, current sales pipeline value, sales opportunities, new deals, sales growth by market segment etc. Deliver an outstanding presentation on the topic using this Sales Performance Tracking Dashboard Post Strateg Complete Guide To Business Analytics Data Analytics SS. Dispense information and present a thorough explanation of Sales Performance Tracking, Dashboard Post, Strategy Implementation, Sales Opportunities using the slides given. This template can be altered and personalized to fit your needs. It is also available for immediate download. So grab it now.
-
 Dashboard To Determine Customer Mastering Data Analytics A Comprehensive Data Analytics SS
This slide illustrates dashboard reporting customer support ticket response time aimed at providing quick solutions to customer issues. It covers media response time, time to close, day wise response graph, etc. Present the topic in a bit more detail with this Dashboard To Determine Customer Mastering Data Analytics A Comprehensive Data Analytics SS. Use it as a tool for discussion and navigation on Response Time Of Median, First Response Time Of Median, Time To Close Of Median. This template is free to edit as deemed fit for your organization. Therefore download it now.
-
 Kpi Dashboard For Tracking Efficiency Of Spark Data Analytics
This slide showcases spark data analytics measuring KPI dashboard. This slide includes executors, executors memory usage, driver memory usage, total failed tasks, total completed tasks, max tasks on executor. Introducing our Kpi Dashboard For Tracking Efficiency Of Spark Data Analytics set of slides. The topics discussed in these slides are Dashboard, Efficiency, Data Analytics. This is an immediately available PowerPoint presentation that can be conveniently customized. Download it and convince your audience.
-
 Insurance Customer Analysis KPI Dashboard Navigating The Future Of Insurance Data Analytics SS
This slide outlines a dashboard graphically representing analysis of existing as well as newly acquired insurance customers. It covers metrics such as premium amount, claim amount, claims per month, claims by status, etc. Present the topic in a bit more detail with this Insurance Customer Analysis KPI Dashboard Navigating The Future Of Insurance Data Analytics SS. Use it as a tool for discussion and navigation on Premium Amount Generated, Claim Amount Generated, Customers By Age Group. This template is free to edit as deemed fit for your organization. Therefore download it now.
-
 Big Data Analytics Dashboard To Track Healthcare Performance
This slide covers integrating big data analytics to track current healthcare status. It involves details such as current bed occupancy rate, forecasted patient turnover, patient satisfaction and follow up rate. Presenting our well structured Big Data Analytics Dashboard To Track Healthcare Performance. The topics discussed in this slide are Current Occupancy Rate, Project Patient Turnover, Satisfaction Score. This is an instantly available PowerPoint presentation that can be edited conveniently. Download it right away and captivate your audience.
-
 Kpi Dashboard Clinical Trials Leveraging Data Analytics For Clinical Success Data Analytics SS
This slide provides an analytics dashboard aimed ta helping pharma businesses maintain patient summary for effective trials. It covers drug trial monitoring on the basis of cost, participants, hours and cost by status Deliver an outstanding presentation on the topic using this Kpi Dashboard Clinical Trials Leveraging Data Analytics For Clinical Success Data Analytics SS. Dispense information and present a thorough explanation of Dashboard, Analyse, Average Enrolment using the slides given. This template can be altered and personalized to fit your needs. It is also available for immediate download. So grab it now.


