Powerpoint Templates and Google slides for Data Analysing
Save Your Time and attract your audience with our fully editable PPT Templates and Slides.
-
 Health organization data analysis average ppt powerpoint presentation summary picture
Presenting this set of slides with name Health Organization Data Analysis Average Ppt Powerpoint Presentation Summary Picture. The topics discussed in these slides are Organization, Data, Analysis, Table, Business. This is a completely editable PowerPoint presentation and is available for immediate download. Download now and impress your audience.
-
 Ba bar graph with percentage financial data analysis flat powerpoint design
Presenting ba bar graph with percentage financial data analysis flat powerpoint design. This Power Point diagram has been crafted with graphic of bar graph and percentage. This PPT diagram contains the concept of financial data analysis. Use this PPT diagram for business and finance related presentations.
-
 Productive ideas business records report data analysis transfer ppt icons graphics
Presenting productive ideas business records report data analysis transfer ppt icons graphics. This Power Point icon template has been crafted with graphic of four business icons. This icon template contains the concept of data analysis and transfer. Use this icon template diagram for marketing and business related presentations.
-
 Ku multiple puzzles for big data analysis powerpoint template
Presenting ku multiple puzzles for big data analysis powerpoint template. This Power Point template diagram has been crafted with graphic of multiple puzzles. This Power Point template diagram contains the concept of big data analysis. Use this icon template for business and data related presentations.
-
 Semicircular with icons for data analysis flat powerpoint design
We are proud to present our semicircular with icons for data analysis flat powerpoint design. Graphic of semicircular with icons has been used to design this power point template diagram. This PPT diagram contains the concept of data analysis. Use this PPT diagram for business and marketing related presentations.
-
 Four staged colored ribbons for data and analysis flat powerpoint design
We are proud to present our four staged colored ribbons for data and analysis flat powerpoint design. This power point template diagram has been crafted with graphic of four staged colored ribbons. This PPT diagram contains the concept of business data analysis representation. Use this PPT diagram for business and marketing related presentations.
-
 Bar graph make with books educational data analysis flat powerpoint design
We are proud to present our bar graph make with books educational data analysis flat powerpoint design. This power point template diagram has been crafted with graphic of bar graph and books. This PPT diagram contains the concept of educational data analysis. Use this PPT diagram for education and business related presentations.
-
 Bar graph made with pencils educational data analysis flat powerpoint design
We are proud to present our bar graph made with pencils educational data analysis flat powerpoint design. This power point template diagram has been crafted with graphic of bar graph made with pencils. This PPT diagram contains the concept of educational data analysis. Use this PPT diagram for business and education related presentations.
-
 Four circles interconnected with icons for business data analysis flat powerpoint design
Simple to download in quick easy steps. No constraint on length of title and subtitle in text boxes. Fully editable PPT icons- change color, contrast, size and orientation as per need. Insert company name, logo, tagline etc. for a more personalized look. PPT images with unaffected high resolution after editing. Effective for project managers, sales team leaders, financial planners etc.
-
 Four colored ribbons for data analysis flat powerpoint design
We are proud to present our four colored ribbons for data analysis flat powerpoint design. Four colored ribbons has been used to craft this power point template diagram. This PPT diagram contains the concept of business data analysis. Use this PPT diagram for business and data related presentations.
-
 Stopwatch with pie chart for data and result analysis flat powerpoint design
Basic theme yet it can modified with respect to font, color and layout. Attractive and professional color scheme. PPT graphic offers font size which can be read from a distance. High resolution is offered by the presentation slide show. Easy to download and instant use of pre designed PPT layout adds to its advantage. High color resolution offered by PPT. PPT layout is beneficial for businessmen, project managers for business and managerial purposes.
-
 Four staged arrows text boxes data analysis flat powerpoint design
We are proud to present our four staged arrows text boxes data analysis flat powerpoint design. Four staged arrow text boxes have been used to design this power point template diagram. This PPT diagram contains the concept of data analysis representation. Use this PPT diagram for business and marketing related presentations.
-
 Top of mountain success growth chart information data analysis ppt icons graphics
Presenting top of mountain success growth chart information data analysis ppt icons graphics. This Power Point icon template diagram has been crafted with graphic of growth chart and mountain icons. This icon template contains the concept of success and data analysis .Use this icon template for business and marketing related presentations.
-
 Sand clock data analysis settings business bag ppt icons graphics
We are proud to present our sand clock data analysis settings business bag ppt icons graphics. This power point icon template has been crafted with graphic of four icons. This icon template diagram contains the graphic of sand clock, business bag and data. Use this icon template for business and data related presentations.
-
 Ups and downs of business time management data analysis ppt icons graphics
We are proud to present our ups and downs of business time management data analysis ppt icons graphics. Concept of time management and data analysis can been defined with this power point icon template. This power point icon template contains the graphic of ups, downs and data icons. Use this icon template for business and marketing related presentations.
-
 Data analysis resume pie chart customer support ppt icons graphics
We are proud to present our data analysis resume pie chart customer support ppt icons graphics. Concept of data analysis and customer support has been displayed in this power point icon template diagram. This icon template contains the graphic of resume, pie chart and customer support icons. Use this icon template for business and data related presentations.
-
 Growth bar graph chart business data analysis ppt icons graphics
We are proud to present our growth bar graph chart business data analysis ppt icons graphics. Concept of data analysis can be defined with this power point icon template diagram. This PPT diagram contains the graphic of bar graph, money and chart icons. Use this icon template for business and finance related presentations.
-
 Six colored vertical signpost tags data analysis flat powerpoint design
Extremely professional PPT presentation backgrounds. Spacious enough to add titles, subtitles, headings etc. Offers the option to view the information on wide screens for more clarity without pixelating the graphics. Completely amendable and allows resizing and reshaping the icons along with changing the orientation of objects. Instant download in a matter of seconds.
-
 Computer world map data analysis navigation system ppt icons graphics
We are proud to present our computer world map data analysis navigation system ppt icons graphics. This power point icon template diagram has been crafted with graphic of four technical icons. Graphic of diary ,flies and folders. This PPT diagram contains the concept of data analysis and navigation. Use PPT diagram can be used for business and data related presentations.
-
 Hexagon with four arrows data analysis flat powerpoint design
We are proud to present our hexagon with four arrows data analysis flat powerpoint design. Graphic of hexagons with four arrows has been used to craft this power point template diagram. This PPT diagram contains the concept of data analysis. Use this PPT diagram for business and marketing related presentations.
-
 Ppts five staged numeric banners for data analysis flat powerpoint design
Presenting ppts five staged numeric banners for data analysis flat powerpoint design. This Power Point template diagram has been crafted with graphic of five staged numeric banners diagram. Use this PPT diagram contains the concept of data analysis. Use this PPT diagram for business and marketing related presentations.
-
 View numerical data chart for analysis flat powerpoint design
Presenting view numerical data chart for analysis flat powerpoint design. This Power Point template diagram has been crafted with graphic of bar chart diagram. Use this PPT diagram contains the concept of numerical data analysis. Use this PPT diagram for business and finance related presentations.
-
 New four arrows data and process analysis diagram flat powerpoint design
Presenting new four arrows data and process analysis diagram flat powerpoint design. Presenting new four arrows data and process analysis diagram flat powerpoint design. This Power Point template diagram has been crafted with graphic of four arrows diagram. This PPT diagram contains the concept of data and process analysis. Use this PPT diagram for business and finance related presentations.
-
 App five zigzag banners for business data analysis flat powerpoint design
Presenting app five zigzag banners for business data analysis flat powerpoint design. This Power Point template slide has been crafted with graphic of five zigzag banners diagram. This PPT slide contains the concept of business data analysis. Use this PPT slide for business and finance related presentations.
-
 New four balloons for data analysis flat powerpoint design
Presenting new four balloons for data analysis flat powerpoint design. This Power Point template diagram has been crafted with graphic of four balloons info graphics. This PPT diagram contains the concept of global business data analysis. Use this PPT diagram for business and data related presentations.
-
 View four staged text boxes for data analysis flat powerpoint design
Presenting view four staged text boxes for data analysis flat powerpoint design. This Power Point template diagram has been crafted with graphic of four staged text boxes diagram. This PPT diagram contains the concept of business data analysis representation. Use this PPT diagram for business and marketing related presentations.
-
 Apt four tags for data specific study and analysis flat powerpoint design
Presenting apt four tags for data specific study and analysis flat powerpoint design. This Power Point template diagram has been crafted with graphic of four tags diagram. This PPT diagram contains the concept of data specific study and analysis. Use this PPT diagram for business and marketing related presentations.
-
 Four pie charts for financial data analysis powerpoint slides
Presenting four pie charts for financial data analysis powerpoint slides. This Power Point template diagram has been crafted with graphic of four pie charts diagram. This PPT diagram contains the concept of financial data analysis. Use this PPT diagram for business and finance related presentations.
-
 Three magnifiers for business data analysis powerpoint slides
Presenting three magnifiers for business data analysis powerpoint slides. This Power Point template diagram has been crafted with graphic of three magnifiers diagram. This PPT diagram contains the concept of business data analysis. Use this PPT diagram for business and finance related presentations.
-
 Pptx five staged tags for data compare and analysis flat powerpoint design
Presenting pptx five staged tags for data compare and analysis flat powerpoint design. Presenting pptx five staged tags for data compare and analysis flat powerpoint design. This Power Point template diagram has been crafted with graphic of five staged tags and icons. This PPT diagram contains the concept of data comparison and analysis. Use this PPT diagram can be used for business and technology related presentations.
-
 New four vertical tags for business data analysis flat powerpoint design
Presenting new four vertical tags for business data analysis flat powerpoint design. Presenting new four vertical tags for business data analysis flat powerpoint design. This Power Point template diagram has been crafted with graphic of four vertical tags diagram. This PPT diagram contains the concept of business data analysis .Use this PPT diagram can be used for business and management related presentations.
-
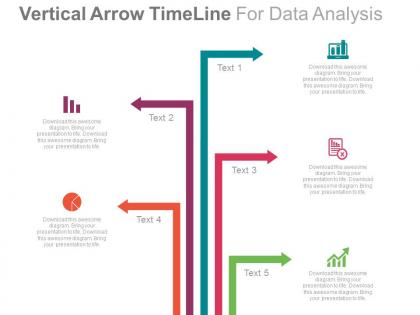 Ppt vertical arrow timeline for business data analysis flat powerpoint design
Creative and simple PowerPoint presentation design. Simply click to add company logo, trademark or name. One click downloading process. Convertible in PDF or JPG format. Easy manual process to change text, color and icons to match your requirements. High resolution Presentation graphics and vibrant colors for an appealing visual treat. Beneficial for business presenters, corporate firms and industry professionals.
-
 Financial time management process flow analysis data storage planning ppt icons graphic
Presenting financial time management process flow analysis data storage planning ppt icons graphic. This Power Point template diagram slide has been crafted with graphic of finance icons . This PPT diagram contains the concept of financial and time management with process flow representation. Use this PPT diagram for business and management related presentations.
-
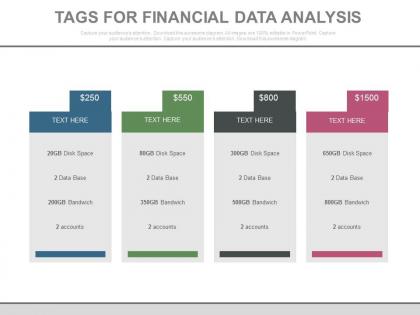 Four tags for financial data analysis powerpoint slides
Presenting four tags for financial data analysis powerpoint slides. This Power Point template slide has been crafted with graphic of four tags. This PPT slide contains the concept of financial data analysis. Use this PPT slide for business and finance related presentations.
-
 Percentage chart with data analysis powerpoint slides
Presenting percentage chart with data analysis powerpoint slides. This Power Point template slide has been crafted with graphic of percentage chart. This PPT slide contains the concept of data analysis. Use this PPT slide for business and finance related presentations.
-
 Ppt rocket process infographics data analysis flat powerpoint design
Presenting ppt rocket process infographics data analysis flat powerpoint design. Presenting ppt rocket process infographics data analysis flat powerpoint design. This Power Point template diagram has been crafted with graphic of rocket design info graphics diagram. This PPT diagram contains the concept of business data analysis. Use this PPT diagram for business and marketing related presentations.
-
 Data analysis hierarchy team data management ppt icons graphics
Presenting data analysis hierarchy team data management ppt icons graphics. This Power Point icon template diagram has been crafted with graphic of four web icons. This PPT diagram contains the concept of data analysis and data management. Use this icon template for business and data related presentations.
-
 Coding service market analysis page speed data storage ppt icons graphics
Presenting coding service market analysis page speed data storage ppt icons graphics. This Power Point icon template diagram has been crafted with graphic of four web and data icons. This PPT diagram contains the concept of market analysis and data storage. Use this icon PPT diagram for web and data technology related presentations.
-
 Business data and result analysis chart powerpoint slides
Presenting business data and result analysis chart powerpoint slides. This Power Point template slide has been crafted with graphic of business data chart. This PPT diagram slide contains the concept of business result analysis. Use this PPT slide for business and marketing related presentations.
-
 Gears data analysis laurel tie ppt icons graphics
Presenting gears data analysis laurel tie ppt icons graphics. This Power Point template diagram has been crafted with graphic of gear, laurel and tie icons. This PPT icon diagram contains the concept of business process control and data representation. Use this PPT icon diagram for business and marketing related presentations.
-
 Mobile result analysis network data analysis ppt icons graphics
Presenting mobile result analysis network data analysis ppt icons graphics. This Power Point template diagram has been crafted with graphic of mobile and network icons. This PPT icon diagram contains the concept of result analysis and mobile networking representation. Use this PPT icon diagram for business and finance related presentations.
-
 Web data record game application safety analysis ppt icons graphics
Presenting web data record game application safety analysis ppt icons graphics. This Power Point template diagram has been crafted with graphic of web data mad game icons. This PPT icon diagram contains the concept of safety and protection analysis. Use this PPT icon diagram for business and technology related presentations.
-
 Business communication data study male female ratio analysis ppt icons graphics
Presenting business communication data study male female ratio analysis ppt icons graphics. This Power Point template icons slide has been crafted with graphic of four business icons. This icon PPT contains the concept of business data analysis and gender ratio analysis. Use this icon PPT for business and marketing related presentations.
-
 Business data analysis news announcement video display option ppt icons graphics
Presenting business data analysis news announcement video display option ppt icons graphics. This Power Point template icons slide has been crafted with graphic of four business icons. This icon PPT contains the concept of business data analysis and news announcement. Use this icon PPT for business and marketing related presentations.
-
 Business processing data analysis representation networking ppt icons graphics
Presenting business processing data analysis representation networking ppt icons graphics. This Power Point template icons slide has been crafted with graphic of four business and data icons. This icon PPT contains the concept of business processing and data analysis. Use this icon PPT for business and marketing related presentations.
-
 Card swap financial data and statistics analysis ppt icons graphics
Presenting card swap financial data and statistics analysis ppt icons graphics. This Power Point template icons slide has been crafted with graphic of card swap and finance icons. This icon PPT contains the concept of financial data analysis. Use this icon PPT for business and finance related presentations.
-
 Data formation management html coding result analysis ppt icons graphics
Presenting data formation management html coding result analysis ppt icons graphics. This Power Point template icons slide has been crafted with graphic of data and HTML code icons. This icon PPT contains the concept of data formation management and result analysis. Use this icon PPT for business and data related presentations.
-
 Decay chart growth bar graph line chart data analysis ppt icons graphics
Presenting decay chart growth bar graph line chart data analysis ppt icons graphics. This Power Point template icons slide has been crafted with graphic of decay chart, bar graph and line chart icons. This icon PPT contains the concept of data analysis and management. Use this icon PPT for business and data related presentations.
-
 Financial data analysis bank location money transfer ppt icons graphics
Presenting financial data analysis bank location money transfer ppt icons graphics. This Power Point template icons slide has been crafted with graphic of finance icons. This icon PPT contains the concept of financial data analysis and money transfer. Use this icon PPT for business and finance related presentations.
-
 Financial saving money growth data analysis ppt icons graphics
Presenting financial saving money growth data analysis ppt icons graphics. This Power Point template icons slide has been crafted with graphic of finance icons. This icon PPT contains the concept of financial saving and growth analysis. Use this icon PPT for business and finance related presentations.
-
 Meta buttons tags education data analysis ppt icons graphics
Presenting meta buttons tags education data analysis ppt icons graphics. This Power Point template icons slide has been crafted with graphic of meta tags and education icons. This icon PPT contains the concept of education data analysis. Use this icon PPT for business and education related presentations.
-
 Pie chart growth chart line chart data analysis ppt icons graphics
Presenting pie chart growth chart line chart data analysis ppt icons graphics. This Power Point template icons slide has been crafted with graphic of pie chart, line chart and data icons. This icon PPT contains the concept of data analysis and growth indication. Use this icon PPT for business and finance related presentations.
-
 Product checklist data analysis report formation ppt icons graphics
Presenting product checklist data analysis report formation ppt icons graphics. This Power Point template icons slide has been crafted with graphic of product checklist, data and report icons. This icon PPT contains the concept of checklist formation and report analysis. Use this icon PPT for business and finance related presentations.
-
 Stock exchange financial analysis data management ppt icons graphics
Presenting stock exchange financial analysis data management ppt icons graphics. This Power Point template icons slide has been crafted with graphic of finance and data icons. This icon PPT contains the concept of financial analysis and data management. Use this icon PPT for business and finance related presentations.
-
 Financial trip time management data analysis approval ppt icons graphics
Presenting financial trip time management data analysis approval ppt icons graphics. This Power Point template slide has been crafted with graphic of financial icons. This PPT slide contains the concept of financial data analysis and time management. Use this PPT slide for business and finance related presentations.
-
 Mobile data analysis customer support success ppt icons graphics
Presenting mobile data analysis customer support success ppt icons graphics. This Power Point template slide has been crafted with graphic of mobile, data and customer icons. This PPT slide contains the concept of mobile data analysis. Use this PPT slide for business and finance related presentations.
-
 Data driven chart for business analysis powerpoint slides
Presenting data driven chart for business analysis powerpoint slides. This Power Point template slide has been crafted with graphic of data driven chart. This PPT slide contains the concept of business growth analysis. Use this PPT slide for business and finance related presentations.
-
 Financial data table for analysis powerpoint slides
Presenting financial data table for analysis powerpoint slides. This Power Point template slide has been crafted with graphic of data table. This PPT slide contains the concept of financial data analysis. Use this PPT slide for business and finance related presentations.
-
 Five staged bar graph for financial data analysis powerpoint slides
Presenting five staged bar graph for financial data analysis powerpoint slides. This Power Point template slide has been crafted with graphic of five staged bar graph. This PPT slide contains the concept of financial data analysis. Use this PPT slide for business and finance related presentations.
-
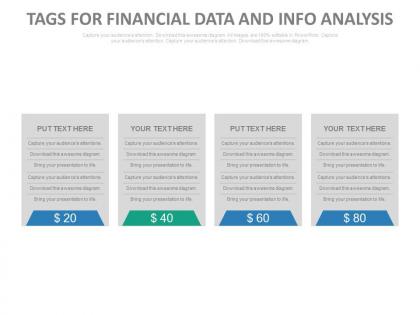 Four tags for financial data and info analysis powerpoint slides
Presenting four tags for financial data and info analysis powerpoint slides. This Power Point template slide has been crafted with graphic of four tags. This PPT slide contains the concept of financial data and info analysis. Use this PPT slide for business and finance related presentations.


