Powerpoint Templates and Google slides for Dashboards And Kpis
Save Your Time and attract your audience with our fully editable PPT Templates and Slides.
-
 Kpi Dashboard To Analyze Market Research Introduction And Most Common Types Mkt Ss V
The following slide outlines a comprehensive visual representation of customer satisfaction CSAT that can assist companies to measure how happy are customers wit the brand. The kpis covered are net promoter score NPS, customer effort score CES, product quality, pricing, etc. Present the topic in a bit more detail with this Kpi Dashboard To Analyze Market Research Introduction And Most Common Types Mkt Ss V. Use it as a tool for discussion and navigation on Net Promotor Score, Customer Efforts Score. This template is free to edit as deemed fit for your organization. Therefore download it now.
-
 KPI dashboard for hotel budget and revenue management
The following slide presents a hotel budget management dashboard that can be used by managers to analyze the performance of the budget. Key performance indicators include monthly revenue, monthly hotel revenue comparison, etc.Introducing our KPI dashboard for hotel budget and revenue management set of slides. The topics discussed in these slides are Revenue Comparison, Monthly Revenue, Revenue Based. This is an immediately available PowerPoint presentation that can be conveniently customized. Download it and convince your audience.
-
 Learning And Development Team Kpi Dashboard
This slide provides glimpse about key performance metrics related to skill development sessions conducted for employees in a business organization. It includes training and development team, average result area scores, etc.Presenting our well structured Learning And Development Team Kpi Dashboard. The topics discussed in this slide are Mike Gyllenhaal, Serena Howard, Ashley Owens. This is an instantly available PowerPoint presentation that can be edited conveniently. Download it right away and captivate your audience.
-
 Comprehensive Guide To Effective Business Sales And Revenue Assessment KPI Dashboard
Following slide exhibits dashboard that determine impact of environmental assessment on business performance. It includes indicators such as average operative cost, product model performance etc. Deliver an outstanding presentation on the topic using this Comprehensive Guide To Effective Business Sales And Revenue Assessment KPI Dashboard. Dispense information and present a thorough explanation of Actual, Target, Average Operating Cost using the slides given. This template can be altered and personalized to fit your needs. It is also available for immediate download. So grab it now.
-
 Kpi Dashboard To Analyze New Strategic Building Comprehensive Sales And Operations Mkt Ss
This slide showcases the kpis that would help a business organization to evaluate improvements in the new strategic sales plan. It includes kpis such as market share by region, plan sales vs. Actual sales by month, gross margin by region, etc. Present the topic in a bit more detail with this Kpi Dashboard To Analyze New Strategic Building Comprehensive Sales And Operations Mkt Ss. Use it as a tool for discussion and navigation on zzzzzzzzzzzzzzz. This template is free to edit as deemed fit for your organization. Therefore download it now.
-
 Dashboard To Track Inventory Management Kpis Strategies For Forecasting And Ordering Inventory
This slide showcases KPIs that can help organization to evaluate the efficiency of inventory management process. Its key KPIs areout of stock rate, on time full deliveries, inventory turnover and average time to sell. Deliver an outstanding presentation on the topic using this Dashboard To Track Inventory Management Kpis Strategies For Forecasting And Ordering Inventory Dispense information and present a thorough explanation of Overview 2023, Products Sold Within Freshness Date using the slides given. This template can be altered and personalized to fit your needs. It is also available for immediate download. So grab it now.
-
 Supplier And Vendor Management KPI Dashboard Introduction To Cloud Based ERP Software
The following slide showcases the key performance indicators KPIs to track vendor performance post ERP implementation. It mainly includes elements such as rejection rate, ordered value, number of suppliers, purchase in tie and budget etc.Deliver an outstanding presentation on the topic using this Supplier And Vendor Management KPI Dashboard Introduction To Cloud Based ERP Software. Dispense information and present a thorough explanation of Spend Under Management, Purchase Budget, Value Rejected Rate using the slides given. This template can be altered and personalized to fit your needs. It is also available for immediate download. So grab it now.
-
 Employee Engagement And Satisfaction Kpi Dashboard Strategies To Improve Workforce
The following slide showcases employee engagement and satisfaction key performance indicators to encourage healthy team relationships. It includes key elements such as net promotor score, retention and absenteeism rate etc. Deliver an outstanding presentation on the topic using this Employee Engagement And Satisfaction Kpi Dashboard Strategies To Improve Workforce Dispense information and present a thorough explanation of Employee Net Promoter, Employee Retention using the slides given. This template can be altered and personalized to fit your needs. It is also available for immediate download. So grab it now.
-
 Earned Value Management Dashboard With Project KPIs And Risks
Deliver an outstanding presentation on the topic using this Earned Value Management Dashboard With Project KPIs And Risks. Dispense information and present a thorough explanation of Earned Value Management, Dashboard With Project, KPIs And Risks using the slides given. This template can be altered and personalized to fit your needs. It is also available for immediate download. So grab it now.
-
 Introduction To Medical And Health Performance Kpi Dashboard To Analyze Healthcare Marketing Strategies
The following slide showcases a comprehensive dashboard which can be used to evaluate the effectiveness of marketing strategies. The key metrics are total searches, brand mentions, customer value, total spending on advertisement etc. Present the topic in a bit more detail with this Introduction To Medical And Health Performance Kpi Dashboard To Analyze Healthcare Marketing Strategies. Use it as a tool for discussion and navigation on Dashboard, Marketing, Strategies. This template is free to edit as deemed fit for your organization. Therefore download it now.
-
 Construction Project Budget Variance And Kpi Monitoring Dashboard
This slide presents construction project budget variance and KPI monitoring dashboard, helpful in tracking important metrics to determine resource allocation that leads to budget differences. It includes project status, stages, resources utilised and total days of work. Presenting our well structured Construction Project Budget Variance And Kpi Monitoring Dashboard. The topics discussed in this slide are Construction Project, Budget Variance. This is an instantly available PowerPoint presentation that can be edited conveniently. Download it right away and captivate your audience.
-
 Measuring Net Retention And Revenue Churn With Kpi Dashboard Customer Churn Analysis
Mentioned slide outlines a comprehensive dashboard outlining the results of customer churn prevention strategies. The key performance indicators KPIs covered in the slide are net promoter score NPS, loyal customer rate, customer lifetime value CLV, revenue churn, net retention rate, etc. Present the topic in a bit more detail with this Measuring Net Retention And Revenue Churn With Kpi Dashboard Customer Churn Analysis Use it as a tool for discussion and navigation on Loyal Customer Rate, Premium User This template is free to edit as deemed fit for your organization. Therefore download it now.
-
 Kpi Dashboard For Monitoring Warehouse Successful Strategies To And Responsive Supply Chains Strategy SS
Mentioned slide illustrates warehouse operations dashboard with key performance indicators KPIs. KPIs included are operating cost, order rate, total shipment by country and on-time shipment. Deliver an outstanding presentation on the topic using this Kpi Dashboard For Monitoring Warehouse Successful Strategies To And Responsive Supply Chains Strategy SS. Dispense information and present a thorough explanation of Dashboard, Operations, Performance using the slides given. This template can be altered and personalized to fit your needs. It is also available for immediate download. So grab it now.
-
 Kpi Dashboard For Supply Chain Successful Strategies To And Responsive Supply Chains Strategy SS
Following slide displays warehouse management dashboard that can be used by supply chain organizations to monitor overall performance using KPIs. KPIs covered are return rate, back order rate, inventory days of supply, inventory carrying cost etc. Present the topic in a bit more detail with this Kpi Dashboard For Supply Chain Successful Strategies To And Responsive Supply Chains Strategy SS. Use it as a tool for discussion and navigation on Dashboard, Management, Organizations. This template is free to edit as deemed fit for your organization. Therefore download it now.
-
 Supply Chain Kpi Dashboard For Effective Successful Strategies To And Responsive Supply Chains Strategy SS
Mentioned slide illustrates KPI dashboard that can be used by managers to assess financial health of supply chain business. KPIs covered are supply chain costs versus sales, cash to order cycle, warehouse operating cost distribution etc. Deliver an outstanding presentation on the topic using this Supply Chain Kpi Dashboard For Effective Successful Strategies To And Responsive Supply Chains Strategy SS. Dispense information and present a thorough explanation of Dashboard, Financial, Analysis using the slides given. This template can be altered and personalized to fit your needs. It is also available for immediate download. So grab it now.
-
 Tracking The Improvements In Hr Kpi Dashboard Actionable Recruitment And Selection Planning Process
This slide showcases the KPIs that would help a business organization to track the improvements in the new recruitment process. It includes technical hiring, non-technical hiring, current hiring pipeline, etc. Deliver an outstanding presentation on the topic using this Tracking The Improvements In Hr Kpi Dashboard Actionable Recruitment And Selection Planning Process. Dispense information and present a thorough explanation of Improvements, Recruitment, Process using the slides given. This template can be altered and personalized to fit your needs. It is also available for immediate download. So grab it now.
-
 Kpi Dashboard To Analyze Digital Marketing Boosting Conversion And Awareness MKT SS
This slide showcases the parameters that would help the business organization to evaluate digital marketing performance. It includes conversions, conversion rate, sessions, stickiness, engagement, bounce rate, etc. Deliver an outstanding presentation on the topic using this Kpi Dashboard To Analyze Digital Marketing Boosting Conversion And Awareness MKT SS Dispense information and present a thorough explanation of Conversions, Conversions Rate using the slides given. This template can be altered and personalized to fit your needs. It is also available for immediate download. So grab it now.
-
 Measure Sales Performance With KPI Dashboard Elevating Lead Generation With New And Advanced MKT SS V
This slide provides glimpse about dashboard analysis that can help the business to track the performance of the sales team. It includes KPIs such as sales, sales target, target achievement, sales last year, sales by channel, etc. Deliver an outstanding presentation on the topic using this Measure Sales Performance With KPI Dashboard Elevating Lead Generation With New And Advanced MKT SS V. Dispense information and present a thorough explanation of Measure, Sales, Performance using the slides given. This template can be altered and personalized to fit your needs. It is also available for immediate download. So grab it now.
-
 Engineering procurement and construction kpi dashboard showing cost of purchase order and cost reduction
You can use this PPT slideshow very easily as it is fully customizable. You can effortlessly insert or remove any diagrammatic representation from the given template. The font size, font color and font style can be easily edited. This graph PPT is linked to excel and changes automatically based on the data you enter. You can save the deck in either PDF or JPG format. To make any changes in the PPT slideshow, simply follow the instructions given in the sample slides. The size, color and orientation of all shapes are 100% customizable, so don’t waste any further time and download this presentation.
-
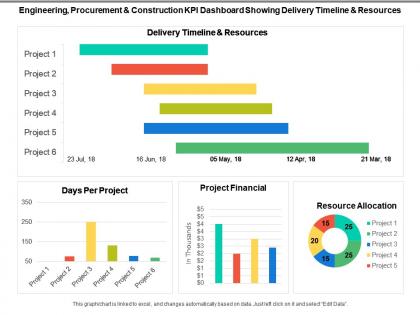 Engineering procurement and construction kpi dashboard showing delivery timeline and resources
Presenting this set of slides with name - Engineering Procurement And Construction Kpi Dashboard Showing Delivery Timeline And Resources. This is a four stage process. The stages in this process are Engineering, Procurement And Construction, Construction Management, Engineering, Purchasing And Construction .
-
 Engineering procurement and construction kpi dashboard showing net project revenue per employee
Presenting this set of slides with name - Engineering Procurement And Construction Kpi Dashboard Showing Net Project Revenue Per Employee. This is a two stage process. The stages in this process are Engineering, Procurement And Construction, Construction Management, Engineering, Purchasing And Construction .
-
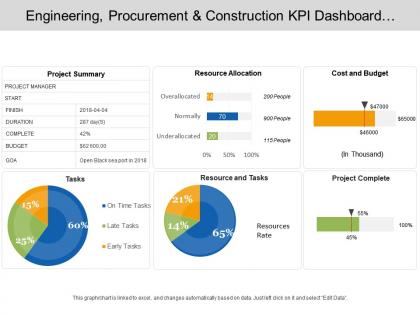 Engineering procurement and construction kpi dashboard showing project summary cost and budget
Presenting this set of slides with name - Engineering Procurement And Construction Kpi Dashboard Showing Project Summary Cost And Budget. This is a four stage process. The stages in this process are Engineering, Procurement And Construction, Construction Management, Engineering, Purchasing And Construction .
-
 Social media kpi dashboard showing conversions by social network and metrics
Presenting this set of slides with name - Social Media Kpi Dashboard Showing Conversions By Social Network And Metrics. This is a five stage process. The stages in this process are Social Media, Digital Marketing, Social Marketing.
-
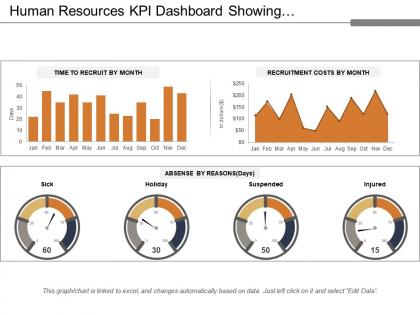 Human resources kpi dashboard showing recruitment costs and absence by reason
Presenting this set of slides with name - Human Resources Kpi Dashboard Showing Recruitment Costs And Absence By Reason. This is a three stage process. The stages in this process are Human Resource, Hrm, Human Capital.
-
 Kpi dashboard showing employee churn key metrics and open positions
Presenting this set of slides with name - Kpi Dashboard Showing Employee Churn Key Metrics And Open Positions. This is a four stage process. The stages in this process are Human Resource, Hrm, Human Capital.
-
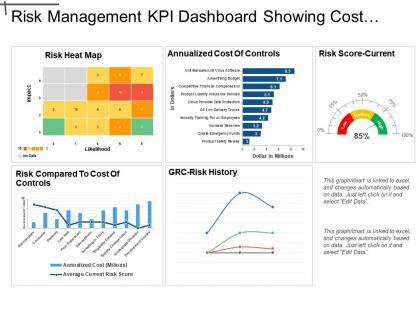 Risk Management Kpi Dashboard Showing Cost Of Control And Risk Score
Presenting this set of slides with name - Risk Management Kpi Dashboard Showing Cost Of Control And Risk Score. This is a five stage process. The stages in this process are Risk Management, Risk Assessment, Project Risk.
-
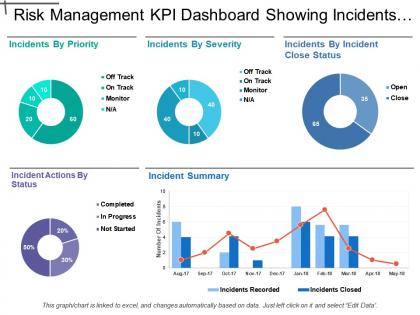 Risk Management Kpi Dashboard Showing Incidents By Priority And Severity
Presenting this set of slides with name - Risk Management Kpi Dashboard Showing Incidents By Priority And Severity. This is a four stage process. The stages in this process are Risk Management, Risk Assessment, Project Risk.
-
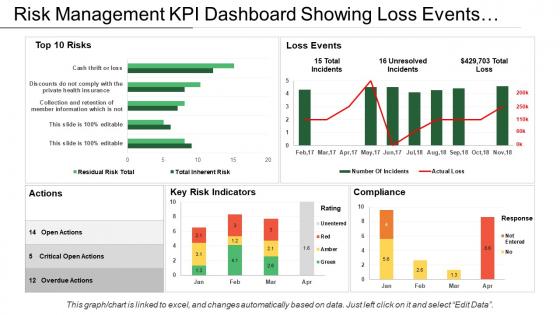 Risk management kpi dashboard showing loss events actions and compliance
Presenting this set of slides with name - Risk Management Kpi Dashboard Showing Loss Events Actions And Compliance. This is a four stage process. The stages in this process are Risk Management, Risk Assessment, Project Risk.
-
 Risk Management Kpi Dashboard Showing Open Issues And Control Performance
Presenting this set of slides with name - Risk Management Kpi Dashboard Showing Open Issues And Control Performance. This is a five stage process. The stages in this process are Risk Management, Risk Assessment, Project Risk.
-
 Risk Management Kpi Dashboard Showing Overall Security Risk And Regulatory
Presenting this set of slides with name - Risk Management Kpi Dashboard Showing Overall Security Risk And Regulatory Compliance. This is a four stage process. The stages in this process are Risk Management, Risk Assessment, Project Risk.
-
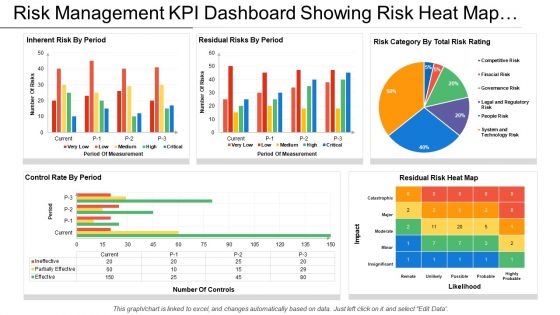 Risk Management Kpi Dashboard Showing Risk Heat Map And Control Rate By
Presenting this set of slides with name - Risk Management Kpi Dashboard Showing Risk Heat Map And Control Rate By Period. This is a five stage process. The stages in this process are Risk Management, Risk Assessment, Project Risk.
-
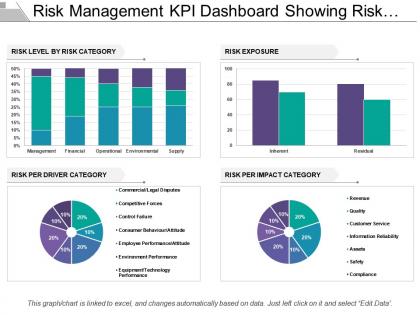 Risk Management Kpi Dashboard Showing Risk Level Exposure And Impact
Presenting this set of slides with name - Risk Management Kpi Dashboard Showing Risk Level Exposure And Impact Category. This is a four stage process. The stages in this process are Risk Management, Risk Assessment, Project Risk.
-
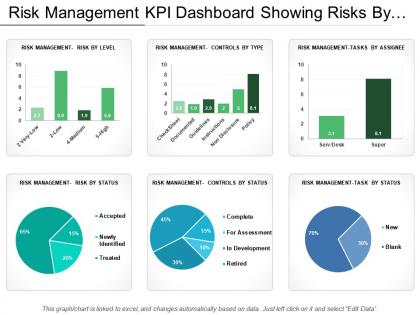 Risk Management Kpi Dashboard Showing Risks By Level Assignee And Status
Presenting this set of slides with name - Risk Management Kpi Dashboard Showing Risks By Level Assignee And Status. This is a six stage process. The stages in this process are Risk Management, Risk Assessment, Project Risk.
-
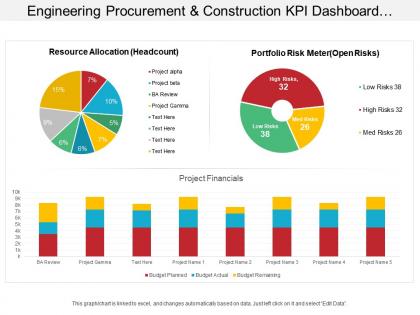 Engineering procurement and construction kpi dashboard having project financials and resource allocation
Presenting this set of slides with name - Engineering Procurement And Construction Kpi Dashboard Having Project Financials And Resource Allocation. This is a three stage process. The stages in this process are Engineering, Procurement And Construction, Construction Management, Engineering, Purchasing And Construction .
-
 Engineering procurement and construction kpi dashboard showcasing project summary cost and budget
Presenting this set of slides with name - Engineering Procurement And Construction Kpi Dashboard Showcasing Project Summary Cost And Budget. This is a five stage process. The stages in this process are Engineering, Procurement And Construction, Construction Management, Engineering, Purchasing And Construction .
-
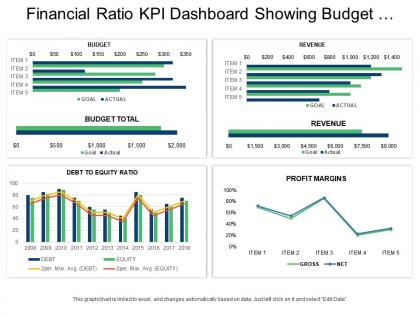 Financial ratio kpi dashboard snapshot showing budget revenue and profit margins
Presenting this set of slides with name - Financial Ratio Kpi Dashboard Snapshot Showing Budget Revenue And Profit Margins. This is a four stage process. The stages in this process are Accounting Ratio, Financial Statement, Financial Ratio.
-
 Financial ratio kpi dashboard showing cost of office space per employee and sales per employee
Presenting this set of slides with name - Financial Ratio Kpi Dashboard Showing Cost Of Office Space Per Employee And Sales Per Employee. This is a two stage process. The stages in this process are Accounting Ratio, Financial Statement, Financial Ratio.
-
 Financial ratio kpi dashboard snapshot showing delinquency charge offs and net worth ratio
Presenting this set of slides with name - Financial Ratio Kpi Dashboard Snapshot Showing Delinquency Charge Offs And Net Worth Ratio. This is a four stage process. The stages in this process are Accounting Ratio, Financial Statement, Financial Ratio.
-
 Financial ratio kpi dashboard showing iea total assets and return on investment
Presenting this set of slides with name - Financial Ratio Kpi Dashboard Showing Iea Total Assets And Return On Investment. This is a three stage process. The stages in this process are Accounting Ratio, Financial Statement, Financial Ratio.
-
 Financial ratio kpi dashboard showing liquidity ratio analysis current ratio and quick ratio
Presenting this set of slides with name - Financial Ratio Kpi Dashboard Showing Liquidity Ratio Analysis Current Ratio And Quick Ratio. This is a three stage process. The stages in this process are Accounting Ratio, Financial Statement, Financial Ratio.
-
 Financial ratio kpi dashboard snapshot showing liquidity ratio and profitability ratio
Presenting this set of slides with name - Financial Ratio Kpi Dashboard Snapshot Showing Liquidity Ratio And Profitability Ratio. This is a three stage process. The stages in this process are Accounting Ratio, Financial Statement, Financial Ratio.
-
 Financial ratio kpi dashboard showing revenue net profit margin and debt to equity
Presenting this set of slides with name - Financial Ratio Kpi Dashboard Showing Revenue Net Profit Margin And Debt To Equity. This is a five stage process. The stages in this process are Accounting Ratio, Financial Statement, Financial Ratio.
-
 Financial performance kpi dashboard showing regional sales status cash and ratios
Presenting this set of slides with name - Financial Performance Kpi Dashboard Showing Regional Sales Status Cash And Ratios. This is a four stage process. The stages in this process are Financial Performance, Financial Report, Financial Review.
-
 Marketing kpi dashboard showing visits traffic sources and bounce rate
Presenting this set of slides with name - Marketing Kpi Dashboard Showing Visits Traffic Sources And Bounce Rate. This is a three stage process. The stages in this process are Marketing, Branding, Promoting.
-
 R and d kpi dashboard showing cost related to product improvements and extensions
Presenting this set of slides with name - R And D Kpi Dashboard Showing Cost Related To Product Improvements And Extensions. This is a four stage process. The stages in this process are R And D, Research And Development, Research And Technological Development.
-
 R and d kpi dashboard showing declining margin headcount and number of patents per employee
Presenting this set of slides with name - R And D Kpi Dashboard Showing Declining Margin Headcount And Number Of Patents Per Employee. This is a four stage process. The stages in this process are R And D, Research And Development, Research And Technological Development.
-
 R and d kpi dashboard showing expenditure profit contribution and financial in percentage of revenue
Presenting this set of slides with name - R And D Kpi Dashboard Showing Expenditure Profit Contribution And Financial In Percentage Of Revenue. This is a five stage process. The stages in this process are R And D, Research And Development, Research And Technological Development.
-
 R and d kpi dashboard showing outsource ratio cost intensity by country and r and d to sales ratio
Presenting this set of slides with name - R And D Kpi Dashboard Showing Outsource Ratio Cost Intensity By Country And R And D To Sales Ratio. This is a four stage process. The stages in this process are R And D, Research And Development, Research And Technological Development.
-
 R and d kpi dashboard showing performance and expenditure by year
Presenting this set of slides with name - R And D Kpi Dashboard Showing Performance And Expenditure By Year. This is a four stage process. The stages in this process are R And D, Research And Development, Research And Technological Development.
-
 R and d kpi dashboard showing productivity based on gross margin
Presenting this set of slides with name - R And D Kpi Dashboard Showing Productivity Based On Gross Margin. This is a three stage process. The stages in this process are R And D, Research And Development, Research And Technological Development.
-
 R and d kpi dashboard showing spending this year and cost for new product
Presenting this set of slides with name - R And D Kpi Dashboard Showing Spending This Year And Cost For New Product. This is a five stage process. The stages in this process are R And D, Research And Development, Research And Technological Development.
-
 R and d kpi dashboard showing systematic discussion rate innovation engagement and sponsorship index
Presenting this set of slides with name - R And D Kpi Dashboard Showing Systematic Discussion Rate Innovation Engagement And Sponsorship Index. This is a four stage process. The stages in this process are R And D, Research And Development, Research And Technological Development.
-
 Rental and leasing kpi dashboard showing annual rent depot rental overview
Presenting this set of slides with name - Rental And Leasing Kpi Dashboard Showing Annual Rent Depot Rental Overview. This is a seven stage process. The stages in this process are Rental And Leasing, Dealing And Leasing, Rental And Engage.
-
 Rental and leasing kpi dashboard showing cash in bank total asset value equity
Presenting this set of slides with name - Rental And Leasing Kpi Dashboard Showing Cash In Bank Total Asset Value Equity. This is a three stage process. The stages in this process are Rental And Leasing, Dealing And Leasing, Rental And Engage.
-
 Rental and leasing kpi dashboard showing leases expiring leases by lessor
Presenting this set of slides with name - Rental And Leasing Kpi Dashboard Showing Leases Expiring Leases By Lessor. This is a four stage process. The stages in this process are Rental And Leasing, Dealing And Leasing, Rental And Engage.
-
 Rental and leasing kpi dashboard showing monthly income total properties net income
Presenting this set of slides with name - Rental And Leasing Kpi Dashboard Showing Monthly Income Total Properties Net Income. This is a three stage process. The stages in this process are Rental And Leasing, Dealing And Leasing, Rental And Engage.
-
 Rental and leasing kpi dashboard showing occupancy cost equity loan to value
Presenting this set of slides with name - Rental And Leasing Kpi Dashboard Showing Occupancy Cost Equity Loan To Value. This is a three stage process. The stages in this process are Rental And Leasing, Dealing And Leasing, Rental And Engage.
-
 Rental and leasing kpi dashboard showing properties by defect and actively let properties
Presenting this set of slides with name - Rental And Leasing Kpi Dashboard Showing Properties By Defect And Actively Let Properties. This is a six stage process. The stages in this process are Rental And Leasing, Dealing And Leasing, Rental And Engage.
-
 Rental and leasing kpi dashboard showing properties people payments rental revenue
Presenting this set of slides with name - Rental And Leasing Kpi Dashboard Showing Properties People Payments Rental Revenue. This is a five stage process. The stages in this process are Rental And Leasing, Dealing And Leasing, Rental And Engage.
-
 Rental and leasing kpi dashboard showing rent due today rent overdue properties tenanted
Presenting this set of slides with name - Rental And Leasing Kpi Dashboard Showing Rent Due Today Rent Overdue Properties Tenanted. This is a five stage process. The stages in this process are Rental And Leasing, Dealing And Leasing, Rental And Engage.


